Citation:
Xingshuai Ma, Chuanrui Huo, Xiaoniu Tu, Hua Tan, He Qi, Shi Liu, Jun Chen. Critical role of lanthanide for piezoelectricity in ReCa4O(BO3)3 crystals[J]. Chinese Chemical Letters,
2026, 37(12): 111895.
doi:
10.1016/j.cclet.2025.111895
Critical role of lanthanide for piezoelectricity in ReCa4O(BO3)3 crystals
English
Critical role of lanthanide for piezoelectricity in ReCa4O(BO3)3 crystals
Beijing Advanced Innovation Center for Materials Genome Engineering, Department of Physical Chemistry, University of Science and Technology Beijing, Beijing 100083, China
b.
Shanghai Institute of Ceramics, Chinese Academy of Sciences, Shanghai 201800, China
c.
School of Materials Science and Engineering, State Key Laboratory of Material Processing and Die & Mould Technology, Huazhong University of Science and Technology, Wuhan 430074, China
d.
School of Materials Science and Engineering, Hainan University, Haikou 570228, China
e.
Key Laboratory for Quantum Materials of Zhejiang Province, Department of Physics, School of Science, Westlake University, Hangzhou 310030, China
f.
Institute of Natural Sciences, Westlake Institute for Advanced Study, Hangzhou 310024, China
Received Date:
23 July 2025 Accepted Date:
24 September 2025 Revised Date:
23 September 2025 Available Online:
15 December 2026
Abstract:
The rare-earth calcium oxyborate ReCa4O(BO3)3 based crystals possess the outstanding performance in high-temperature piezoelectricity causing the industrial application extensively, quantitatively analyzing the intrinsic contribution of piezo-units is critical key for the further enhancement of piezo-performance as well as its thermal stability. In this work, we combine the deep-learning interatomic potential and first-principles calculation to clarify the dynamics and static properties, and the stress-strain method is utilized to measure the piezoelectricity and decompose the contribution of each piezo-unit. The quantitative analysis results show that the phonon localized behavior and the nature of chemical bonds, especially for the rare earth elements in oxygen octahedrons, are identified as the main reason for the difference of piezoelectricity as well as its thermal stability. This work may provide the brand-new strategy and perspective to investigate the unique function in sub-cells quantitatively and the reference to guide high performance materials design.
Piezoelectric materials have garnered extensively focus owing to their remarkable ability to facilitate bidirectional conversion between mechanical and electrical energy rooted in their non-centrosymmetric structure [1-3]. This dynamic interplay of energy conversion makes them indispensable in a diverse range of modern industrial applications [4-8]. Ferroelectrics, especially for perovskite-based ceramics and crystals, have attracted considerable interest for their splendid piezoelectric properties [9-12]. Through the formation of phase boundaries and introduction of relaxor behavior, further enhancement of piezoelectric response would be realized [13-15]. Owing to the existence of several equivalent polarization axis, polydomain state can universally be found in ferroelectric materials, which cannot be completely textured into a single domain in single crystals through complex poling procedure. Therefore, extrinsic contribution originated from micro-scale domain wall motion plays an ignorable role for the piezoelectricity, especially for relaxor ferroelectrics in which high-density low-symmetry domain walls separate the polar nanoregions, this increases difficulty for the deconvolution of intrinsic piezoelectric response from each functional unit and atom [16-20]. Moreover, the depolarization and polymorphic phase transition on heating not only limits the application temperature range (usually <400 ℃ for perovskites) far lower than their melting point but also further complicates the contributions and mechanism for piezoelectricity and thermal stability [21,22].
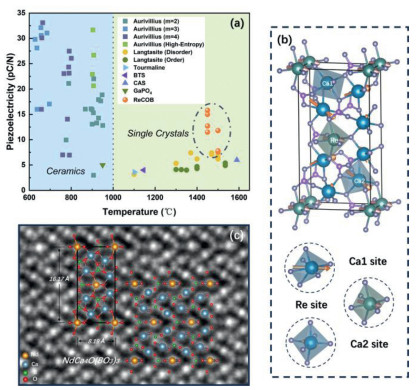
The urgent need for high-temperature piezoelectric materials has spurred extensive research. Fig. 1a presents several prominent candidates along with their approximate maximum operational temperatures. Below 1000 ℃, ceramics are predominantly favored due to their cost-effectiveness in preparation. Among these, Aurivillius-phase ferroelectric ceramics, which comprise a combination of perovskite and bismuth-oxygen layers, are particularly dominant owing to the tunability of their components and layer structures (e.g., though the high-entropy design, the superior performance acquired) [23]. However, at temperatures exceeding 1000 ℃, with the exception of a few systems, such as the perovskite-like layer-structured (PLS) [24], phase transitions of depolarization and a reduction in resistivity (falling below 106 Ω cm at 700 ℃ in the Aurivillius structure) occur, rendering these materials less viable. As a result, non-ferroelectric materials have become more suitable for high-temperature applications. Currently the mainstream non-ferroelectric piezoelectrics could be divided into several systems, that Gallium orthophosphate (GaPO4) [25,26], Ca2Al2SiO7 (CAS) [27], aluminum nitride (AlN) [25,28], Tourmaline [29], Ba2TiSi2O8 (BTS) [30,31], langasite family crystals [25,32-34] and rare-earth calcium oxyborate crystals (ReCOB) [25,35-38]. Among them, ReCa4O(BO3)3 (ReCOB, with Re: Y, Er, Nd, Gd, Pr and La in this work) crystals possess crucial status due to them not only remain the onefold steady structure and monotonic variation of piezoelectricity before melting point (exceeding ~1400 ℃) but also equip remarkable piezoelectric performance combined with high electrical resistivity (107–109 Ω cm at 700 ℃), making them irreplaceable in the field of ultra-high temperature vibration sensors [39]. Most importantly, ReCOB crystals are non-ferroelectric materials, the absence of multiple domain structure in ferroelectrics with different possible symmetries largely limits the application of design strategies, such as phase boundary design and domain engineering, for improving piezoelectricity. Every coin has two sides, the lack of external influence in the structure provides the foundation for quantitatively calculating piezoelectric contributions and facilitates the direct comparison between theoretical models and experimental results. In contrast to ferroelectrics, where the polarization direction can change under the influence of an external electric field even in polycrystalline ceramic, the single crystals or texture ceramics are needed for non-ferroelectric materials to maintain the macroscopic non-centrosymmetric symmetry. The high cost for crystal preparation and absence of guiding theory makes it very difficult to develop a new generation of non-ferroelectric crystals. Therefore, new theoretical analytical methods need to be developed to understand the intrinsic piezoelectric origin.
Figure 1
Figure 1.
(a) Relationship between piezoelectric coefficient (d33 or d26) and operating temperature for various ceramics and single crystals. (b) The structure of ReCOB and its three octahedral piezoelectric subunits, the orange arrows reveal the polarization vectors. (c) The iDPC-STEM image of NdCOB perpendicular to z zone axis.
Recent advancements in deep-learning have ushered in a transformative paradigm for simulating and understanding the dynamic behavior of materials [40,41]. The integration of deep-learning potentials (DP) with molecular dynamics (MD) simulations represents a cutting-edge methodology that enables the precise prediction of atomic-level interactions [42]. By training these models using atomic coordinates derived from Density Functional Theory (DFT) calculations, the neural network directly targets the corresponding system energy, providing a highly efficient and accurate approach to energy computation [43]. The training process of these DP models virtually mirrors the establishment of the effective Hamiltonian and empirical potentials commonly employed in traditional MD simulations, but from the deep-learning perspective that accounts for the inherent non-linearity and high-dimensionality of the interatomic interactions rather than relying on certain combinations of empirical formulas. Besides, one of the critical strengths of DP-based MD simulations is their ability to handle perturbations in the large-scale system, enabling the examination of localized structural variations and their subsequent impact on macroscopic material properties, thereby particularly powerful in investigating phenomena such as phase transitions, ferroelectric/piezoelectric behaviors and topological phases [44-46].
Even though algorithms have developed rapidly in recent years, it still lacks of a reliable model to calculated the macroscopic piezo-response directly from chemical composition. On the other hand, ferroelectrics with polydomain and ceramics with polycrystal exhibits large extrinsic contributions, which affects the piezo-response at microscale making them to be the inappropriate candidates before building a mature model. Therefore, based on the above discussion, it can be found that the ReCOB crystal is an ideal system to make a pioneering exploration using an advanced algorithm for the sub-cell quantitative decomposition for both piezoelectricity and its thermal stability. As a result, in this work, an algorithm model based on DP is built to excavate the universal internal mechanisms driving the piezoelectricity, which is further proved to be reliable by comparing with experimental results. The new method would not only guidance the discovery of new ReCOB ultra-high temperature crystal with higher piezoelectricity to meet the requirements of next-generation device applications but also be used to give a deeper understand for the intrinsic contributions in designing higher piezoelectricity materials.
The monoclinic ReCOB framework (Cm space group) consists of alternating lanthanide (Re) and calcium (Ca) octahedra embedded within a borate-oxygen network (Fig. 1b). Each Re3+ ion occupies a highly asymmetric octahedral site, coordinated by six oxygen atoms. The Ca2+ ions are classified into two categories: One category is similar to the Re3+ ions that possesses enormous distortion, while the other resides in a comparatively regular octahedral configuration. To describe the octahedral geometry more effectively, displacement vectors are used to quantify the degree of distortion. These vectors are defined as the difference between the central cation coordinate and the average position of its adjacent coordinating oxygen atoms:
Δr=rcation−1n∑i=1nrOi
(1)
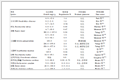
Table 1 presents the corresponding displacement vectors for various piezo-units in the NdCOB crystal, aligning with the intuitionistic octahedral morphology illustrated in Fig. 1b. Moreover, variations in the lanthanide elements directly influence the nominal radii of the substituted Re3+ cations, in Table S2, it demonstrates a high positive degree of correlation between them. Atomic-resolution aberration-corrected integrated differential phase contrast (iDPC) scanning transmission electron microscopy (STEM) was utilized to examine the localized structure, as depicted in Fig. 1c, for NdCOB crystals along the [010] zone axis. The consistency between the ideal structure and the iDPC-STEM mapping ensures the authenticity of the results, with the lateral view providing a clear depiction of the ideal displacement distribution in the two-dimensional plane.
Table 1
Table 1.
The piezoelectric subunit information of NdCOB. For each element, ionic displacement is defined as the difference between the center cationic coordinate and the average value of nearest neighbor coordination oxygen atoms.
The piezoelectric coefficient dij, a fundamental parameter in piezoelectric materials quantifies the relationship between the generated charge induced in the material versus the corresponding applied perturbations, which could be explained as the variation in polarization to external stress [1-3]. The formula can be written as
dαj=∂Pα∂σj|E=ΔPαΔσj|E
(2)
In which ΔPα present the variation of polarization along α direction (α=1,2,3), which be defined as the ionic displacement Δrα multiples the Born effective charge Zαα* along certain direction, in formula as
Pα=Zαα*·Δrα
(3)
and Δσj is the variation of stress (j=1,…,6). For instance, the shear piezoelectric coefficient d26 is specifically defined as the slope of the function that links the polarization along the y-axis to the shear stress applied in the xy-plane, which can be displayed as follow:
d26=ΔPyΔτxy
(4)
Previous experimental studies have demonstrated that the piezoelectric coefficient d26 in ReCOB crystals attains the maximum value within its piezoelectric tensor [25,35-38,46]. To validate this observation, we performed first-principles calculations leveraging the Density Functional Perturbation Theory (DFPT) method to obtain the piezoelectric matrix. Table 2 presents the static piezoelectric tensor for NdCOB derived from DFPT calculations, where d26 indeed exhibits the highest value (For further details, refer to Table S4 in Supporting information). However, ReCOB crystals exhibit not only different piezoelectric coefficient with various lanthanides but also significant dissimilarity of temperature sensibility, remaining the urgency to clarify the deeper mechanism to guide the material design and hindering the industrial application due to the demand of stability. With the training-sets constituted from DFT calculations, the Deep-learning Potential (DP) was constructed to depict the interatomic dynamic phenomenon with the aid of molecular dynamics (MD) simulation method. The performance of the model reveals the remarkable consistency between DP forecast and DFT result in energy and force as shown in Fig. S2 (Supporting information), moreover taking NdCOB as the example (Fig. S3 in Supporting information), the phonon spectrum and density of state further confirm the ability of DP models to describe dynamic characteristics.
Table 2
Table 2.
The static piezoelectric matrix from DFPT calculation of NdCOB crystal. The zero values are due to the symmetric restraint (unit: pC/N).
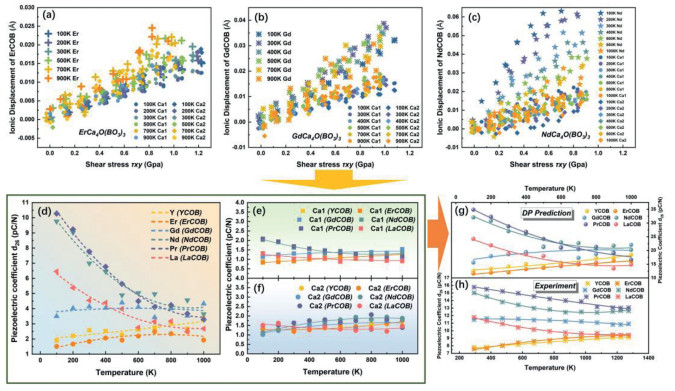
Leveraging the shear-strain method (Fig. S4 in Supporting information), the variable process above could be described in MD simulation. Figs. 2a-c present the relationship of three piezo-units (Re3+, Ca12+ and Ca22+) between stress and ionic displacement in ErCOB, GdCOB and NdCOB (for the others refer to Figs. S5-S10 in Supporting information) with the same strain alteration. Hence, the partial d26 of each piezo-unit could be excluded as Figs. 2d-f, where the lanthanides reveal disparate tendency both in temperature and types while remain tow calcium site nearly unchanged. The practical d26 of ReCOB crystals is the summation of each piezo-unit in formular as
d26=∑ici*d26i
(5)
while ci and d26i denote the number of i cation and its partial d26 within primitive cell (with the order being 2 for Re, 4 for Ca1, and 4 for Ca2, respectively). Figs. 2g and h present a comparison between the DP forecast and experimental measurements of the piezoelectric properties in ideal ReCOB crystals. The qualitative agreement, even within the same order of magnitude, underscores the potential of deep learning techniques in materials science, demonstrating their capacity to accurately predict material properties. However, it is important to note that some degree of deviation exists between the predicted and experimental values. This discrepancy may be partially attributed to the similarity in ionic radii between Re3+ and Ca2+, which can lead to issues related to disorder occupation in the crystal lattice, a factor not considered in this study but deemed essential for more precise predictions [47-49]. Nevertheless, leveraging DP method, the application of the shear-strain method enables the contribution extraction for individual cations, it may provide a neoteric perspective compared to traditional experimental approaches.
Figure 2
Figure 2.
(a-c) The raw-data of the relationship between the ionic displacement along y zone axis and the shear stress applied in the xy-plane at different temperatures within ErCOB, GdCOB and NdCOB, where the slope is in direct proportion to the shear piezoelectric coefficient d26. (d) The contribution of lanthanide site to d26 calculated from (a-c) at various temperature, revealing its temperature sensibility. (e, f) The contribution of two calcium sites to d26 remaining temperature independency opposite to the lanthanide. (g) The total d26 (the summation of lanthanide and calcium) obtained from DP calculation, exhibiting qualitative consistency with the trend observed in the thermal alterations of the experimental results. (h) The experimental measurements.
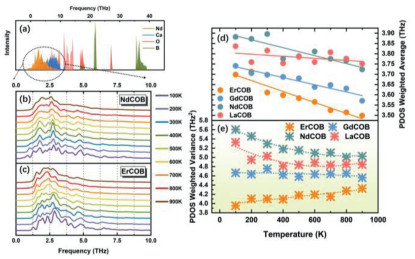
Phonon behavior is tightly tied to their dynamic properties, such as heat conduction, electron-phonon coupling in superconductors, and phonon softening effects in ferro/piezoelectric materials, therefore, it would offer valuable insights for the thermal stability of piezoelectricity [50-54]. In Fig. 3a, the PDOS derived from DPMD simulations for NdCOB, reveals that the phonon density associated with the lanthanide element is primarily concentrated in the low-frequency range of 0–15 THz. Utilizing Fourier Transform to Velocity Autocorrelation Function (FTVAF) method, the PDOS spectra for ReCOB with various lanthanide substitutions can be plotted across a temperature range from 100 K to 900 K, as shown in Figs. 3b and c for Er3+ and Nd3+ as examples (further details refer to Figs. S11 and S12 in Supporting information) [55,56]. This approach accounts for anharmonic phonon contributions, meaning that the shape of the PDOS is predominantly influenced by anharmonic phonon behavior. Given the definition of weighted average ω¯ and weighted variance (ω−ω¯)2‾ for PDOS to further aid in understanding these effects, that
ω¯=∫ω·PDOS(ω)·dω∫PDOS(ω)·dω
(6)
(ω−ω¯)2‾=∫(ω−ω¯)2·PDOS(ω)·dω∫PDOS(ω)·dω
(7)
Figure 3
Figure 3.
Phonon dynamic. (a) The phonon density of states (PDOS) distribution of NdCOB acquired from DPMD simulation, where the lanthanides almost distribute at the region of low-frequency. (b, c) The PDOS of Er3+ and Nd3+via various temperatures obtained by the Fourier transform to velocity autocorrelation function method with DPMD. (d) The average weighted phonon vibration frequency ω¯ of PDOS. (e) The corresponding average weighted variance (ω−ω¯)2‾ of PDOS, which reflects the degree of localization of phonons.
The morphology of PDOS curve can be described quantitatively as shown in Figs. 3d and e, where the alteration in ω¯ reflects the influence of anharmonic interactions across various temperatures, meanwhile the variance (ω−ω¯)2‾ provides insights into the degree of localization or delocalization of the phonon frequency distributions. If the system is consisted solely of harmonic phonons, the PDOS would remain temperature-independent, while the morphology of PDOS spectrum will remain unchanged. In the meantime, as shown in Fig. 3d, the ω¯ for ReCOB with different lanthanides emerges a clear redshift via temperature increases, indicating the softening behavior in phonons due to anharmonic interactions. Additionally, as shown in Fig. 3e, the changes in (ω−ω¯)2‾ correlate strongly with the variations in the shear piezoelectric coefficient contribution from the Re3+ subcell (Fig. 2d), implying possibly physical dependency in some extent. Specifically, the variance decreases on heating for Nd3+, suggesting a reduced sensitivity of the phonon frequency distribution to different wave vectors, leading to more localized phonon behavior. In contrast, for Er3+, the trend is reversed, with phonon states becoming more delocalized.
Deep-learning potentials are employed to describe the dynamics of ReCa4O(BO3)3, where the lanthanide ions are found to primarily influence the material’s piezoelectric properties and their thermal evolution. However, to fully understand the underlying mechanisms, it is crucial to explore the contribution to piezoelectricity from a localized atomic perspective. To address this, density functional theory (DFT) calculations are utilized to analyze the electronic distribution and chemical bonding interactions at the atomic level.
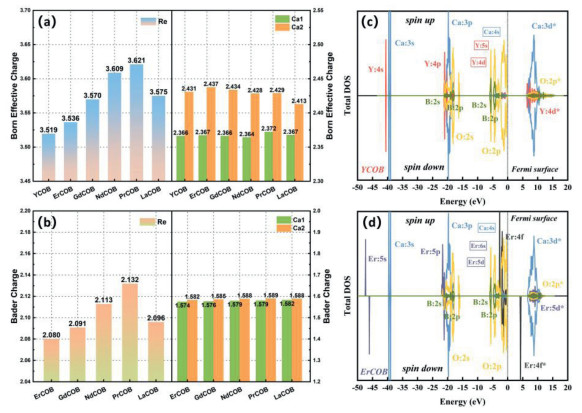
Figs. 4a and b present the Born effective charge (BEC) and Bader charge along y axis for each cation [57,58]. Overall, doping with different lanthanide elements induces significant anisotropy in the charge distribution of Re3+ ions, particularly when compared to the two different occupancy states of the Ca2+ sites. Notably, both charge analysis methods consistently reveal that the variation in Re3+ ions follows a trend closely mirroring the experimental piezoelectric coefficient measured in room temperature [23-25]. This alignment suggests a strong correlation between the charge dynamics of Re3+ ions and the material’s piezoelectric behavior.
Figure 4
Figure 4.
Electronic behavior analysis. (a) The Born effective charge and (b) Bader charge in various piezo-unit of ReCOB, where the lanthanide site reveals charge sensitivity opposite to calcium site. The electronic density of states in (c) YCOB and (d) ErCOB, with orbital labels for each element indicated near the peaks. The fonts within the box represent the vanishing orbital states due to electronic transfer and bond formation. Near the Fermi level (located at 0 eV), the regions below and above respectively represent the valence band and conduction band (denoted by "*"), where the occurrence of 4f state shrinks the band gap.
For BEC, it serves as an indicator of the polarization response of ions in a crystal under external perturbations. A larger BEC suggests that the ions are more likely to undergo substantial displacements in response to the external field, which is of particular significance in ferroelectric and piezoelectric materials. This can be described by the relationship between the atomic force and the electric field as
Zij*=−eδFiδEj
(8)
where Fi represents the force along the i-direction on an ion and Ej corresponds to the component of the electric field along the j-direction. In a given system, a larger BEC leads to a stronger force on the atoms under the same electric field. Physically, both external electric fields and mechanical stress exert similar effects, inducing forces that cause ions to adjust to a new equilibrium. This means that a higher BEC results in larger atomic displacements under a fixed external stimulation, which in turn reflects on the enhancement of the piezoelectric coefficient.
Bader charge analysis is used to examine the gain or loss of charge by ions, based on the zero-flux surface [58], helping to understand charge transfer within the system. Among the lanthanides in Fig. 4b, Pr3+ has the highest valence of +2.132, suggesting a stronger ionic character due to electron loss, bringing it closer to its nominal charge of +3. In contrast, Er3+ demonstrates a stronger covalent character. Covalent bonds, being more directional, possess stronger bond configuration and insensitive to external perturbations from traditional knowledge. Another most obvious manifestation is from the perspective of stress, as shown in Figs. 2b-d, ErCOB requires significantly higher stress (~1.2 GPa) compared to NdCOB (~0.9 GPa) under the same maximum strain, leading to a reduction in piezoelectric response owing to both the smaller ionic displacements and enhancement of stress.
Figs. 4c and d present the electronic density of states (EDOS) for YCOB and ErCOB (see Fig. S18 in Supporting information for others). Generally, the electrons near the Fermi level are involved in the formation of chemical bonds. Due to the high electronegativity of oxygen, electron density flows from adjacent metallic elements toward oxygen. For the elements Y, Er, and Ca, the covalent electrons are Y: 5s, Y: 4d, Er: 6s, Er: 5d, and Ca: 4s, respectively. These orbitals exhibit significant depletion near the Fermi surface, leaving only the O 2p orbitals, which indicates the formation of chemical bonds through electron transfer and ionicity. However, the 4f electrons of Er3+ near the Fermi level disrupt this condition (Fig. 4d). This deviation is attributed to the localization of the 4f electrons (Fig. S19 in Supporting information), which, despite their energy proximity to the Fermi surface, do not directly participate in bond formation. Additionally, the Er: 4f* conduction bands above the Fermi level result in a narrowing of the band gap, thereby enhancing the intrinsic conductivity of the material. Our DFT calculations demonstrate that the band shifts in response to varying lanthanide doping align well with the tendency of experimental observations, as shown in Fig. S18 (ignoring the contribution of oxygen vacancies’ migration [59]). Although the 4f electrons do not engage directly in chemical bonding, they exert a significant indirect influence on the energy levels of other orbitals due to the shielding effect they impose on the atomic nucleus, as evidenced in Table S6 (Supporting information). For instance, in Fig. 4d, the localized deep orbital Er: 5s breaks the symmetry of the system due to the unequal distribution of the spin-up (5 electrons) and spin-down (7 electrons) 4f states. Furthermore, the localization of the 4f electrons induces asymmetry in EDOS, characterized by a non-uniform distribution between spin-up and spin-down states, which in turn contributes to the material’s unique magnetic and optical properties [60,61]. Thus, while the 4f electrons do not directly participate in chemical bonding, they modulate the energy levels of surrounding orbitals and influnce the ionic radius.
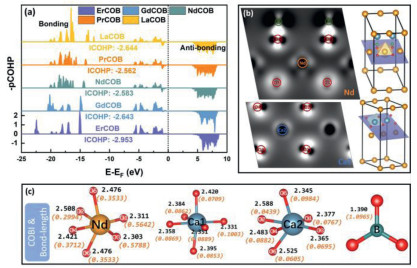
Valence bond analysis may provide other perspective for understanding the mechanism. Crystal orbital Hamilton population (COHP) analysis, a quantitative method for analyzing atomic interactions in a crystal, further supports these observations [62]. The integrated COHP below the Fermi level (ICOHP) provides a measure of bond strength. As shown in Fig. 5a, the average ICOHP for Er3+ with its coordinated oxygen atoms is higher (greater absolute value), suggesting stronger chemical bonding than in Pr3+, being consistent with covalent situation of Er3+. Additionally, the presence of anti-bonding states below the Fermi level in Pr3+, indicates weaker bond stability and stronger ionicity in Pr3+ in comparison to Er3+ as well. Furthermore, Crystal Orbital Bond Indices (COBI) analysis could measure the property to a single bond [63]. A value closer to zero indicates a more ionic bond, while a value approaching one reflects a covalent nature. In Fig. 5c, we display the local bonding features of each piezoelectric unit in NdCOB, with orange fonts representing bond COBI and black fonts showing bond lengths. Overall, Ca2+ demonstrates a strong ionic character, while the bond between B3+ and oxygen is almost purely covalent. Meanwhile, the bond between Nd3+ and oxygen has a hybrid character, resembling that of Ti4+ in ferroelectric BaTiO3, sitting in an intermediate state. This hybrid nature is sensitive to changes in bond length, meaning the physical properties of the Re3+ unit can fluctuate with temperature due to the thermal expansion and the non-homophonic phonons, while the ionic calcium remains largely unaffected by such changes. For Nd3+, Fig. 2d highlights notable directional anisotropy in the COBI values. Along the y-axis, the Nd-O5 and Nd-O6 bonds exhibit a COBI value of 0.3533 (bond length of 2.476 Å). In contrast, within the xz-plane, two strong covalent bonds appear: Nd-O1 (COBI: 0.5642) and Nd-O3 (COBI: 0.5788). The strength of these covalent bonds restricts the movement of Nd3+ within the xz-plane, resulting in lower piezoelectric coefficients daj along the x and z axes when a = 1 and 3 (Table 2). The Differential Charge Density of NdCOB within two specific planes is illustrated in Fig. 5b, where the lighter regions represent electron accumulation opposite to the electron depletion in darker regions. The prominent lighter region along the line connecting boron and oxygen highlights significant electronic hybridization, which is indicative of a covalent bonding nature. Additionally, the variation in the distribution of light and dark regions around the Nd-O1 and Nd-O2 bonds aligns with the observations in Fig. 5c, that Nd-O1 exhibit more covalent than Nd-O2. Regarding calcium, the clear gap between the calcium cation and the adjacent oxygens suggests a predominantly ionic bonding character.
Figure 5
Figure 5.
Chemical bond analysis. (a) Average integrated crystal orbital Hamilton population (iCOHP) Re site with its coordination oxygen, the value directly related to the bond strength. (b) The charge density difference mapping of NdCOB in various plane respectively containing Nd and Ca2 cations. (c) Crystal Orbital Bond Indices (COBI) to each cation of NdCOB with its adjacent oxygen, the black and organ fonts represent bond length and COBI respectively, the COBI value evolves from 0 to 1 reflecting a transition from ionicity to covalency.
In summary, through multi-perspective conjoint analysis, we elucidate the mechanism and contribution of piezoelectric properties of ReCOB systems from each sub-unit. Leveraging the DP guidance for the dynamic calculation, the shear piezoelectricity d26 was obtained by the stress-strain method aligning the experimental result, that highlights the great capacity of artificial neural networks in materials science. The lanthanide site in ReCOB contribute the discrepancy of piezoelectricity and its thermal altering, while the contribution from calcium remains unchanged. The localization of phonons is closely linked to the temperature-dependent drift of piezoelectric performance, suggesting that the distribution of chemical bonds, modulated by anharmonic phonons, plays a pivotal role in driving the temperature stability. For static calculations, charge and chemical bonds analysis reveals that the strength of the chemical bonds of Re3+ cations exhibits a clear inverse correlation with piezoelectric performance, suggesting that bonds with a totally more ionic character are more favorable for enhancing piezoelectricity. The 4f orbital does not participate in the formation of chemical bonding, but by altering the energy-level and the ionic radius by the shielding effect on atomic nuclei. This work presents a distinctive approach to understanding the mechanisms in non-ferroelectric materials and provides essential insights and guidance for the design of new materials.
CRediT authorship contribution statement
Xingshuai Ma: Writing – original draft, Visualization, Software, Methodology, Investigation, Data curation, Conceptualization. Chuanrui Huo: Visualization, Formal analysis. Xiaoniu Tu: Supervision, Investigation, Data curation. Hua Tan: Supervision, Methodology, Formal analysis, Data curation, Conceptualization. He Qi: Writing – review & editing, Writing – original draft, Supervision, Funding acquisition, Conceptualization. Shi Liu: Writing – review & editing, Investigation, Formal analysis, Conceptualization. Jun Chen: Writing – review & editing, Supervision, Funding acquisition.
Declaration of competing interest
The authors declare that they have no known competing financial interests or personal relationships that could have appeared to influence the work reported in this paper.
Acknowledgments
This work was supported by the National Key R&D Program of China (No. 2022YFB3204000) and the Beijing Outstanding Young Scientist Program (No. JWZQ20240101015).
Supplementary materials
Supplementary material associated with this article can be found, in the online version, at doi:10.1016/j.cclet.2025.111895.
R. Dronskowski, P.E. Bloechl, J. Phys. Chem. 97 (1993) 8617–8624. doi: 10.1021/j100135a014
[63]
P.C. Müller, C. Ertural, J. Hempelmann, R. Dronskowski, J. Phys. Chem. C 125 (2021) 7959–7970. doi: 10.1021/acs.jpcc.1c00718
Figure 1
(a) Relationship between piezoelectric coefficient (d33 or d26) and operating temperature for various ceramics and single crystals. (b) The structure of ReCOB and its three octahedral piezoelectric subunits, the orange arrows reveal the polarization vectors. (c) The iDPC-STEM image of NdCOB perpendicular to z zone axis.
Figure 2
(a-c) The raw-data of the relationship between the ionic displacement along y zone axis and the shear stress applied in the xy-plane at different temperatures within ErCOB, GdCOB and NdCOB, where the slope is in direct proportion to the shear piezoelectric coefficient d26. (d) The contribution of lanthanide site to d26 calculated from (a-c) at various temperature, revealing its temperature sensibility. (e, f) The contribution of two calcium sites to d26 remaining temperature independency opposite to the lanthanide. (g) The total d26 (the summation of lanthanide and calcium) obtained from DP calculation, exhibiting qualitative consistency with the trend observed in the thermal alterations of the experimental results. (h) The experimental measurements.
Figure 3
Phonon dynamic. (a) The phonon density of states (PDOS) distribution of NdCOB acquired from DPMD simulation, where the lanthanides almost distribute at the region of low-frequency. (b, c) The PDOS of Er3+ and Nd3+via various temperatures obtained by the Fourier transform to velocity autocorrelation function method with DPMD. (d) The average weighted phonon vibration frequency ω¯ of PDOS. (e) The corresponding average weighted variance (ω−ω¯)2‾ of PDOS, which reflects the degree of localization of phonons.
Figure 4
Electronic behavior analysis. (a) The Born effective charge and (b) Bader charge in various piezo-unit of ReCOB, where the lanthanide site reveals charge sensitivity opposite to calcium site. The electronic density of states in (c) YCOB and (d) ErCOB, with orbital labels for each element indicated near the peaks. The fonts within the box represent the vanishing orbital states due to electronic transfer and bond formation. Near the Fermi level (located at 0 eV), the regions below and above respectively represent the valence band and conduction band (denoted by "*"), where the occurrence of 4f state shrinks the band gap.
Figure 5
Chemical bond analysis. (a) Average integrated crystal orbital Hamilton population (iCOHP) Re site with its coordination oxygen, the value directly related to the bond strength. (b) The charge density difference mapping of NdCOB in various plane respectively containing Nd and Ca2 cations. (c) Crystal Orbital Bond Indices (COBI) to each cation of NdCOB with its adjacent oxygen, the black and organ fonts represent bond length and COBI respectively, the COBI value evolves from 0 to 1 reflecting a transition from ionicity to covalency.
Table 1.
The piezoelectric subunit information of NdCOB. For each element, ionic displacement is defined as the difference between the center cationic coordinate and the average value of nearest neighbor coordination oxygen atoms.


 DownLoad:

 下载:


 下载:

