Figure 1.
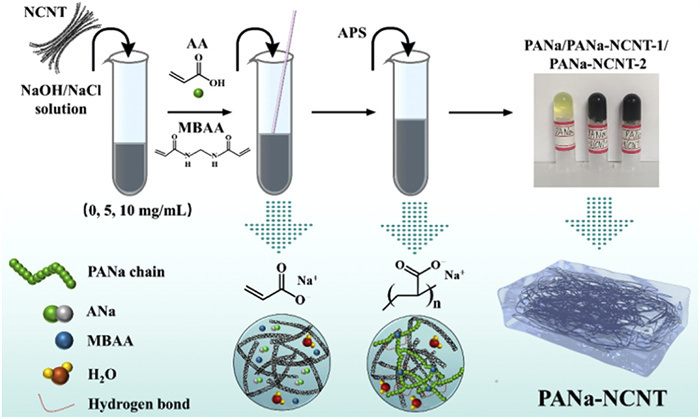
The preparation process and mechanism diagram of PANa-NCNT.
Constructing high-performance quasi-solid-state sodium-air batteries with water-soluble discharge products using heterogeneous hydrogel electrolytes
Bowen Xu , Hongkun Zhang , Xuantian Feng , Da Zhang , Bin Yang , Feng Liang

The intensification of global warming and the rapid depletion of fossil fuels have accelerated the development of efficient and sustainable energy storage devices [1,2]. Among the novel energy storage devices under development, sodium-air batteries (SABs) have attracted significant attention due to their high theoretical energy density, environmental friendliness, and the abundance of sodium resources. Traditional SABs typically utilize liquid electrolytes to achieve electrochemical energy storage performance. However, the unique open system of air batteries presents potential safety hazards, including electrolyte decomposition, leakage, and combustion, while also limiting their cycle life, significantly hindering the practical application of SABs [3,4].
In this context, using a gel electrolyte instead of a liquid electrolyte for the preparation of quasi-solid-state SABs provides an effective strategy to address the aforementioned issues [5,6]. Ha et al. conducted the first study on the application of gel electrolytes in SABs in 2019, discovering that gel electrolytes containing ionic liquids can significantly inhibit side reactions within the batteries [7]. Subsequently, Chen et al. reported a gel electrolyte based on tetraethylene glycol dimethyl ether and first constructed the quasi-solid-state SAB, which was capable of avoiding electrolyte leakage and could operate stably even in a folded state [8]. Although quasi-solid-state SABs have made significant progress since their introduction, some challenges remain. Beyond the poor thermodynamic stability and low ionic conductivity of gel electrolytes, the development of quasi-solid-state SABs is primarily restricted by the generation of insoluble discharge products (Na2O2 or NaO2) [9,10]. This leads to the formation of unfavorable solid-solid interfaces during battery operation processes, which significantly limits rate capability and cycling stability [11,12]. Therefore, to advance the quasi-solid-state SABs field, it is crucial to develop gel electrolytes with excellent thermodynamic stability and ionic conductivity and to construct SABs that can prevent insoluble discharge product formation.
This paper reports a quasi-solid-state SAB capable of operating in an air atmosphere, with highly water-soluble NaOH as the main discharge product. The quasi-solid-state SAB was prepared using a hydrogel electrolyte (PANa-NCNT), which was formed by employing sodium polyacrylate (PANa) and nitrogen-doped carbon nanotubes (NCNT) as the gel network matrix, with a saturated NaOH/NaCl aqueous solution as the liquid component. The physical entanglement of NCNT with PANa in the PANa-NCNT hydrogel electrolyte led to the formation of a heterogeneous gel structure dominated by mesopores. This unique gel structure minimized the escape channels for water molecules, reducing the free water content in PANa-NCNT to 88.5%, enhancing the thermodynamic stability of hydrogel electrolyte. Furthermore, the aqueous components in the PANa-NCNT hydrogel electrolyte played a key role in determining the type of electrochemical reactions occurring in the quasi-solid-state SAB. The quasi-solid-state SAB prepared from PANa-NCNT hydrogel undergoes the oxygen reduction reaction (ORR) via a 2e- pathway during discharge and the oxygen evolution reaction (OER) via a mixed 2e-/4e- pathway during charge. Owing to these advantages, the quasi-solid-state SABs assembled with the PANa-NCNT-2 hydrogel exhibited excellent electrochemical performance, maintaining stable cycling for 187 h even at 0.5 mA/cm2. To the best of our knowledge, this is the first report of a hydrogel electrolyte being applied to quasi-solid-state SABs.
The preparation process of the PANa-NCNT hydrogel electrolyte is shown in Fig. 1. Initially, NCNT was dispersed in a saturated NaOH/NaCl solution using ultrasonic dispersion to create the substrate solution. Next, acrylic acid (AA) monomer and N,N'-methylenebisacrylamide (MBAA) crosslinker were added to this solution to form the precursor solution. During this step, the OH functional group on the AA was substituted with sodium to form sodium acrylate (ANa). The initiator ammonium persulfate (APS) was then introduced to initiate free-radical polymerization, leading to the breaking of the C═C double bond of the ANa monomer and the formation of a 3D polymer network, thereby achieving the gelation of PANa-NCNT [13]. The amount of APS added is critical for the formation of the hydrogel electrolyte. Specifically, as the APS concentration increased, the color of the precursor solution gradually changed from transparent to light yellow (Fig. S1 in Supporting information). When the amount of APS solution in the precursor solution reached 40 µL, the liquid phase fully transitioned into a gel state. Even when the container was inverted, the hydrogel adhered firmly to the inner glass wall, resisting flow due to gravity. The prepared hydrogel samples were labeled as PANa, PANa-NCNT-1, and PANa-NCNT-2 hydrogel electrolytes, corresponding to substrate solutions with NCNT contents of 0, 5, and 10 mg/mL, respectively.
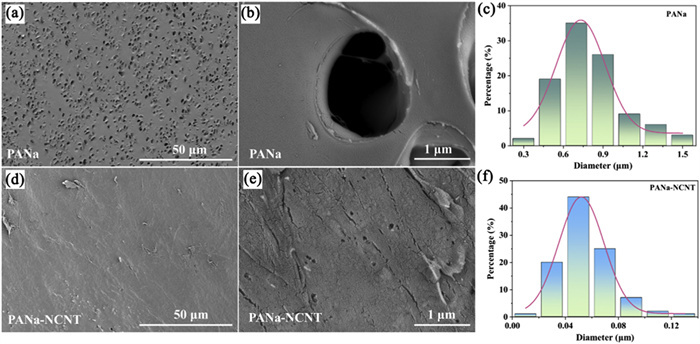
To investigate the effect of NCNT on the microscopic morphology of the hydrogel, cryogenic scanning electron microscopy (cryo-SEM) was employed to characterize the cross-sectional features [14]. As shown in Figs. 2a and b, the pure PANa hydrogel exhibits a grid-like structure dominated by large pores. The average diameter is approximately 0.8 µm, and the overall structure is loose (Fig. 2c). The large pores facilitate the escape of water molecules. When exposed to air, a significant amount of free water rapidly exits through these pores, leading to poor water retention in the PANa hydrogel. In contrast to the PANa hydrogel, the introduction of NCNT disrupts the uniform distribution of PANa, and the entanglement between PANa and NCNT results in a heterogeneous gel network. As shown in Figs. 2d and e, the PANa-NCNT gels contain numerous fine and dense pores, significantly smaller than those in the PANa hydrogel. Their average pore size is about 0.05 µm, which is sixteen times smaller than that of the PANa hydrogel (Fig. 2f). This reduction in pore size limits the escape of water molecules from hydrogel, providing a significant advantage in water retention. Fig. S2 (Supporting information) presents optical images of the hydrogels before and after seven days of static testing under room temperature conditions (30 ℃, RH: 40%). As shown in Figs. S2a and b, the fresh PANa hydrogel is transparent. After seven days of exposure, it loses water, resulting in severe salt crystallization on its surface. In contrast, only a small amount of white crystalline salt appears in the PANa-NCNT hydrogel after seven days, indicating better water retention properties (Figs. S2c and d). Subsequently, the hydrogel was completely dried at 80 ℃ and fractured under liquid nitrogen. The section morphology of the hydrogel was characterized by scanning electron microscopy (SEM) to explore the structure stability. As shown in Figs. S3a and b (Supporting information), water loss from the PANa hydrogel leads to severe structural changes. In the dried PANa hydrogel, the pore structure of fresh PANa hydrogel completely disappeared, and large voids and extensive cracks were generated, indicating the unsatisfactory structural stability of PANa hydrogel. However, the section of PANa-NCNT is very dense and densely packed with fold structures (Figs. S3c and d in Supporting information). This indicates that the heterogeneous structure formed by the introduction of NCNT enhances the structural stability of hydrogel, which provides the possibility for the stable operation of the quasi-solid-state SAB.
To further investigate the effect of NCNT introduction on the crystal structure of PANa hydrogel, X-ray diffractometer (XRD) tests were conducted on three samples: NCNT, PANa, and PANa-NCNT. As shown in Fig. 3a, NCNT exhibited two distinct crystalline diffraction peaks at approximately 26.14° and 43.47°, corresponding to the (002) and (101) planes of the graphitized structure, respectively, indicating the graphitic nanostructures of NCNT. PANa displayed two broad, low-intensity diffraction peaks at approximately 32.87° and 44.76°, indicating its semi-crystalline nature [15]. Notably, the prepared PANa-NCNT samples did not show discernible characteristic peaks corresponding to the (002) and (101) faces of NCNT, suggesting that NCNT was uniformly dispersed within the hydrogel. Fig. 3b shows the Fourier transform infrared spectroscopy (FT-IR) test results for NCNT, PANa, and PANa-NCNT. In the FT-IR spectrum of NCNT, the peak at 1112 cm-1 represents the characteristic absorption of graphitized nitrogen, the peak at 1400 cm-1 is associated with the graphite-structured walls of NCNT, the absorption peak at 1651 cm-1 is attributed to pyridinic nitrogen, the characteristic absorption peak at 3353 cm-1 corresponds to the stretching vibration of O–H water molecule bond in the interlayer [16]. In the FT-IR spectrum of PANa, the peak at approximately 1321 cm-1 corresponds to the C–C bond vibration, while the peak at 1404 cm-1 corresponds to the symmetric stretching vibration of C═O. A small peak at 1445 cm-1 is related to the planar rocking vibration of (CH2)n. The peak at 1554 cm-1 is primarily due to the carboxylate ion (COO-) vibration [17]. The peak at 1651 cm-1 corresponds to the bending vibration of the H–O–H water molecule. The small peak at 2926 cm-1 is attributed to the asymmetric vibration of CH2 [18,19]. No new absorption peaks other than those of PANa and NCNT appeared in the FT-IR spectrum of PANa-NCNT, and the peak positions were not shifted, indicating that PANa and NCNT are mainly connected by physical entanglement.
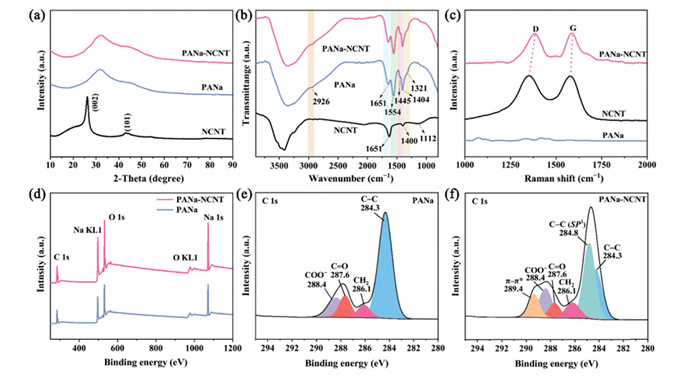
As shown in Fig. 3c, Raman spectroscopy tests revealed D (defect) peaks at approximately 1350 cm-1 and G (graphite) peaks at approximately 1577 cm-1, representing disorder defects and sp2 hybrid carbon, respectively [20]. For PANa, the characteristic peaks of NCNT were not detected. Compared to PANa, the appearance of D and G peaks corresponding to NCNT in the PANa-NCNT spectra confirms the successful introduction of NCNT. Compared to NCNT, the D and G peaks of PANa-NCNT shifted to higher positions, indicating charge transfer between NCNT and PANa within the hydrogel. Subsequently, the elemental composition of PANa and PANa-NCNT was analyzed by X-ray photoelectron spectroscopy (XPS). As shown in Fig. 3d, both PANa and PANa-NCNT hydrogels contained the C, O, and Na elements. Figs. 3e and f show the XPS high-resolution spectra and peak fitting results for the elemental C. In the high-resolution C 1s spectra for PANa, four distinct peaks are observed at 284.3, 286.1, 287.6, and 288.4 eV, corresponding to the C–C, CH2, C═O, and COO– bonds, respectively [21,22]. For PANa-NCNT, in addition to the same bonds observed in PANa, peaks corresponding to C–C(sp3) and π-π* carbon bonds from NCNT were observed at 284.8 and 289.4 eV, respectively [23]. These results further suggest that the PANa-NCNT gel is physically entangled with PANa and NCNT, and that NCNT did not undergo a chemical reaction with PANa.
To investigate the effect of the introduction of NCNT in hydrogels on water molecules, low-field nuclear magnetic resonance (LF-NMR) was used to measure the T2 relaxation curves of PANa and PANa-NCNT gels. The portion of the T2 relaxation curve < 0.01 ms corresponds to bound water molecules, the range between 0.01 ms and 100 ms represents less mobile water molecules, and the segment from 100 ms to 1000 ms corresponds to highly mobile free water molecules [24,25]. As shown in Fig. 4a, PANa-NCNT exhibits weaker characteristic peak intensity for free water compared to PANa, indicating reduced free water content. The leftward shift of the free water peak further indicates restricted motion of free water molecules in PANa-NCNT, demonstrating that the PANa-NCNT gel confines water more effectively than that of PANa. Fig. 4b shows the normalized data of the peak areas of different water components, which were used to analyze the relative content of different water components in hydrogel. As depicted in the figure, the free water content in PANa-NCNT is 88.5%, lower than that of PANa at 96.7%. Additionally, the percentages of bound water and less mobile water are 3.7% and 7.8%, respectively, both higher than the bound water (1.6%) and less mobile water (1.7%) in PANa. This suggests that the introduction of NCNT alters the uniform distribution of PANa and improves the pore structure of the hydrogel, enhancing its water retention performance. Fig. 4c presents the thermogravimetric analysis (TG) curves of the prepared hydrogel electrolytes in the temperature range of 30–150 ℃. The results indicate that the mass of both PANa and PANa-NCNT hydrogels decreases with rising temperature due to the evaporation of free water. At around 80 ℃, both PANa and PANa-NCNT hydrogels reach their peak mass loss. Compared to the peak mass loss of PANa hydrogel (4.36%/min), PANa-NCNT hydrogel exhibits a smaller peak mass loss (4.03%/min), further suggesting that PANa-NCNT has better water retention.
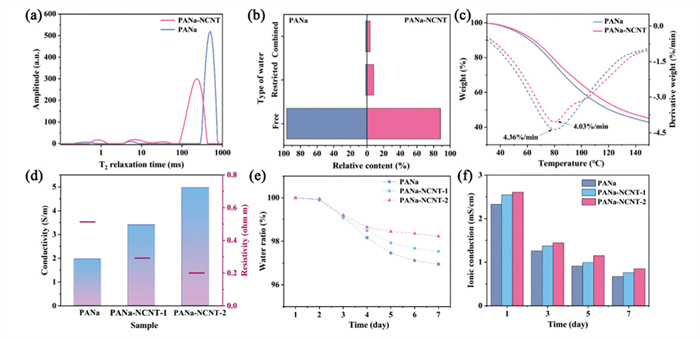
The addition of NCNT into hydrogels not only enhances their microstructure, improving thermodynamic and structural stability, but also has the potential to alter their physicochemical properties. As shown in Fig. 4d, the electronic conductivity of PANa-NCNT hydrogels with different NCNT contents was measured using a four-probe method. The results reveal that the conductivity of all hydrogel samples remained above 1.0 S/m, and the conductivity of PANa-NCNT-2 with higher NCNT content reached 4.97 S/m. With the increase of NCNT content in hydrogel, the conductivity of PANa-NCNT-2 increased from 1.96 S/m to 3.40 S/m, and the resistance decreased from 0.51 ohm m to 0.20 ohm m. This indicates that the incorporation of NCNT somewhat increased the electronic conductivity of PANa. Furthermore, the water retention capabilities of different hydrogels were analyzed using a continuous weighing method in an open environment at room temperature (30 ℃, RH: 40%). As shown in Fig. 4e, the PANa hydrogel exhibited the lowest water retention, with only 96.90% of its initial mass remaining after seven days of static testing. In contrast, the PANa-NCNT hydrogels showed higher water retention rates, which gradually increased with the NCNT content. Specifically, the water retention rate was 97.50% for PANa-NCNT-1, and 98.20% for PANa-NCNT-2, which had a higher NCNT content. The ionic conductivity of the hydrogels was calculated from electrochemical impedance spectroscopy (EIS) spectra obtained over different days of static testing (Fig. 4f and Fig. S4 in Supporting information). For fresh hydrogel samples, the ionic conductivity of PANa was 2.33 mS/cm, whereas PANa-NCNT-1 and PANa-NCNT-2, containing NCNT, had ionic conductivities of 2.54 and 2.60 mS/cm, respectively. This suggests that the introduction of NCNT, which produces a non-homogeneous structure, contributes to enhancing the ionic conductivity of the hydrogels. As the static test duration increases, water loss in the hydrogel inevitably leads to a decrease in ionic conductivity. After seven days of testing, the ionic conductivity of PANa was 0.67 mS/cm, while PANa-NCNT-1 and PANa-NCNT-2 had ionic conductivities of 0.76 and 0.85 mS/cm, respectively. This further indicates that the incorporation of NCNT significantly improves the water retention of the hydrogel.
Fig. 5a shows the schematic structure of the prepared quasi-solid-state SABs. The cathode of this battery consists of hydrogel and commercial Pt/C + RuO2 (Fig. S5 in Supporting information), while the separator is a Na3Zr2Si2PO12 (NASICON) solid electrolyte, and the anode is composed of organic electrolyte and sodium metal. The redox reaction mechanism of the constructed quasi-solid-state SABs was studied using cyclic voltammetry (CV). As shown in Fig. 5b, the CV curves of the quasi-solid-state SABs prepared with different hydrogel electrolytes exhibit similar characteristics, indicating that they undergo identical redox reactions. Specifically, the reduction currents of PANa and PANa-NCNT-1 as well as PANa-NCNT-2 all appeared around 2.60 V, indicating the occurrence of ORR [26]. And the oxidation current appears at about 2.90 V, which indicates the occurrence of OER [27]. This suggests that the addition of NCNT into hydrogels does not alter the type of redox reactions in SABs. The voltage curves of the quasi-solid-state SABs fabricated with different hydrogels at a current density of 0.1 mA/cm2 are shown in Fig. 5c. For the battery using the PANa hydrogel, the discharge and charge voltages were 2.46 and 3.01 V, respectively, resulting in an overpotential gap of 0.55 V. The quasi-solid-state SABs using hydrogels with added NCNT exhibited improved discharge and charge voltages, with battery performance increasing as the NCNT content increased. Among these, PANa-NCNT-2, which contained a higher amount of NCNT, showed the best performance, with discharge and charge voltages of 2.55 and 2.94 V, respectively, resulting in an overpotential gap of 0.39 V. This improvement is attributed to the fact that the introduction of NCNT in hydrogel facilitates charge transfer during the ORR/OER process. Fig. 5d shows the voltage-specific capacity relationship during the first discharge under a deep discharge test with a voltage limit of 1.5 V and a current density of 0.2 mA/cm2. The discharge specific capacity of the quasi-solid-state SABs with PANa-NCNT-2 reached as high as 9809 mAh/g, while that of the battery with PANa-NCNT-1 was 5812 mAh/g. The discharge specific capacity of the quasi-solid-state SABs with pure PANa hydrogel was 4368 mAh/g. Notably, the discharge specific capacity of PANa-NCNT-2, which incorporated a high amount of NCNT, was 2.25 times greater than that of the battery using pure PANa. This indicates that as the NCNT content in the hydrogel increases, the discharge specific capacity improves, even under deep discharge conditions. The discharge performance of the quasi-solid-state SABs was further assessed through LSV. As shown in Fig. 5e, compared to the battery assembled with pure PANa hydrogel, the battery containing PANa-NCNT exhibited a smaller discharge voltage difference at the same current density, indicating better energy efficiency. Additionally, the limiting current density increased with the addition of more NCNT in the hydrogel. Specifically, the PANa-NCNT-2 hydrogel, which contained a high level of NCNT, displayed the highest limiting current density of 13.40 mA/cm2. The actual discharge current density multiplied by the corresponding voltage value was used to obtain the battery power density curve [28,29]. This curve showed that the maximum power density of the quasi-solid-state SABs with pure PANa hydrogel was 3.43 mW/cm2, lower than that of the battery using PANa-NCNT. The maximum power density increased significantly with increasing NCNT content in the hydrogel. Notably, PANa-NCNT-2, which had a higher NCNT content, exhibited a maximum power density of 8.41 mW/cm2. These results suggest that the incorporation of NCNT into the hydrogel facilitates charge transfer during the reaction process, thereby enhancing the electrochemical performance of the quasi-solid-state SABs.
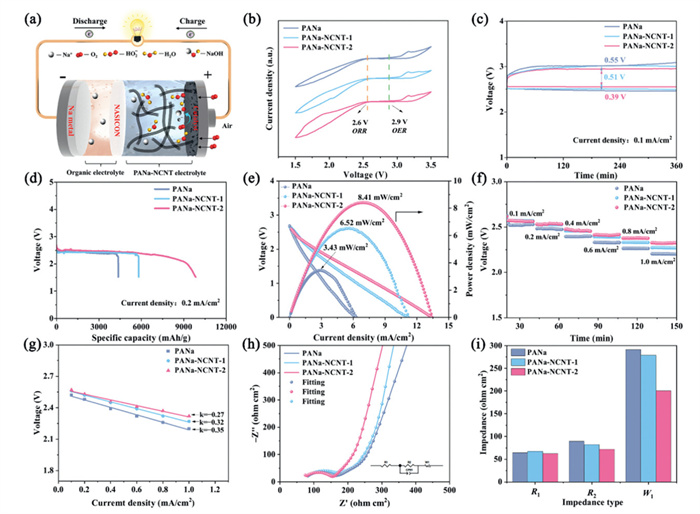
To further examine the discharge performance of quasi-solid-state SABs based on different hydrogels, the discharge behavior of the batteries was tested under various current densities. A series of discharge tests were performed at current densities of 0.1, 0.2, 0.4, 0.6, 0.8, and 1 mA/cm2, with each discharge/charge cycle lasting 20 min at the respective current density. As shown in Fig. 5f, the discharge plateaus of all batteries exhibited a regular decline with increasing current density. However, the discharge potential platforms of the hydrogels significantly increased with the incorporation of more NCNT in the hydrogels across the entire current density range. Even at 1.0 mA/cm2, PANa-NCNT-2, which contained a high amount of NCNT, exhibited a higher discharge potential plateau of 2.32 V, compared to PANa (2.20 V) and PANa-NCNT-1 (2.27 V). This indicates that quasi-solid-state SABs with PANa-NCNT-2 have better reaction kinetics. Fig. 5g shows the current density dependence of the discharge voltage for quasi-solid-state SABs based on different hydrogels. The discharge voltages of all batteries decreased approximately linearly with increasing current density, indicating that the electrochemical performance of the quasi-solid-state SABs is linked to the redox reaction kinetics [30]. Quasi-solid-state SABs based on the PANa-NCNT-2 hydrogel electrolyte, which had a high NCNT content, displayed the highest slope of −0.27, while the quasi-solid-state SABs with PANa electrolyte showed the lowest slope of −0.35. This further suggests that the incorporation of NCNT into the hydrogel facilitates charge transfer and sodium ion migration during the reaction process, thus enhancing reaction kinetics. EIS tests were performed on the quasi-solid-state SABs to analyze their electrochemical performance (Fig. 5h). After equivalent circuit analysis, it was clear that the electrochemical process involved bilayer and Faraday reactions. The corresponding total impedance could be modeled by three electrical components: Ohmic impedance (R1), Faraday impedance, and the capacitance of the bilayer (CPE). The CPE arises from inactive ions in the electrolyte, where no chemical reaction occurs, only a redistribution of charge. The Faraday impedance consists of charge-transfer impedance (R2) and Warburg impedance (W1), which is related to the migration of active ions in the electrolyte [31,32]. In this equivalent circuit, the intersection of the curve and the real axis represents the ohmic impedance (R1), the semicircular diameter in the high-frequency region corresponds to the charge transfer resistance (R2), and the straight-line inclination in the low-frequency range represents the substance transfer impedance (W1). The fitted impedance values for the quasi-solid-state SABs with different hydrogels are shown in Fig. 5i. The quasi-solid-state SABs with the PANa-NCNT-2 electrolyte had an R2 of 71.8 ohm cm2, which was lower than that of the battery with PANa-NCNT-1 (82.1 ohm cm2) and the battery with PANa (89.5 ohm cm2). Additionally, the W1 of PANa-NCNT-2 was smaller, indicating that the ORR in the quasi-solid-state SABs with PANa-NCNT-2 is easier to carry out.
To evaluate the cycle life of quasi-solid-state SABs in real applications, cyclic charge/discharge tests were conducted at a constant current density of 0.1 mA/cm2 with a cutoff voltage of 1.5 V. As shown in Fig. 6a, among the quasi-solid-state SABs, the battery using PANa gel as the anode electrolyte exhibited a relatively short cycle life, with stable charging and discharging only sustained for 151 cycles (159 h). However, the cycle life of the batteries was prolonged with an increase in the NCNT content in the hydrogel. Among them, the battery using PANa-NCNT-2 has the longest cycle life, which can stably charge and discharge for 536 cycles (572 h). This result indicates that the cycling performance of quasi-solid-state SABs can be significantly enhanced by modifying the homogeneous structure of the hydrogel. To further investigate the battery performance changes in the batteries during cycling, the charging and discharging voltage curves of different quasi-solid-state SABs at the same specific cycle number were compared. As shown in Figs. 6b-d, the overpotential gaps of all batteries increased with the number of cycles. However, the quasi-solid-state SABs with PANa-NCNT-2 gel exhibited a smaller variation in the overpotential gap. After 30 cycles, the overpotential gap remained almost unchanged, which clearly distinguished it from the overpotential gap variations observed in batteries using PANa and PANa-NCNT-1 gel. These results suggest that the incorporation of NCNT into the hydrogel plays a positive role in improving the cycle life and stability of quasi-solid-state SABs.
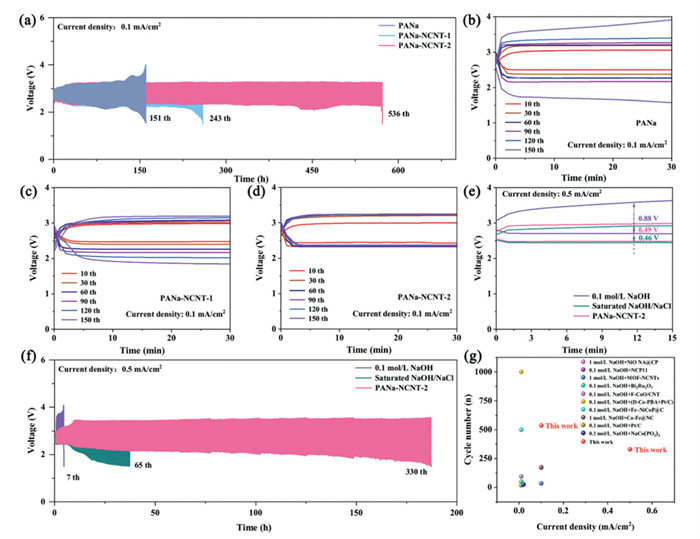
In addition, in order to explore the influence of electrolytes on the electrochemical properties of SAB, the batteries using different electrolytes were tested by cycling at a current density of 0.5 mA/cm2. Fig. 6e shows the first discharge-charge voltage curves. The results showed that the SAB with 0.1 mol/L NaOH solution exhibited the highest discharge plateau (~2.70 V), while those with saturated NaOH/NaCl solution and PANa-NCNT-2 hydrogel showed a lower one (~2.50 V). This suggests that the latter two electrolytes may undergo similar electrochemical reaction processes. Moreover, the SAB with PANa-NCNT-2 hydrogel had a higher charging voltage (~2.99 V) than the battery with saturated NaOH/NaCl solution, likely due to the electrostatic repulsion of
To gain an in-depth understanding of the electrochemical reaction mechanism of quasi-solid-state SABs using PANa-NCNT hydrogel electrolytes, CV analysis was performed on batteries employing 0.1 mol/L NaOH solution, saturated NaOH/NaCl solution, and PANa-NCNT-2 hydrogel (Fig. 7a). For the SAB using 0.1 mol/L NaOH solution, an ORR reaction current was observed at approximately 3.0 V, indicating that the ORR proceeds via the common 4e- reaction (Eq. 1), with a standard reaction potential of 3.11 V [43,44]. In contrast, the SABs using PANa-NCNT-2 hydrogel and saturated NaOH/NaCl solution exhibited similar ORR behavior, with the ORR reaction current appearing at around 2.6 V. This suggests that the batteries underwent the same ORR, proceeding through a 2e- reaction that generates NaOH and
|
|
(1) |
|
|
(2) |
|
|
(3) |
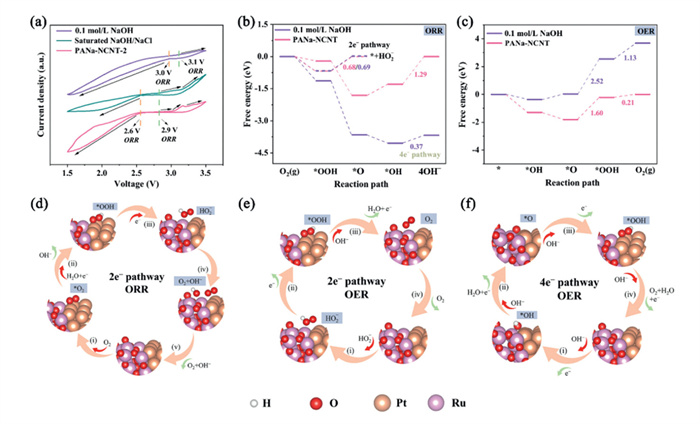
To further elucidate the intrinsic relationship between the electrolyte and ORR/OER mechanisms, the catalyst models (Fig. S7 in Supporting information) were constructed, and density functional theory (DFT) calculations were conducted. By simulating the adsorption energies of intermediate products, the free energy changes during the ORR or OER processes via 2e-/4e- reaction pathways in SABs using 0.1 mol/L NaOH solution and PANa-NCNT hydrogel were compared. As shown in Fig. 7b, during the ORR process, the rate-determining step (RDS) for the 4e- pathway is the formation of OH-, while for the 2e- pathway, it is the formation of
In this study, a PANa-NCNT hydrogel electrolyte composed of NCNT and PANa was prepared, relying on the physical entanglement of NCNT with PANa. The incorporation of NCNT led to the transformation of the PANa hydrogel network into a heterogeneous phase structure with an average pore size of approximately 0.05 µm, which is 16 times smaller than that of the pure PANa hydrogel. This heterogeneous structure effectively reduced the escape channels for water molecules, resulting in a decrease in the free water content to 88.5%. After seven days of static testing at room temperature, the water retention of PANa-NCNT-2 was 98.2%, with an ionic conductivity of 0.85 mS/cm, outperforming the pure PANa hydrogel electrolyte. Furthermore, the quasi-solid-state SABs assembled with the PANa-NCNT-2 hydrogel exhibited a low overpotential gap of 0.39 V, a high discharge specific capacity of 9809 mAh/g, and a prolonged cycle life of 536 cycles (572 h) at a current density of 0.1 mA/cm2. Even at a high current density of 0.5 mA/cm2, it maintained cycling ability for 330 cycles (187 h). DFT calculations demonstrated that in quasi-solid-state SABs using PANa-NCNT hydrogel, the ORR process followed a 2e- reaction pathway during discharge, while the OER process exhibited a mixed 2e-/4e- reaction mechanism during charging. These findings pave the way for future research in designing high-performance hydrogels and the application of hydrogel electrolytes in SABs.
The authors declare that they have no known competing financial interests or personal relationships that could have appeared to influence the work reported in this paper.
Bowen Xu: Writing – original draft, Visualization, Software, Methodology, Investigation, Data curation. Hongkun Zhang: Supervision, Investigation. Xuantian Feng: Methodology, Investigation, Formal analysis. Da Zhang: Software, Investigation, Data curation. Bin Yang: Validation, Methodology, Formal analysis. Feng Liang: Writing – review & editing, Supervision, Project administration, Funding acquisition.
The work was financially supported by the National Natural Science Foundation of China (Nos. 12205127, 12175089), the Applied Basic Research Programs of Yunnan Provincial Science and Technology Department (Nos. 202401AV070008, 202301AS070051, 202401AT070329, 202301BE070001-052, 202301AU070064), the "Xingdian Talent Support Plan" Programs of Yunnan Province (Nos. KKXY202252001, KKXX202452067).
Supplementary material associated with this article can be found, in the online version, at doi:
T. Zhang, K. Wang, H. Wang, et al., Prog. Mater. Sci. 151 (2025) 101426. doi: 10.1016/j.pmatsci.2025.101426
M. Li, M. Yuan, X. Zheng, et al., Chin. Chem. Lett. 35 (2024) 109265. doi: 10.1016/j.cclet.2023.109265
X. Wang, J. Li, C. Liu, et al., Adv. Funct. Mater. 34 (2024) 2312729. doi: 10.1002/adfm.202312729
F. Li, K. Ren, M. Hou, et al., ACS Energy Lett. 10 (2025) 195–204. doi: 10.1021/acsenergylett.4c03043
Z. Chen, K. Wang, Y. Fu, et al., Adv. Funct. Mater. 33 (2023) 2306223. doi: 10.1002/adfm.202306223
R. Cao, K. Chen, Y. Cui, et al., Chin. Chem. Lett. 34 (2023) 108711. doi: 10.1016/j.cclet.2023.108711
A. Ha, A. Anastro, N. Ortiz-Vitoriano, et al., J. Phys. Chem. Lett. 10 (2019) 7050–7055. doi: 10.1021/acs.jpclett.9b02947
J. Wang, Y. Ni, J. Liu, et al., ACS Cent. Sci. 6 (2020) 1955–1963. doi: 10.1021/acscentsci.0c00849
J. Lu, Y. Chen, Y. Lei, et al., Nano-Micro Lett. 17 (2025) 1–66. doi: 10.63313/ajet.9001
M. Yahia, I. Larramendi, N. Ortiz-Vitoriano, et al., Adv. Energy Mater. 14 (2024) 2401398. doi: 10.1002/aenm.202401398
B. Xu, D. Zhang, C. Peng, et al., Adv. Energy Mater. 13 (2023) 2302325. doi: 10.1002/aenm.202302325
K. Iputera, C. Tsai, J. Huang, et al., ACS Appl. Mater. Interfaces 16 (2024) 36289–36294. doi: 10.1021/acsami.4c04613
Z. Shang, H. Zhang, M. Qu, et al., Chem. Eng. J. 468 (2023) 143836. doi: 10.1016/j.cej.2023.143836
N. Shang, K. Wang, M. Wei, et al., Adv. Funct. Mater. 33 (2023) 2303719. doi: 10.1002/adfm.202303719
X. Fan, H. Wang, X. Liu, et al., Adv. Mater. 35 (2023) 2209290. doi: 10.1002/adma.202209290
J. Jiang, H. Jiang, Y. Xu, et al., Colloid. Surface. A 647 (2022) 128960.
F. Jones, B. Farrow, W. Bronswijk, et al., Langmuir 14 (1998) 6512–6517. doi: 10.1021/la971126l
T. Zhang, K. Kuang, L. Lu, et al., J. Energy Storage 100 (2024) 113629. doi: 10.1016/j.est.2024.113629
Y. Deng, J. Sun, X. Ni, et al., J. Polym. Res. 27 (2020) 157. doi: 10.1007/s10965-020-02143-z
C. Wang, K. B, Yang. Wang, Chin. Chem. Lett. 36 (2025) 110538. doi: 10.1016/j.cclet.2024.110538
Z. Pei, H. Tan, J. Gu, et al., Nat. Commun. 14 (2023) 818. doi: 10.1038/s41467-023-36532-x
J. He, C. Das, F. Yang, et al., Electrochim. Acta 411 (2022) 140038. doi: 10.1016/j.electacta.2022.140038
B. Menezes, F. Ferreira, B. Silva, et al., J. Mater. Sci. 53 (2018) 14311–14327. doi: 10.1007/s10853-018-2627-3
Y. Zhang, D. Wu, F. Huang, et al., Adv. Funct. Mater. 32 (2022) 2203204. doi: 10.1002/adfm.202203204
X. Liu, J. Wang, P. Lv, et al., Energy Storage Mater. 69 (2024) 103382.
Q. Sun, G. Zhu, L. Dai, et al., ACS Sustain. Chem. Eng. 11 (2023) 11625–11634. doi: 10.1021/acssuschemeng.3c02484
P. Mao, H. Arandiyan, S. Mofarah, et al., Energy Adv. 2 (2023) 465–502. doi: 10.1039/d2ya00340f
X. Yang, C. Peng, M. Hou, et al., Adv. Funct. Mater. 32 (2022) 2201258. doi: 10.1002/adfm.202201258
X. Yang, F. Su, M. Hou, et al., Dalton Trans. 50 (2021) 7041–7047. doi: 10.1039/d1dt00807b
Y. Kang, D. Zou, J. Zhang, et al., Electrochim. Acta 244 (2017) 222–229. doi: 10.3341/jkos.2017.58.2.222
C. Zhao, R. Guo, Y. Zhai, et al., ACS Appl. Mater. Interfaces 16 (2024) 63580–63588. doi: 10.1021/acsami.4c14141
Y. Niu, X. Teng, S. Gong, et al., Nano-Micro Lett. 13 (2021) 126.
W. Niu, B. Xu, F. Li, et al., Ceram. Int. 49 (2023) 21355–21362.
B. Senthilkumar, A. Irshad, P. Barpanda, ACS Appl. Mater. Interfaces 11 (2019) 33811–33818. doi: 10.1021/acsami.9b09090
Y. Wu, X. Qiu, F. Liang, et al., Appl. Catal. B Environ. 241 (2019) 407–414.
M. Kim, H. Ju, J. Kim, et al., Chem. Eng. J. 358 (2019) 11–19.
Y. Kang, J. Li, Electrochim. Acta 478 (2024) 143854.
Y. Kang, S. Wang, K. Hui, et al., Mater. Today Energy 20 (2021) 100572.
Y. Kang, S. Wang, S. Zhu, et al., Appl. Catal. B Environ. 285 (2021) 119786.
H. Gao, S. Zhu, Y. Kang, et al., ACS Appl. Energy Mater. 5 (2022) 1662–1671. doi: 10.1021/acsaem.1c03073
S. Sahgong, S. Senthilkumar, K. Kim, et al., Electrochem. Commun. 61 (2015) 53–56.
C. Murugesan, M. Musthafa, S. Lochab, et al., Inorg. Chem. 60 (2021) 11974–11983. doi: 10.1021/acs.inorgchem.1c01009
Z. Khan, M. Vagin, X. Crispin, et al., Adv. Sci. 7 (2020) 1902866.
J. Zhu, T. Qu, F. Su, et al., Dalton Trans. 49 (2020) 1811–1821. doi: 10.1039/c9dt04073k
K. Hayashi, K. Shima, F. Sugiyama, et al., J. Electrochem. Soc. 160 (2013) A1467–A1472. doi: 10.1149/2.067309jes
S. Hwang, W. Go, H. Yu, et al., J. Mater. Chem. A 5 (2017) 11592–11600.
F. Bidault, D. Brett, P. Middleton, et al., J. Power Sources 187 (2009) 39–48.
H. Chang, L. Zhao, S. Zhao, et al., J. Energy Chem. 93 (2024) 400–410.

Figure 2 (a, b) Cross-sectional cryo-SEM images of PANa. (c) The data statistics of the aperture of PANa. (d, e) Cross-sectional cryo-SEM images of PANa-NCNT. (f) The data statistics of the aperture of PANa-NCNT.

Figure 3 For PANa, NCNT, and PANa-NCNT: (a) XRD spectra, (b) FT-IR spectra, (c) Raman spectra. (d) XPS full spectra for PANa and PANa-NCNT. C 1s spectrum for (e) PANa and (f) PANa-NCNT.

Figure 4 (a) T2 Relaxation time distribution curves from LF-NMR of PANa and PANa-NCNT. (b) Normalized data of the peak areas corresponding to different water fractions. (c) TG curve for PANa and PANa-NCNT. (d) Ionic conductivity, (e) water retention and (f) ionic conductivity as a function of exposure time for PANa, PANa-NCNT-1, and PANa-NCNT-2.

Figure 5 (a) Schematic diagram of the device for the quasi-solid-state SABs. Quasi-solid-state SABs using PANa, PANa-NCNT-1, and PANa-NCNT-2. (b) CV curve at the sweep speed of 0.1 mV/s. (c) Discharge-charge curves. (d) Dull discharge performance. (e) Discharge polarization curve and corresponding power density plot. (f) Rate performance at different current densities. (g) Linear fitting plot of discharge voltage to current density. (h) EIS spectrum, and (i) impedance fitting value.

Figure 6 Quasi-solid-state SABs using PANa, PANa-NCNT-1 and PANa-NCNT-2: (a) Cycle performance, discharge-charge curves of (b) PANa, (c) PANa-NCNT-1, and (d) PANa-NCNT-2 at specific cycle times. Using 0.1 mol/L NaOH solution, saturated NaOH/NaCl solution, and PANa-NCNT-2 of SABs: (e) Discharge-charge curves at 0.5 mA/cm2 current density, and (f) cycling performance, and (g) comparison with the aqueous SABs cycling performance.

 扫一扫看文章

扫一扫关注我们
 DownLoad:

 下载:
下载:

 下载:
下载: