Figure 1.
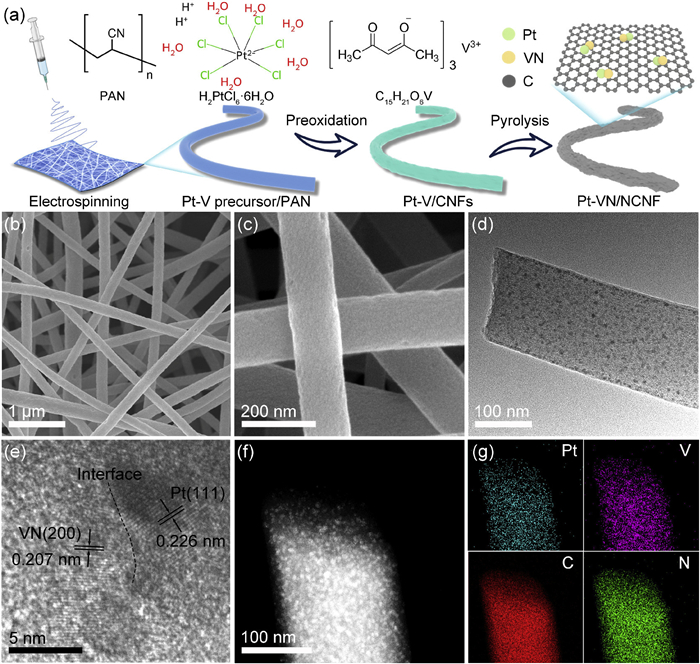
Structural characterizations. (a) Synthetic illustration, (b, c) SEM, (d) TEM, (e) HRTEM images, and (f, g) corresponding elemental mappings of Pt-VN/NCNF.

With the global push for energy transition, hydrogen has emerged as a promising clean energy carrier, demonstrating immense potential in cutting-edge energy conversion technologies like proton exchange membrane fuel cells (PEMFCs) [1–5]. Hydrogen oxidation reaction (HOR), a core reaction in PEMFCs, directly impacts fuel cell performance [6–8]. Therefore, high-performance HOR catalysts is crucial for advancing PEMFC technology. Traditional Pt-based catalysts have exhibited notable HOR activity due to their near-optimal hydrogen binding energy (HBE) [9]. However, their high-cost limits large-scale applications. Transition metal interstitial compounds (TMICs) with Pt-like properties, similar d-electron distributions, and effective intermediate binding enhance reaction rate and selectivity [10,11]. Combining TMICs with Pt reduces Pt loading while maintaining catalytic activity, effectively lowering costs. Among them, vanadium nitride (VN) has promising potential as a co-catalyst in the catalytic field due to its low cost and high catalytic efficiency [12,13]. VN stabilizes Pt catalytic active sites and modulates the d-band center (Ed) of Pt through electronic interactions, optimizing its electronic structure for enhanced activity and stability [14]. This further highlights the potential value of VN in turning into the electronic structure of Pt and improving its catalytic performance.
Furthermore, CO shows high selectivity for polynuclear vanadium nitride clusters (V4N5−) in Fischer-Tropsch synthesis, highlighting its potential for anti-CO poisoning [15]. In the current energy landscape of China, hydrogen primarily comes from fossil fuel-based hydrogen production and industrial by-product hydrogen, referred to as "gray hydrogen", which inevitably contains trace amounts of toxic substances such as CO. However, Pt exhibits high sensitivity to even ppm-level concentrations of CO. Blyholder et al. proposed that the adsorption mechanism of CO on the Pt surface primarily depends on the electronic donation from the 5σ orbitals of CO to the d orbitals (dz2) of Pt and electron back-donation from the d orbitals (dxz or dyz) of Pt to the 2π* antibonding orbitals of CO [16]. Since H2 possesses unoccupied σ molecular orbitals at the hybridized Fermi level, whereas the 2π molecular orbitals of CO are at higher energy levels, CO adsorbs more readily on Pt than H2, severely hindering the HOR process [17,18]. Therefore, enhancing CO tolerance is thus vital for directly utilizing industrial hydrogen and advancing PEMFC commercialization.
Based on the aforementioned principles, we have developed a Pt-VN heterojunction supported on nitrogen-doped carbon nanofibers (Pt-VN/NCNF) catalyst, which exhibits outstanding CO-tolerant HOR performance under acidic conditions. The synergistic effect between Pt and VN optimizes the electronic structure, with electron transfer from Pt to VN causing a downward shift in the Ed of Pt, weakening H adsorption. Also, the electron-deficient Pt suppresses the electronic back-donation to CO, while reducing the overlap of the d-band of Pt with the 1π and 5σ bonding orbitals of CO, curbing CO adsorption. As a result, the Pt-VN/NCNF catalyst exhibits a lower HOR half-wave potential (13 mV) and 41 times higher mass activity than Pt/C. Pt-VN/NCNF also demonstrates outstanding CO tolerance, with only a 3.3% decrease in limiting current at H2/1000 ppm CO. When used as PEMFCs anode, the PPD of Pt-VN/NCNF reaches 1.35 W/cm2. A deeper understanding of the structure-performance relationship and mechanisms of VN-regulated Pt catalysts is key to developing high-efficient CO-tolerant HOR catalysts.
Pt-VN/NCNF was prepared via electrospinning followed by heat treatment (details can be found in Supporting information) (Fig. 1a). Figs. 1b and c depict a 3D carbon fiber network (~150 nm in diameter) without visible surface particles. Multiple uniformly distributed nanoparticles with an average particle size of about 4.20 nm were observed anchored on fibres by transmission electron microscopy (TEM) (Fig. 1d and Fig. S1 in Supporting information). High-resolution transmission electron microscopy (HRTEM) (Fig. 1e) reveals closely grown particles with distinct lattice orientations, with measured spacings of 0.226 nm and 0.207 nm (Fig. S2 in Supporting information), corresponding to compressed Pt (111) (standard: 0.227 nm) and VN (200), respectively. From the elemental mapping in Figs. 1f and g, Pt and V exhibit a distinct aggregation, while C and N are more evenly distributed. The content of Pt and V was measured to be 1.03 wt and 6.75 wt by inductively coupled plasma optical emission spectroscopy (ICP-OES).
Fig. 2a presents the XRD patterns of the different samples. For Pt-VN/NCNF, peaks at 40.6°, 47.4°, and 68.7° are assigned to the (111), (200), and (220) planes of Pt with face-centered cubic (fcc) structure, respectively. These peaks shift to higher angles compared to Pt/NCNF, indicating lattice compression of Pt due to V incorporation. This compressive strain likely induces a downward shift of the Ed, weakening intermediate adsorption and enhancing HOR performance and CO resistance (vide infra). Pt-VN/NCNF also exhibits peaks at 37.8°, 43.8°, 63.6°, and 76.4° for the (111), (200), (220), and (311) planes of VN (fcc).
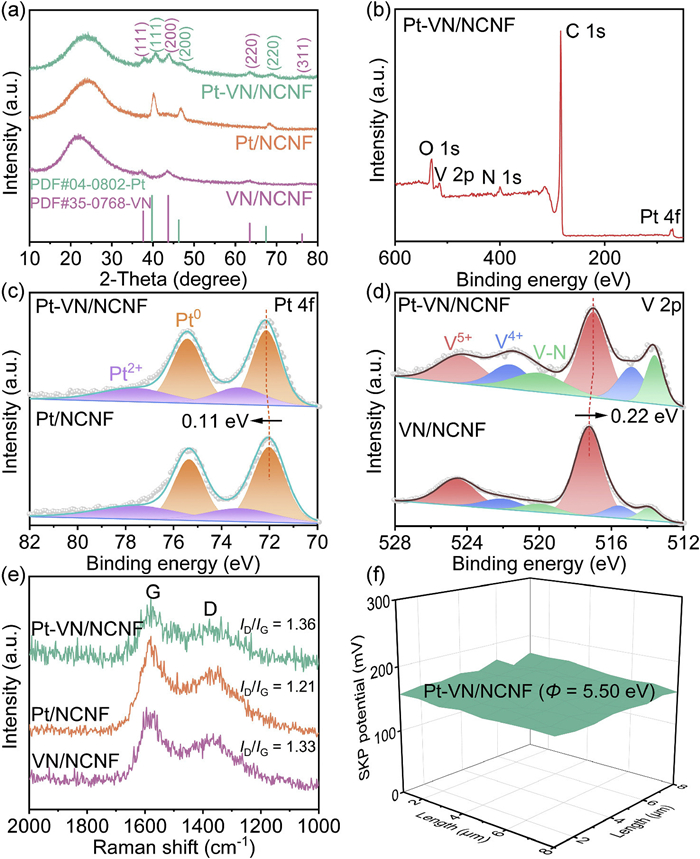
To further analysis the strong electronic interactions between Pt and V, X-ray photoelectron spectroscopy (XPS) analysis was conducted. The wide-scan XPS spectra of Pt-VN/NCNF reveal the presence of Pt, V, C, N, O (Fig. 2b). As evidenced in Fig. 2c, the Pt 4f XPS of Pt/NCNF shows two pairs of spin-orbit peaks, Pt 4f5/2 and Pt 4f7/2, primarily embodied in Pt0 (75.3 eV, 72.0 eV) with a small amount of Pt2+ (77.6 eV, 73.3 eV) attached [19]. Interestingly, in Pt-VN/NCNF, V doping induces a 0.11 eV shift toward higher binding energies, implying a reduced electron density around Pt. Conversely, the V 2p peak in Pt-VN/NCNF shifts negatively by 0.22 eV towards the core energy level compared to pure V sample (VN/NCNF), indicating electron accumulation around V in Pt-VN/NCNF (Fig. 2d) [20]. This phenomenon confirms the existence of significant electronic interactions between Pt and V. The introduction of V promotes the adsorption and dissociation of intermediates on Pt, which in turn improves the intrinsic catalytic activity of Pt-VN/NCNF by lowering the energy barrier of HOR.
The Raman spectra (Fig. 2e) showed D and G bands at 1360 cm−1 and 1585 cm−1, respectively [21]. The D band indicates structural defects, while the G band reflects the graphite structure. Pt-VN/NCNF exhibits a higher ID/IG ratio (1.36) than Pt/NCNF (1.21), like VN/NCNF (1.33), suggesting that V introduction increases defects, enhancing nanoparticle anchoring and active site exposure. Additionally, Pt-VN/NCNF exhibits the lowest work function, indicating a superior electron-donating ability that enhances hydrogen dissociation and oxidation (Fig. 2f and Fig. S3 in Supporting information).
The HOR performance of each sample was tested in H2-saturated 0.1 mol/L HClO4 solution. The HBE reflects the interaction strength between H* and the catalyst surface, thereby indirectly inferring the HOR performance of the catalyst [22,23]. Normally, the position of the hydrogen underpotential deposition (Hupd) peak corresponds to the magnitude of the HBE [24]. Fig. S4 (Supporting information) shows that the Hupd peak of Pt-VN/NCNF occurs at 0.05 V, indicating weak H binding and superior HOR performance. Fig. 3a and Fig. S5 (Supporting information) present that Pt-VN/NCNF outperforms most catalysts with a half-wave potential of 13 mV, lower than Pt/C (15 mV), and exceeds most of the HOR catalysts reported to date (Table S1 in Supporting information). Moreover, in the diffusion-limited region, the limiting current density (IL) of Pt-VN/NCNF is higher than that of commercial Pt/C, manifesting its strong competitiveness. In contrast, the half-wave potential of Pt/NCNF is as high as 70 mV (Fig. 3a and Fig. S5), and VN/NCNF is inert, highlighting the significant role of V in enhancing H2 oxidation on Pt in Pt-VN/NCNF. Subsequently, we analyzed the HOR polarization curves of the Pt-VN/NCNF catalyst at different rotation speeds and calculated the slope using the Koutecky-Levich equation, obtaining a value of 4.55, which is close to the theoretical two-electron HOR value (Fig. S6 in Supporting information), further confirming the excellent two-electron selectivity of the Pt-VN/NCNF catalyst.
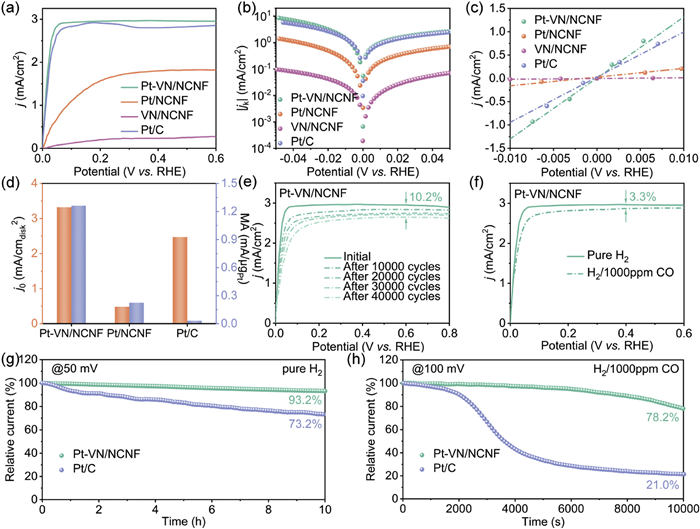
We also calculated the kinetic current density (jk) to assess catalyst efficiency. As illustrated in Fig. 3b, Pt-VN/NCNF and Pt/C exhibit nearly identical and significantly higher jk values than pure metal catalysts in the −0.05~0.05 V range. The electrical conductivity of VN/NCNF is 3.88 S/cm. Compared to the pure Pt sample (Pt/NCNF) with a conductivity of 4.12 S/cm, the presence of VN enhances the conductivity of Pt-VN/NCNF to 4.20 S/cm. This enhancement indicates that VN improves the overall conductivity of catalysts, accelerates electron transport, and optimizes HOR kinetics. The exchange current density (j0) of the catalysts was obtained by linear fitting in the micro-polarization region (−10–10 mV), and the j0 of Pt-VN/NCNF was 3.32 mA/cm2, 6.9 times higher than Pt/NCNF and 1.3 times higher than Pt/C (Figs. 3c and d). Meanwhile, we also normalized the Pt mass to evaluate the mass activity of each catalyst. As expected, Pt in Pt-VN/NCNF has the largest utilization rate (1.26 mA/µgPt), significantly outperforming Pt/NCNF and Pt/C (Fig. 3d), highlighting its superior HOR activity under acidic conditions.
The stability of Pt-VN/NCNF was evaluated through accelerated durability test (ADT) and chronoamperometry tests. As depicted in Fig. 3e, after completing up to 40,000 CV scans, the IL of Pt-VN/NCNF decreased by only 10.2%, while Pt/C decreased by 11.6% after 10, 000 CV scans (Fig. S7 in Supporting information). Furthermore, Pt-VN/NCNF maintained 93.2% of its initial activity after 10 h chronoamperometry test at 50 mV, compared to 73.2% of Pt/C (Fig. 3g). These results highlight the superior durability and stability of Pt-VN/NCNF over Pt/C.
In industrial settings, CO inevitably mixes with H2. Since CO adsorbs more strongly on Pt-based catalysts (adsorption heat: 134 kJ/mol) than H2 (87.9 kJ/mol), CO tolerance becomes crucial for commercialization. As anticipated, compared with commercial Pt/C, Pt-VN/NCNF exhibited higher tolerance benefiting from the electronic modulation of Pt by VN. As illustrated in Fig. 3f, when H2 was replaced with a H2/1000 ppm CO mixture, the IL of Pt-VN/NCNF decreases slightly, with only a 3.3% performance loss at 0.4 V, outperforming Pt/C (16.1%) and Pt/NCNF (74.6%) under the same conditions (Fig. S8 in Supporting information). Also, its CO tolerance exceeds most reported catalysts (Table S2 in Supporting information).
Meanwhile, optimizing VN content is critical for promoting HOR activity and CO tolerance, as an appropriate VN amount (0.1 mmol) effectively regulates the Pt electronic structure and enhances CO resistance, while excessive VN (0.3 and 0.4 mmol) reduces active sites and weakens catalytic performance (Figs. S9 and S10 in Supporting information). This result can be explained by referring to the CO stripping curves, as the CO stripping peaks can reflect the binding strength of CO to the catalyst (Fig. S11 in Supporting information) [25]. The potentiostatic durability test at 100 mV in an H2/1000 ppm CO mixture revealed that Pt-VN/NCNF retained 78.2% of its current after 10,000 s, while Pt/C only retained 21.0% (Fig. 3h). This confirms the excellent performance exhibited by Pt-VN/NCNF in the H2 reaction environment containing CO, positioning it as an effective catalyst for HOR with CO impurities.
Considering its exceptional HOR activity and remarkable anti-CO poisoning capacity, we opted to employ Pt-VN/NCNF as the anode catalyst (0.06 mgPt/cm2) and 60 wt Pt/C as the cathode catalyst (0.4 mgPt/cm2) to construct a membrane electrode assembly (MEA), aiming to thoroughly explore its underlying application potential. In the H2–O2 environment, the Pt-VN/NCNF cell achieved a peak power density (PPD) of 1.35 W/cm2 at a current density of 4.00 A/cm2, slightly lower than the 1.48 W/cm2 achieved by the commercial Pt/C cell at 4.60 A/cm2 (Fig. 4a). This is primarily attributed to the lower conductivity of Pt-VN/NCNF compared to Pt/C (4.20 S/cm vs. 4.31 S/cm), along with its smaller specific surface area and pore volume (Fig. S12 and Table S3 in Supporting information), resulting in limited electron transport and reduced diffusion efficiency of the reactive gases. Moreover, the Pt-VN/NCNF cell also has excellent long-term durability. As shown in Fig. 4b, when operating at a constant current density of 500 mA/cm2 for 30,000 s, the voltage only dropped by 1.3%.
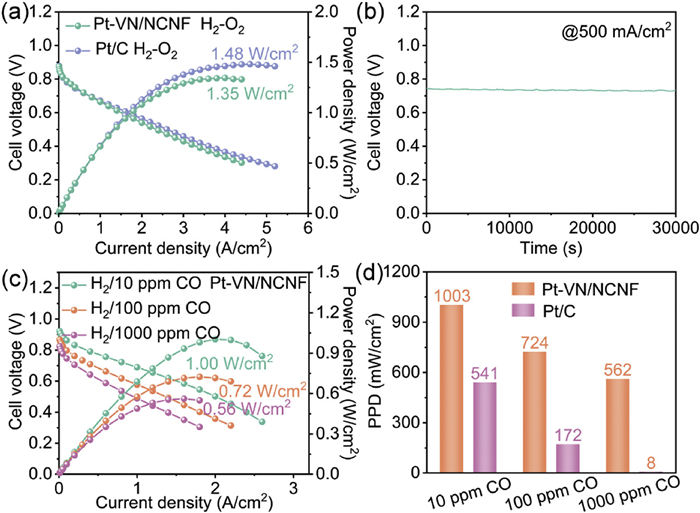
In H2–air conditions, the Pt-VN/NCNF cell achieved a PPD of 0.66 W/cm2 at 50 kPa, increasing to 0.83 W/cm2 at 100 kPa and 1.07 W/cm2 at 200 kPa (Fig. S13 in Supporting information). The CO tolerance was tested with H2/CO mixture (10–1000 ppm). The Pt-VN/NCNF cell maintained PPDs of 1.00 and 0.72 W/cm2 with 10 ppm and 100 ppm CO, respectively, and retained 0.56 W/cm2 even at 1000 ppm CO (Figs. 4c and d). In comparison, the PPD of the Pt/C cell showed a sharp decline as the CO concentration increased and completely lost performance at 1000 ppm CO (Fig. S14 in Supporting information and Fig. 4d). This fully reveals that the role of VN in suppressing CO poisoning, showcasing the potential of Pt-VN/NCNF for practical applications.
To explore the intrinsic mechanism behind the superior HOR performance and CO tolerance of Pt-VN/NCNF, we constructed models and performed DFT calculations (Fig. S15 in Supporting information). The slice map of the differential charge density of Pt-VN/NCNF in Fig. S16 (Supporting information) reveals that Pt is electron-deficient, while V gains electrons. In heterogeneous catalysis, the Ed reflects the electronic interactions between the catalyst and reactants [26,27]. Compared with Pt/NCNF, the Ed of Pt in Pt-VN/NCNF shifts downward after the introduction of V atoms (Fig. 5a), reducing the adsorption energy of H*. Additionally, the electron-deficient Pt diminishes the electronic feedback to CO, weakening CO adsorption on Pt. As indicated in Fig. S17 (Supporting information), the lower work function of Pt-VN/NCNF (4.13 eV) than Pt/NCNF enhances electron transfer and facilitates H2 adsorption and activation, effectively promoting HOR process.
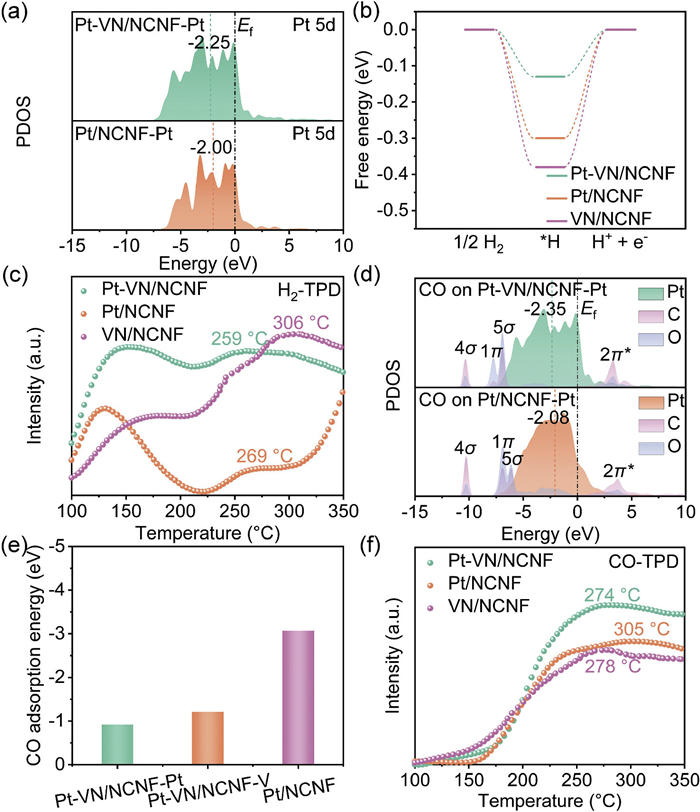
We calculated the Gibbs free energy of H* adsorption (ΔGH*) to evaluate the adsorption strength of H*. Given the moderate HBE, Pt is usually used as an active site for HOR. As can be seen from Fig. 5b and Fig. S18 (Supporting information), Pt-VN/NCNF has the smallest ΔGH* of −0.13 eV, close to the theoretical zero value [28], reducing the energy barriers for H+ and e− generation. As a result, the Pt-VN/NCNF catalyst facilitates the HOR more efficiently, reducing the activation energy and increasing the reaction rate. In contrast, Pt/NCNF (−0.30 eV) and VN/NCNF (−0.38 eV) have a larger ΔGH* (Fig. 5b and Fig. S18), and excess adsorption energy hinders H* desorption, leading to poorer HOR activity. The H2-TPD plot in Fig. 5c shows that the desorption temperature of H2 on Pt-VN/NCNF is lower than on Pt/NCNF and VN/NCNF, indicating that V introduction weakens hydrogen atom adsorption on Pt-VN/NCNF.
Differential charge density analysis shows that in Pt-VN/NCNF, CO transfers minimal charge to Pt, weakening CO adsorption, whereas in Pt/NCNF, stronger charge transfer enhances Pt-CO bonding and adsorption (Fig. S19 in Supporting information). Further analysis reveals that after CO adsorption, the Ed of Pt in Pt-VN/NCNF shifts downward, and compared to Pt/NCNF, the Ed is further away from the 2π anti-bonding orbitals of CO (Fig. 5d). Moreover, the overlap between the Pt d-band and CO bonding orbitals (1π and 5σ) in the −5~−7.5 eV range is smaller in Pt-VN/NCNF than in Pt/NCNF (Fig. 5d) [29,30]. This indicates that VN profoundly influencing the electronic interactions between Pt and CO, weakening CO adsorption. Computational results in Fig. 5e and Fig. S20 (Supporting information) show that the CO adsorption energy on Pt in Pt-VN/NCNF is −0.92 eV, lower than on V sites (−1.21 eV) and pure Pt (−3.07 eV). Implying that CO is more likely to adsorb at the V sites and is less likely to occupy a greater number of active sites on the Pt-VN/NCNF surface, consistent with the CO-TPD results (Fig. 5f). Compared to Pt/NCNF and VN/NCNF, CO desorption from Pt-VN/NCNF occurs at a lower temperature, indicating a stronger resistance of Pt-VN/NCNF to CO adsorption. Besides, in-situ Diffuse Reflectance Infrared Fourier Transform Spectroscopy (DRIFTS) analysis shows a weaker CO adsorption peak (2104 cm−1) on Pt-VN/NCNF than on Pt/NCNF (Fig. S21 in Supporting information), indicating that VN modulation reduces CO binding strength by lowering the electron density of Pt and hindering back-donation to the 2π* anti-bonding orbitals of CO.
In summary, we designed a Pt-VN/NCNF catalyst featuring a Pt-VN heterojunction-loaded nitrogen-doped carbon nanofibers. VN modulates the Pt d-band structure, balancing H* adsorption while reducing electronic feedback to CO 2π* anti-bonding orbitals. The rearranged electronic structure of Pt also weakens the overlap with the CO 1π and 5σ bonding orbitals, enhancing CO resistance. Pt-VN/NCNF maintains excellent HOR performance even with 1000 ppm CO, achieving a peak power density of 1.35 W/cm2 and stability for over 30,000 s in H2–O2 conditions. The H2/CO environment (10–1000 ppm) still exhibits fuel cell performance that far exceeds that of commercial Pt/C. This work presents an effective new paradigm for modulating the electronic structure of Pt to maintain high-performance CO-tolerant, high-performance catalysts for efficient fuel cells.
The authors declare that they have no known competing financial interests or personal relationships that could have appeared to influence the work reported in this paper.
Xu Zhang: Writing – original draft, Methodology, Investigation, Formal analysis, Data curation. Bin Cai: Methodology, Formal analysis, Data curation. Tianyu Han: Investigation, Formal analysis. Ziyun Li: Methodology, Investigation. Ying Xie: Writing – review & editing, Writing – original draft, Supervision, Project administration, Funding acquisition. Lei Wang: Writing – review & editing, Writing – original draft, Project administration, Funding acquisition, Conceptualization.
This work was supported by the National Natural Science Foundation of China (Nos. 22179034, 22279030), the Natural Science Foundation of Heilongjiang Province (No. ZD2023B002).
Supplementary material associated with this article can be
found, in the online version, at doi:
S. Yin, L. Chen, J. Yang, et al., Nat. Commun. 15 (2024) 7489. doi: 10.1038/s41467-024-51858-w
B. Cai, D. Shen, Y. Xie, et al., J. Am. Chem. Soc. 146 (2024) 33193–33203. doi: 10.1021/jacs.4c12720
F. Ning, Y. Shen, C. Bai, et al., Chin. Chem. Lett. 30 (2019) 1282–1288. doi: 10.1016/j.cclet.2019.02.032
K. Kodama, T. Nagai, A. Kuwaki, R. Jinnouchi, Y. Morimoto, Nat. Nanotechnol. 16 (2021) 140–147. doi: 10.1038/s41565-020-00824-w
M. Tong, F. Sun, G. Xing, et al., Angew. Chem. Int. Ed. 62 (2023) e202314933. doi: 10.1002/anie.202314933
Y. Zhao, X. Wang, Z. Li, et al., Chin. Chem. Lett. 33 (2022) 1065–1069. doi: 10.1016/j.cclet.2021.05.038
B. Cai, X. Chen, L. Wang, H. Fu, ACS Catal. 14 (2024) 13602–13629. doi: 10.1021/acscatal.4c03588
L. Cao, F.A. Soto, D. Li, et al., Nat. Commun. 15 (2024) 7245. doi: 10.1038/s41467-024-51480-w
J. Wu, X. Gao, G. Liu, et al., J. Am. Chem. Soc. 146 (2024) 20323–20332. doi: 10.1021/jacs.4c05844
R. Zeng, H. Li, Z. Shi, et al., Nat. Mater. 23 (2024) 1695–1703. doi: 10.1038/s41563-024-01998-7
Z. Zhang, L. Yang, J. Liu, et al., Chin. Chem. Lett. 36 (2025) 110013. doi: 10.1016/j.cclet.2024.110013
Z. Liang, D. Shen, Y. Wei, et al., Adv. Mater. 36 (2024) 2408634. doi: 10.1002/adma.202408634
R. Balaji, T.T. Nguyen, M. Austeria P, et al., Appl. Catal. B 335 (2023) 122895. doi: 10.1016/j.apcatb.2023.122895
J. Yin, L. Wang, C. Tian, et al., Chem. Eur. J. 19 (2013) 13979–13986. doi: 10.1002/chem.201300933
S. Wang, J. Chen, Y. Liu, et al., Phys. Chem. Chem. Phys. 24 (2022) 29765–29771. doi: 10.1039/d2cp04304a
G. Blyholder, J. Phys. Chem. 68 (1964) 2772–2777. doi: 10.1021/j100792a006
S.S. Sung, R. Hoffmann, J. Am. Chem. Soc. 107 (1985) 578–584. doi: 10.1021/ja00289a009
C. Molochas, P. Tsiakaras, Catalysts 11 (2021) 1127. doi: 10.3390/catal11091127
L. Chen, X. Liang, X. Li, et al., Nano Energy 73 (2020) 104784. doi: 10.1016/j.nanoen.2020.104784
D. Deng, H. Zhang, J. Wu, et al., Energy Chem. 89 (2024) 239–249. doi: 10.1016/j.jechem.2023.10.024
Y. Chen, Y. Jiao, L. Sun, et al., Chin. Chem. Lett. 36 (2025) 110789. doi: 10.1016/j.cclet.2024.110789
Z. Li, L. An, M. Song, et al., Chin. Chem. Lett. 34 (2023) 107622. doi: 10.1016/j.cclet.2022.06.045
G. Gao, G. Zhu, X. Chen, Z. Sun, A. Cabot, ACS Nano 17 (2023) 20804–20824. doi: 10.1021/acsnano.3c05810
P. Li, Y. Jiang, Y. Hu, et al., Nat. Catal. 5 (2022) 900–911. doi: 10.1038/s41929-022-00846-8
H. Shi, Y. Yang, P. Meng, et al., J. Am. Chem. Soc. 146 (2024) 16619–16629. doi: 10.1021/jacs.4c03622
G. Gao, G. Zhao, G. Zhu, et al., Chin. Chem. Lett. 36 (2025) 109557. doi: 10.1016/j.cclet.2024.109557
Y. Dong, Z. Zhang, W. Yan, et al., Angew. Chem. Int. Ed. 62 (2023) e202311722. doi: 10.1002/anie.202311722
X. Wang, X. Li, D. Kong, et al., Nano Energy 104 (2022) 107877. doi: 10.1016/j.nanoen.2022.107877
D. Long, Y. Liu, X. Ping, et al., Nat. Commun. 15 (2024) 8105. doi: 10.1038/s41467-024-51562-9
W. Chen, J. Cao, W. Fu, et al., Angew. Chem. Int. Ed. 61 (2022) e202200190. doi: 10.1002/anie.202200190

Figure 1 Structural characterizations. (a) Synthetic illustration, (b, c) SEM, (d) TEM, (e) HRTEM images, and (f, g) corresponding elemental mappings of Pt-VN/NCNF.

Figure 2 Electronic structures. (a) XRD patterns of Pt-VN/NCNF, Pt/NCNF and VN/NCNF. (b) Wide-scan XPS spectra of Pt-VN/NCNF. (c) Pt 4f and (d) V 2p XPS spectra. (e) Raman spectra of Pt-VN/NCNF, Pt/NCNF and VN/NCNF. (f) Work function drawing of Pt-VN/NCNF.

Figure 3 Electrocatalytic HOR activity. (a) HOR polarization curves in H2-saturated 0.1 mol/L HClO4 of Pt-VN/NCNF, Pt/NCNF, VN/NCNF and Pt/C. (b) Tafel plots. (c) Linear current potential region around the equilibrium potential. (d) Exchange current density and normalized mass activity for all catalysts. (e) HOR polarization curves before and after ADT of Pt-VN/NCNF. (f) HOR polarization curves in pure H2 and H2/1000 ppm CO-saturated 0.1 mol/L HClO4 of Pt-VN/NCNF. Chronoamperometry responses of Pt-VN/NCNF and Pt/C in (g) pure H2 and (h) H2/1000 ppm CO-saturated 0.1 mol/L HClO4.

Figure 4 PEMFCs performances. (a) H2–O2 PEMFC polarization and power density of Pt-VN/NCNF and Pt/C in the anode. (b) Pt-VN/NCNF-based H2–O2 PEMFC stability tests at 500 mA/cm2. (c) Polarization and power density curves under H2/(10, 100, 1000) ppm CO–O2 atmosphere of PEMFC with Pt-VN/NCNF in the anode. (d) Maximum peak power density value under H2/(10, 100, 1000) ppm CO–O2 atmosphere. All the tests are conducted at 80 ℃ with 100% RH under 100 kPa backpressures.

Figure 5 Theoretical studies on the mechanisms of HOR and anti-CO poisoning. (a) The PDOS diagram for the Pt 5d orbital of Pt-VN/NCNF and Pt/NCNF. (b) ΔGH* on Pt-VN/NCNF, Pt/NCNF and VN/NCNF. (c) H2 and (f) CO-TPD plots of Pt-VN/NCNF, Pt/NCNF and VN/NCNF. (d) The PDOS diagram of Pt and CO during CO adsorption on Pt-VN/NCNF and Pt/NCNF. (e) CO adsorption energy on Pt-VN/NCNF and Pt/NCNF.

 扫一扫看文章

扫一扫关注我们
 DownLoad:
 下载:
下载:
 下载:
下载: