College of Science, Minzu University of China, Beijing 100081, China
b.
Translational Medicine Center, Beijing Chest Hospital, Capital Medical University & Beijing Tuberculosis and Thoracic Tumor Research Institute, Beijing 101149, China
* Corresponding author. E-mail address: chuhongqian@bjxkyy.cn (H. Chu). 1 These authors contribute to this article equally.
Received Date:
23 July 2025 Accepted Date:
17 September 2025 Revised Date:
15 September 2025 Available Online:
15 May 2026
Abstract:
Lactate (LA) is now recognized as a critical carbon source for tumor metabolism, making its transport blockade a promising anticancer therapeutic strategy. In this study, we incorporated α-cyano-4-hydroxycinnamate (CHC) into hollow-structured CuS@PCN nanoparticles to inhibit LA influx by suppressing the expression of the monocarboxylate transporter 1 (MCT1) in tumor cells. This intervention shifted tumor cell metabolism from LA-fueled oxidative phosphorylation towards anaerobic glycolysis, consequently elevating intratumoral oxygen (O2) levels. The photosensitizer-based metal-organic framework (PCN) component was then able to efficiently convert this elevated O2 into abundant reactive oxygen species (ROS), thereby enhancing photodynamic therapy (PDT) efficacy. Notably, the hollow mesoporous CuS nanoparticle core functioned dually as a high-capacity CHC carrier and a photothermal agent that enables CHC release under near-infrared (NIR) irradiation. Further surface conjugation with folic acid-polyethylene glycol (FA-PEG) imparted tumor-targeting specificity via folate receptor recognition and prolonged systemic circulation. Both in vitro and in vivo evaluations demonstrated the excellent biocompatibility and significantly improved PDT performance of the synthesized CHC-CuS@PCN-FA (CHC-CP-FA) nanoplatform. These findings underscore the considerable potential of CHC-CP-FA for future cancer treatment applications.
The Warburg effect, also termed aerobic glycolysis, describes the phenomenon in tumor cells where excessive lactate (LA) production occurs despite sufficient oxygen availability [1,2]. While LA was long regarded merely as a metabolic waste product requiring elimination, recent research demonstrates its critical role in maintaining tumor microenvironment (TME) stability, promoting metastasis, and stimulating angiogenesis [3–6]. This functional significance has spurred significant interest in targeting LA metabolism for nanomedicine-based cancer therapy [7–9]. Many promising targets have been developed to modulate the LA metabolism in tumors [10–12]. Among them, monocarboxylate transporters (MCTs), particularly MCT1 and MCT4, are regarded as important guards of LA flux between cells and TME [13–16]. MCT1 primarily facilitates the uptake of extracellular LA under favorable concentration gradients, whereas MCT4 functions as an efflux transporter expelling LA from tumor cells. Although inhibiting either MCT1 or MCT4 disrupts LA-dependent metabolic symbiosis, MCT1 represents a more accessible pharmacological target due to the perivascular location of MCT1-expressing cancer cells. Various MCT1-inhibitory strategies, including pharmacological inhibitors or genetic regulation, have been reported to block the LA influx of tumor cells [17–21]. The results indicated that interfering with LA metabolism through MCT1 inhibition is a promising strategy for cancer therapy.
Notably, pharmacological inhibition of MCT1 disrupts cancer metabolism by shifting tumor cells from lactate-fueled oxidative phosphorylation toward glycolytic dependency. This metabolic reprogramming substantially attenuates cellular oxygen consumption, resulting in elevated intratumoral oxygen tension. Such oxygen enrichment creates a strategic therapeutic opportunity to potentiate oxygen-dependent modalities [22,23], including photodynamic therapy (PDT). PDT is an attractive tumor therapeutic modality because of its precision and potent cytotoxic effect, and low risk of therapeutic resistance compared to the conventional cancer treatments [24–27]. Nevertheless, its efficacy is critically limited by the hypoxic microenvironment characteristic of solid tumors and the progressive oxygen depletion that occurs during PDT itself [28–34]. Consequently, the hypoxia-alleviating effects of MCT1 inhibition offer a compelling mechanistic rationale for combinatorial treatment. By mitigating the oxygen constraints that undermine PDT, the integration of MCT1 inhibitors with PDT presents a promising strategy to achieve superior tumor control.
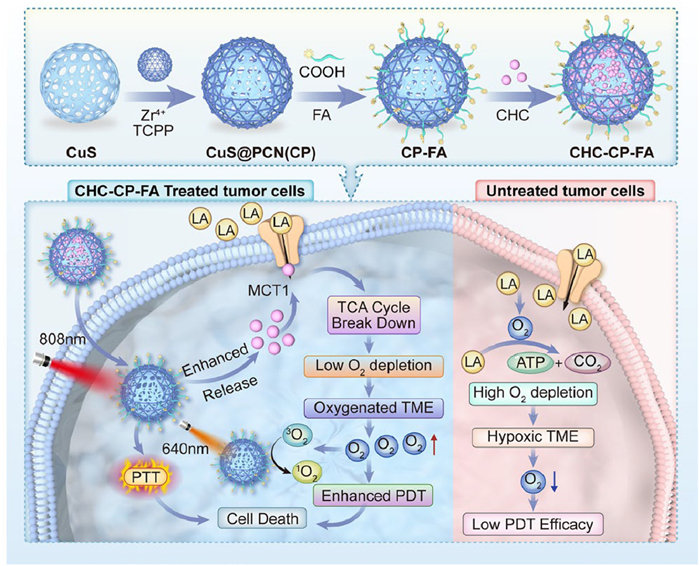
Metal-organic frameworks (MOFs) have shown great potential as nanophotosensitizers (nanoPS) for PDT [35–38]. Herein, a new combination strategy of PDT with MCT1-inhibitory treatment has been designed (Scheme 1), in which photosensitizer-based MOFs (PCN) were chosen as nanoPS for PDT, while the intracellular influx of LA was blocked by an MCT1 inhibitor of α-cyano-4-hydroxycinnamate (CHC). Especially, hollow mesoporous CuS nanoparticle (NP) was introduced into the nanosystem, which not only performed as a high CHC loading nanocarrier for achieving sustained drug release, but also demonstrated a great photothermal effect to promote the release of CHC. Folic acid-polyethylene glycol (FA-PEG) molecules were further attached through coordination interactions to endow the nanoplatform with a tumor-targeting capability. The final construct CHC-CuS@PCN-FA, labeled as CHC-CP-FA, showed a uniform size and well-defined nanostructure. Furthermore, an improved treatment was achieved both in vitro and in vivo via the combination of PDT with MCT1-inhibitory therapy. These results demonstrate that CHC-CP-FA is a highly promising anticancer nanomedicine for future clinical bioapplications.
Scheme 1
Scheme 1.
Schematic illustration of the synthesis of CHC-CP-FA NPs and the use of CHC-CP-FA NPs for cancer therapy. "CHC-CP-FA-treated tumor cells" referred to the tumor cells treated with CHC-CP-FA nanoparticles; "Untreated tumor cells" referred to the tumor cells without any nanoparticle treatment.
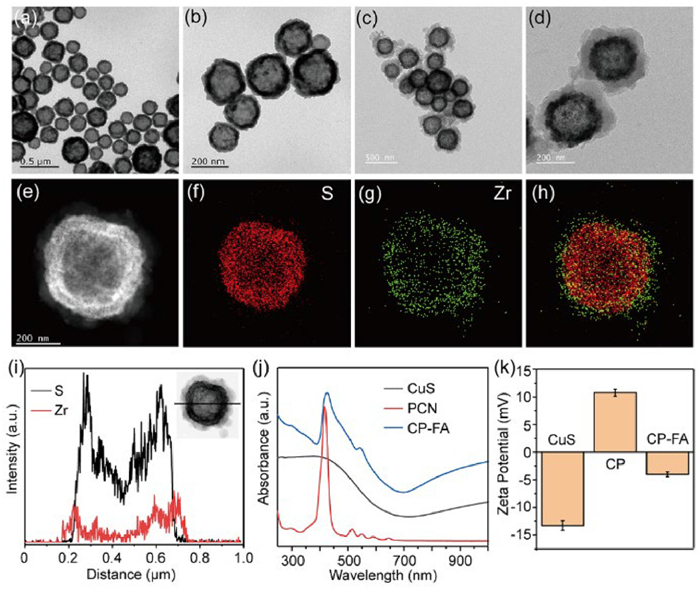
Copper-based nanomaterials have been extensively explored and employed in the biomedical field [39–41]. Herein, hollow-structured CuS NPs, a kind of low-cost photothermal agent with a broad absorption in the near-infrared (NIR) light region, were prepared by a template-assisted approach [42,43]. As shown in Figs. 1a and b, CuS NP had a homogeneous hollow morphological structure and good dispersion. The CuS was then coated with PCN to obtain CuS@PCN (CP). Briefly, the as-synthesized CuS NPs were added to a N,N-dimethylformamide (DMF) solution containing 5,10,15,20-tetrakis(4-carboxyphenyl)porphyrin, ZrOCl2·8H2O, and benzoic acid. The mixture was stirred at 90 ℃ for 5 h, and the resulting CP NPs were collected by centrifugation. Figs. 1c and d demonstrate the representative transmission electron microscope (TEM) images of CP NPs. An obvious core-shell structure of CP NPs was presented, as the appearance of the PCN shell has a lower contrast compared with the CuS core. Particle-size analysis by counting a total of 100 particles from the TEM images revealed that the diameter of CP increased from 240 nm (the diameter of CuS) to 380 nm. The thickness of the PCN shell was about 70 nm. High-angle annular dark-field scanning transmission electron microscopy and energy-dispersive X-ray spectroscopy (HAADF-STEM-EDS) elemental mapping (Figs. 1e–h) and line scan (Fig. 1i) demonstrated a uniform distribution of S (characteristic element of CuS) and Zr (characteristic element of PCN) in the core-shell structure, further evidencing the successful preparation of CP NPs.
Figure 1
Figure 1.
TEM images of (a, b) CuS and (c, d) CP NPs. (e–h) HAADF-STEM images of a single CP NP, along with the corresponding EDS element maps for S and Zr. (i) EDS line scan profile of a single CP NP along the line displayed in the HAADF-STEM image (inset). (j) Absorption spectra of CuS, PCN, and CP-FA NPs. (k) Zeta potentials of CuS, CP, and CP-FA NPs. Data are presented as mean ± standard deviation (SD) (n = 3).
FA-PEG molecules were then conjugated on the surface of CP NPs through the coordination interaction between the carboxyl group of FA-PEG with coordinatively unsaturated Zr4+ sites in the PCN shell. TEM images presented that the morphology and size of the as-synthesized CP-FA were similar to those of CP (Fig. S1 in Supporting information). Ultraviolet-visible (UV-vis)-NIR absorption spectra of CuS, PCN, and CP-FA NPs were measured using a JASCO V-750 spectrophotometer. In Fig. 1j, the absorbance of CP-FA exhibited the characteristic absorption peaks of PCN (centered at ~425 nm) and a broad absorption band coming from CuS NPs (700–1000 nm). Note that no FA absorption peaks were detected in the CP-FA spectrum (300–1000 nm), consistent with the non-absorbing nature of FA in this region. The zeta potential values of CuS and CP NPs were −13.2 and 10.7 mV, respectively (Fig. 1k). FA functionalization reduced the zeta potential to −4.0 mV, owing to the negatively charged carboxyl groups in FA. These results indicated the successful synthesis of CP-FA NPs.
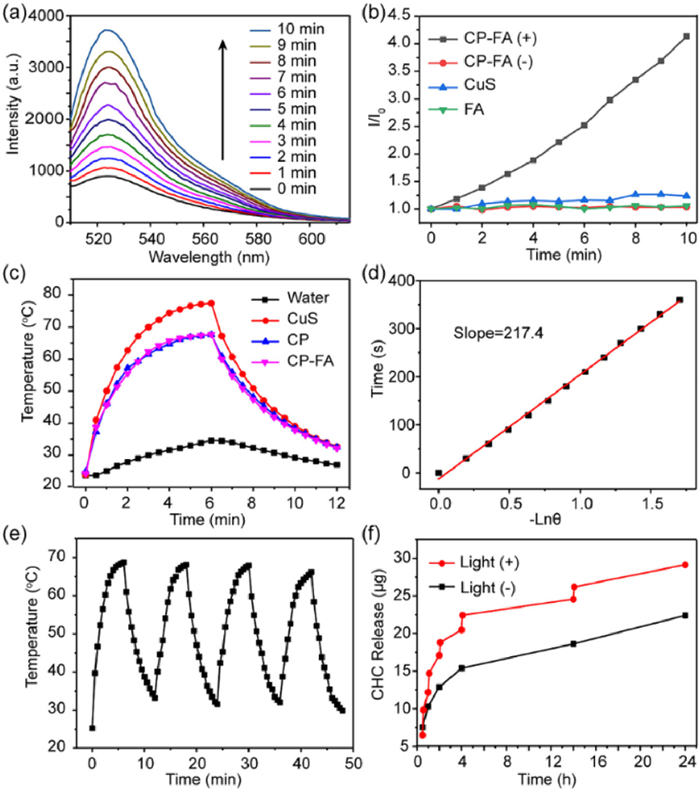
The reactive oxygen species (ROS) generation induced by CP-FA under 640 nm laser irradiation was tested by using singlet oxygen sensor green (SOSG). In the presence of ROS, SOSG can react with ROS to produce SOSG endoperoxides that emit strong green fluorescence peaked at 525 nm, and therefore provides a quantitative measurement of ROS generation. As shown in Figs. 2a and b, the fluorescence intensity of SOSG in CP-FA solution increased in a time-dependent manner upon the 640 nm laser irradiation, but remained unchanged without laser irradiation, representing the effective generation of ROS in CP-FA solution during the irradiation. As a control, CuS or FA cannot generate ROS under 640 nm laser irradiation, indicating that the 640 nm light photons were harvested by the PCN shell for ROS generation.
Figure 2
Figure 2.
Time-dependent fluorescence spectra of a mixture of SOSG and CP-FA NPs in water under 640 nm light irradiation. (b) Emission intensity of SOSG at 525 nm against irradiation time. (c) Photothermal heating curves of NPs under 808 nm irradiation (1.0 W/cm2). (d) Plot of cooling time versus negative natural logarithm of the temperature driving force, obtained from the cooling curve of CP-FA. (e) Heating curves of an aqueous solution of CP-FA NPs for 4 laser on/off cycles (808 nm, 1.0 W/cm2). (f) CHC releases profiles of CP-FA with/without 808 nm light irradiation.
Next, the photothermal effect of the NPs in aqueous solution was evaluated. First, the absorption spectra of different concentrations of CP-FA were tested. As demonstrated in Fig. S2 (Supporting information), the absorption increased with the increasing concentrations of CP-FA. The relatively high absorption in the NIR window motivated us to investigate the photothermal performance of NPs under 808 nm laser irradiation. As shown in Fig. 2c, the pure water showed a slight temperature change. In comparison, CP and CP-FA solutions (200 µg/mL) exhibited noticeable and similar temperature variations from 24 ℃ to 68 ℃ under the same irradiation conditions (1.0 W/cm2) due to the identical weight concentration of CuS. Fig. S3 (Supporting information) illustrates a concentration-dependent photothermal behavior of CP-FA. These results indicated the effective heat generation of CP-FA NPs. The photothermal-conversion efficiency (η) of CP-FA NPs was calculated to be 35.03% based on the as-obtained data (Fig. 2d), which was consistent with the previously reported results [44,45]. The photothermal stability of CP-FA NPs under 808 nm laser irradiation was also investigated. Fig. 2e demonstrates that CP-FA NPs showed good photothermal stability in the four radiation-cooling cycles. Therefore, the as-synthesized CP-FA NPs were promising photothermal candidates for future bioapplications.
Taking advantage of the hollow mesoporous structure of CP-FA NPs, the CHC molecule, a typical MCT1 inhibitor, was successfully loaded into NPs [46]. The loading content of CHC was determined to be 6.1 wt%. UV–vis-NIR absorption spectrum of CHC-CP-FA NPs was tested. As shown in Fig. S4 (Supporting information), the spectrum of CHC-CP-FA contained the characteristic absorption peak of CHC, which confirms the successful loading of CHC in CHC-CP-FA nanoparticles. The resulting CHC-CP-FA NPs could sustain drug release for as long as 24 h (Fig. 2f). Notably, 808 nm laser irradiation (1 W/cm2) could enhance the release of CHC from the CHC-CP-FA NPs, mainly because the photothermal effect of NPs can accelerate the CHC release from the hollow mesoporous NPs [47,48].
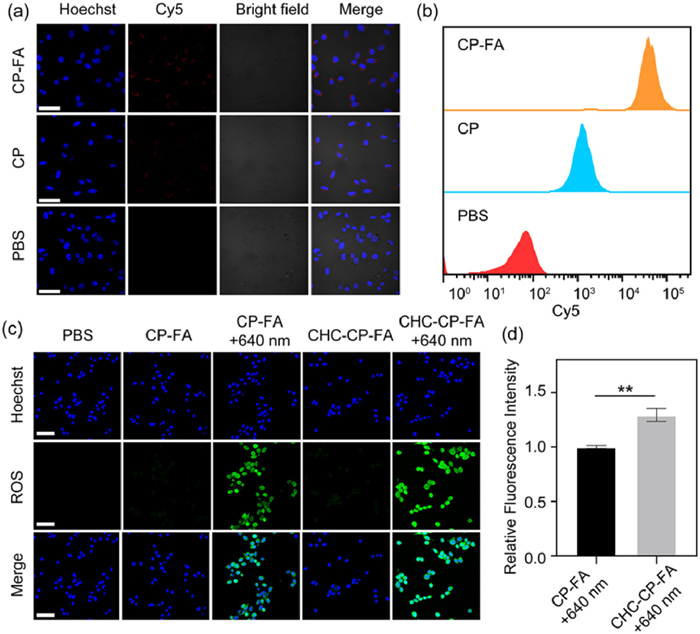
Then the cellular internalization of the NPs was tested by incubating Cy5-loaded CP or Cy5-loaded CP-FA (Cy5 was loaded in the hollow mesoporous structure of CP or CP-FA NPs) with CT26 cells for 4 h. As shown in Fig. 3a, after 4 h of incubation, the red Cy5 fluorescence was observable in CP-treated cells, demonstrating the effective cell internalization. Notably, a significant increase in fluorescence intensity was observed for CP-FA, which was quantified as 1.47-fold higher than in CP-treated cells (Fig. S5 in Supporting information). Flow cytometry results corroborated this finding (Fig. 3b). Compared to the CP group, CP-FA group showed a rightward shift, indicating the enhanced cellular uptake of CP-FA [49,50].
Figure 3
Figure 3.
(a) Fluorescent images of tumor cells incubated with CP or CP-FA NPs. Scale bar: 50 µm. (b) Flow cytometric analysis of the cellular uptake of CP or CP-FA NPs. (c) Fluorescent images of tumor cells incubated with NPs and DCFH-DA, with or without 640 nm laser irradiation. Scale bar: 50 µm. (d) Quantification of ROS production in tumor cells treated with CP-FA or CHC-CP-FA with 808 nm laser irradiation. Data are presented as mean ± SD (n = 3). **P < 0.01 (one-way ANOVA).
The ability of CP-FA or CHC-CP-FA NPs to trigger the intracellular ROS generation was evaluated via the utilization of an intracellular ROS indicator called 2,7-dichlorofluorescein-diacetate (DCFH-DA). As presented in Fig. 3c, cells treated with phosphate-buffered saline (PBS), CP-FA, and CHC-CP-FA without 640 nm laser irradiation showed little green fluorescence. In contrast, the cells incubated with CP-FA following 640 nm laser irradiation (labeled as CP-FA + 640 nm) demonstrated high green fluorescence, which was attributed to the effective ROS generation of CP-FA under 640 nm laser irradiation. Compared with CP-FA + 640 nm, a stronger fluorescence can be observed in the cells treated with CHC-CP-FA + 640 nm laser irradiation (labeled as CHC-CP-FA + 640 nm), indicating that CHC can enhance the ROS generation ability of NPs under the same laser irradiation condition. The quantification of green-fluorescence intensity in Fig. 3c showed that the cells treated with CHC-CP-FA + 640 nm induced 1.29-fold-higher fluorescence intensity of DCF than those treated with CP-FA + 640 nm (Fig. 3d).
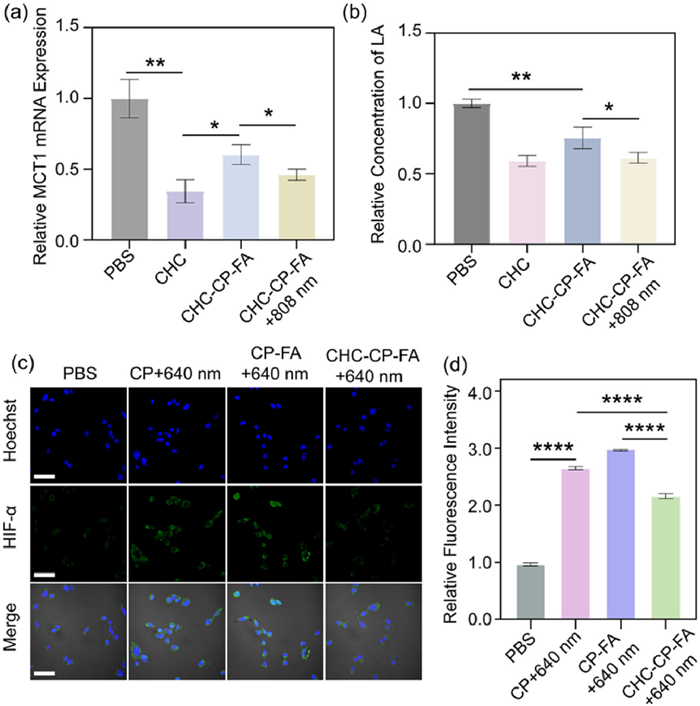
We hypothesized that CHC could elevate the intratumoral O2 concentration during PDT by inhibiting MCT1, thereby promoting the generation of ROS. To prove it, the inhibition effect of CHC on the MCT1 expression of tumor cells was first studied. CT26 cells were treated with free CHC, CHC-CP-FA, or CHC-CP-FA + 808 nm laser irradiation (labeled as CHC-CP-FA + 808 nm). After 24 h incubation, the quantitative real-time polymerase chain reaction (qRT-PCR) was performed with PowerUpTM SYBRTM Green Master Mix to test the expression level of MCT1 mRNA. As shown in Fig. 4a, compared with the control group (PBS-treated cells), the cells incubated with CHC-CP-FA showed a significant down-regulation (60.3%) of MCT1 mRNA expression, indicating the effective inhibition of CHC on MCT1 expression. CHC-CP-FA + 808 nm treatment showed a better inhibition effect on MCT1 expression owing to the photothermal-enhanced CHC release from CHC-CP-FA NPs. Worth noting that CHC-CP-FA or CHC-CP-FA + 808 nm treatment showed a lower suppression rate compared with the CHC group, perhaps because it took some time for the CHC to be released from the CHC-CP-FA NPs. The potent MCT1 inhibition by CHC-CP-FA + 808 nm was further confirmed by Western blot analysis. As shown in Fig. S6 (Supporting information), CHC-CP-FA treatment reduced MCT1 protein expression, and this reduction was enhanced after 808 nm laser irradiation.
Figure 4
Figure 4.
(a) Quantification of MCT1 mRNA expression in tumor cells. (b) LA concentrations in the tumor cells after different treatments. (c) Fluorescent images of tumor cells for the intracellular HIF-1α detection. Scale bar: 50 µm. (d) Quantification of intracellular HIF-1α expression in tumor cells after different treatments. Data are presented as mean ± SD (n = 3). *P < 0.05, **P < 0.01, ****P < 0.0001 (one-way ANOVA).
Next, the inhibition effect of CHC on the LA-uptake of tumor cells was examined. Typically, CT26 tumor cells were treated with free CHC, CHC-CP-FA, or CHC-CP-FA + 808 nm in 1640 medium containing 10×10−3 mol/L of LA. After 12 h of incubation, the LA concentrations in tumor cells were tested using an LA assay kit. As presented in Fig. 4b, the addition of CHC-CP-FA can remarkably reduce the intracellular concentration of LA compared with the control group, demonstrating that CHC is an effective MCT1 inhibitor to decrease the LA uptake of tumor cells from TME. As expected, the inhibitory effect of CHC-CP-FA + 808 nm on LA-uptake was slightly higher than that of CHC-CP-FA, owing to the photothermal-enhancement of the CHC release.
CHC efficiently reduced the internalization of LA to conserve oxygen consumption. We then examined the oxygen consumption rate (OCR) of CT26 cells after different treatments using a corresponding assay kit (E-BC-F068, Elabscience, Wuhan). As presented in Fig. S7 (Supporting information), CHC-CP-FA treatment significantly reduced the oxygen consumption compared with the control groups. This result supports our previous inference that CHC can elevate the intratumoral concentration of O2. To access the ability of nanoparticles to alleviate tumor hypoxia, we characterized the hypoxia microenvironment of tumor cells by testing the expression levels of hypoxia-inducible factor-1α (HIF-1α). As shown in Figs. 4c and d, the cells treated with CP + 640 nm or CP-FA + 640 nm exhibited an obvious green fluorescence from the hypoxy-probes, indicating that a serious hypoxic stress was induced by the PDT effect of NPs. CP-FA + 640 nm treated cells showed an even higher hypoxic level than that of CP + 640 nm-treated cells because of the FA receptor-mediated tumor-targeting effect. In contrast, CHC-CP-FA + 640 nm treated cells showed a relatively weak fluorescence intensity of the hypoxia probes. That is, the HIF-1α level in the CHC-CP-FA + 640 nm group was reduced compared with that in the CP + 640 nm or CP-FA + 640 nm group, suggesting that the hypoxic condition induced by PDT was improved through the CHC-mediated interference in the LA-fueled aerobic respiration.
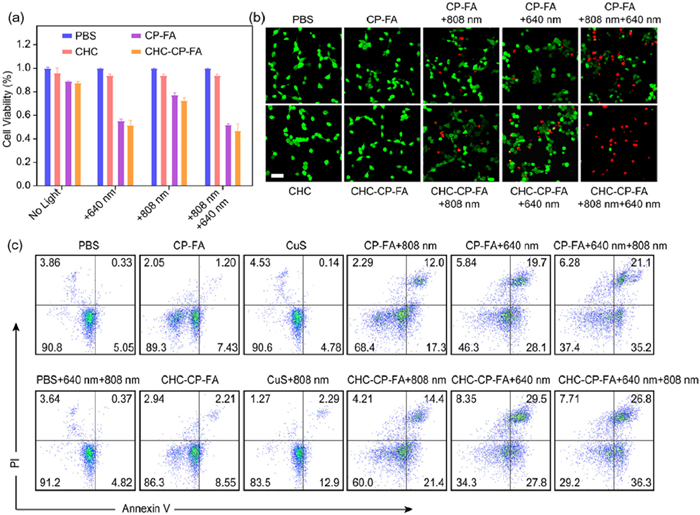
After confirming ROS generation and CHC-mediated disruption of LA-fueled aerobic respiration in tumor cells, we assessed the in vitro therapeutic efficacy of the NPs against CT26 cells using a cell counting kit-8 (CCK-8) assay. As presented in Fig. 5a, treatment with CP-FA or CHC-CP-FA resulted in no significant change in the cell vitality, indicating the good biocompatibility of these NPs. CHC alone showed no cytotoxicity, indicating that CHC alone cannot affect ROS sensitivity or cellular metabolism. PBS treatment following 640 nm laser irradiation and/or 808 nm laser irradiation also showed a high cell viability (> 97%), suggesting the low toxicity of the laser irradiation to the cells. Upon 640 nm laser irradiation, CP-FA or CHC-CP-FA exhibited significant cell cytotoxicity due to the PDT effect. Notably, CHC-CP-FA + 640 nm treatment showed a higher cytotoxicity than that treated with CP-FA + 640 nm, confirming the improved PDT effect through the CHC-mediated interference with the LA-fueled aerobic respiration. Under 808 nm laser irradiation, there was some cell toxicity after cell incubation with CP-FA or CHC-CP-FA, because of the photothermal therapeutic effect of the NPs. The cells incubated with CHC-CP-FA under two laser irradiations (CHC-CP-FA + 808 nm + 640 nm) showed a higher cytotoxicity than the other groups, confirming an enhanced cell killing effect through the collaboration of CHC, photosensitizer, and photothermal agent to enhance PDT.
Figure 5
Figure 5.
(a) Cell viability test of tumor cells by using the CCK-8 test. Data are presented as mean ± SD (n = 3). (b) Cell viability test of tumor cells by using a live/dead cell staining kit. Scale bar: 50 µm. (c) Cell apoptosis was analyzed by flow cytometry after different treatments.
The Annexin V-fluorescein isothiocyanate/propidium iodide (FITC/PI) apoptosis detection assay was then performed by confocal laser scanning microscope (CLSM) observation. As shown in Fig. 5b, a few dead cells (PI stained, red fluorescence) were detected in the cells treated with CP-FA or CHC-CP-FA without laser irradiation, indicating the low cytotoxicity of NPs to the tumor cells. CHC alone showed no obvious cytotoxicity. These results are consistent with CCK-8 data in Fig. 5a. The cell-killing ability of NPs was enhanced in the groups of CP-FA or CHC-CP-FA following 808 nm or 640 nm laser irradiation, owing to the photodynamic or photothermal effect of the NPs. Approximately 50% of the cells treated with CP-FA + 808 nm + 640 nm were dead, while > 80% of the cells treated with CHC-CP-FA + 808 nm + 640 nm were killed, confirming that the CHC-CP-FA treatment could induce improved cellular apoptosis and subsequent cell death. In addition, flow cytometry was further utilized to quantitatively analyze the percentage of apoptotic/necrotic tumor cells (Fig. 5c). Upon 808 nm and 640 nm laser irradiation, CP-FA and CHC-CP-FA exhibited significant cytotoxicity to tumor cells. Notably, irradiated CHC-CP-FA showed the lowest level of healthy cells (29.4%) among all of the groups. The results were in agreement with the results of CCK-8 and live/dead cell staining, demonstrating that both the CHC drug and the photothermal effect of NPs play important roles in enhancing the antitumor effect of PDT.
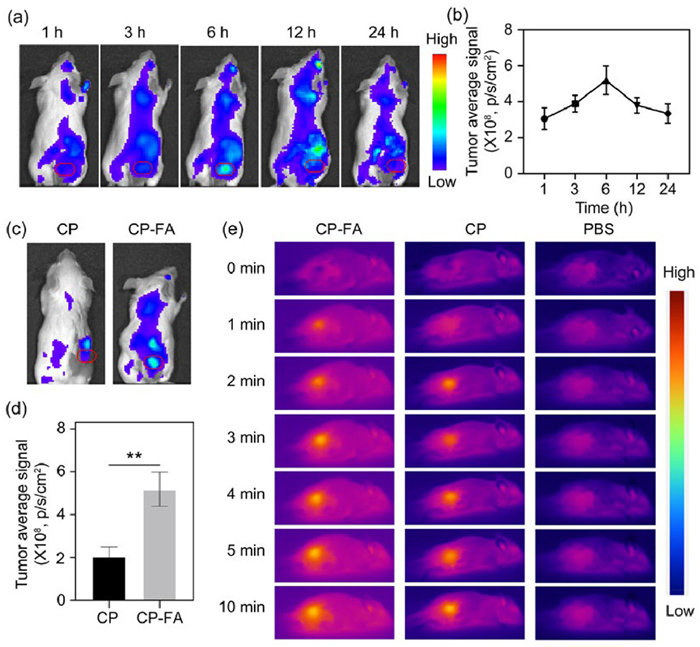
To evaluate the tumor accumulation effect of CP-FA NPs in vivo, BALB/c mice (all in vivo experiments were approved by the Institutional Animal Care and Use Committee of Beijing Tuberculosis and Thoracic Tumor Re-search Institute) bearing subcutaneous tumors were administered intravenously with Cy5-loaded CP-FA (where Cy5 was entrapped in the hollow mesoporous structure of CP-FA). The whole-body fluorescence imaging was then performed at the predetermined time points (1, 3, 6, 12, 24 h). The results were presented in Figs. 6a and b, which showed that the fluorescence intensity at the tumor site presents a time-dependent increase before reaching a maximum at 6 h post-injection. Moreover, to evaluate the in vivo tumor-targeting capability of CP-FA NPs, tumor-bearing mice were intravenously administered with Cy5-loaded CP-FA or CP NPs. Whole-body fluorescence imaging was performed 6 h post-injection. As shown in Figs. 6c and d, mice treated with CP-FA NPs exhibited approximately 2.51-fold higher fluorescence intensity in the tumor region compared to those receiving CP NPs. This result demonstrates a significantly enhanced tumor accumulation of CP-FA NPs, which can be attributed to folate receptor-mediated active targeting.
Figure 6
Figure 6.
Representative fluorescence images of tumor-bearing mice treated with CP-FA at different time points. The red circle in each image indicates the tumor site. (b) Quantification of the fluorescent signal at the tumor sites in (a). (c) Representative fluorescence images of tumor-bearing mice treated with CP or CP-FA at 6 h post-injection. (d) Quantification of the fluorescent signal at the tumor sites in (c). **P < 0.01 (one-way ANOVA). (e) Representative photothermal images of tumor-bearing mice treated with CP or CP-FA under 808 nm light irradiation. Data are presented as mean ± SD (n = 3).
Thereafter, we evaluated the in vivo photothermal performance of CP-FA NPs in tumor tissues. Tumor surface temperatures were measured under 808 nm laser irradiation at 6 h post-injection. As shown in Fig. 6e and Fig. S8 (Supporting information), mice injected with PBS showed no significant temperature change after 10 min of irradiation. In contrast, tumors in mice treated with CP NPs exhibited a marked temperature increase from 32 ℃ to 43 ℃ under the same irradiation conditions, which can be attributed to the enhanced permeability and retention (EPR) effect-mediated passive targeting and the intrinsic photothermal conversion capability of CP NPs. Notably, tumors in the CP-FA group reached a higher temperature compared to those treated with CP NPs, indicating an enhanced tumor accumulation through folate receptor-mediated endocytosis.
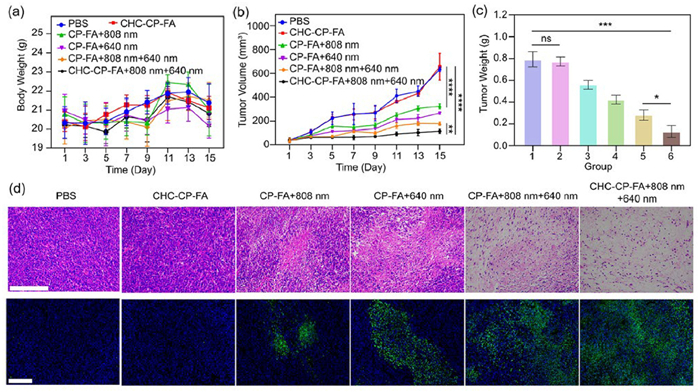
Based on the good performance of CHC-CP-FA at a cellular level, we further investigated its antitumor efficiency in vivo. Briefly, eighteen female BALB/c mice bearing CT26 tumors were randomly divided into six groups (n = 3) and treated with PBS, CHC-CP-FA, CP-FA + 808 nm, CP-FA + 640 nm, CP-FA + 808 nm + 640 nm, and CHC-CP-FA + 808 nm + 640 nm. For the irradiation groups, the 808 nm and/or 640 nm laser irradiation was applied for 10 min at 6 h post-injection. The tumor sizes and body weights of mice were monitored every other day for 15 days, and the results are shown in Fig. 7. According to the weight diversity curves (Fig. 7a), there was no statistically significant difference in the body weights of mice among different groups, implying the safety and biocompatibility of NPs at the animal level. The tumor growth curves after different treatments are presented in Fig. 7b. The results showed that tumors of mice in the CHC-CP-FA group grew rapidly, indicating that treatment with CHC-CP-FA had no antitumor effect. After laser irradiation with the 640 or 808 nm laser, moderate tumor inhibition was achieved in mice treated with CHC-CP-FA + 808 nm (49.0%) or CHC-CP-FA + 640 nm (57.8%). CHC-CP-FA treatment with sequential irradiation of 808 and 640 nm lasers showed an enhanced tumor inhibition (82.0%), which was attributed to the more effective ROS generation during PDT. The therapeutic efficacy of NPs was further proved by the representative photographs (Fig. S9 in Supporting information) and average weights (Fig. 7c) of the final tumors excised from mice of different treatment groups. The mice treated with CHC-CP-FA + 808 nm + 640 nm have the lightest tumor weight among all groups.
Figure 7
Figure 7.
(a) Body weights of mice after different treatments. (b) Tumor volumes of mice after different treatments. (c) Final weights of the excised tumors on the last day of experiments. (1) PBS, (2) CHC-CP-FA, (3) CP-FA + 808 nm, (4) CP-FA + 640 nm, (5) CP-FA + 808 nm + 640 nm, (6) CHC-CP-FA + 808 nm + 640 nm. (d) H&E staining and TUNEL staining of tumor tissues from different treatment groups. Scale bar: 100 µm. Data are presented as mean ± SD (n = 3). *P < 0.05, **P < 0.01, ***P < 0.001, ****P < 0.0001 (one-way ANOVA). ns, no significance.
The anti-tumor treatment effect was further evaluated through hematoxylin-eosin (H&E) staining of the tumor slices. As shown in Fig. 7d, severe nucleus dissociation and necrosis can be observed in the tumors treated with CHC-CP-FA + 808 nm + 640 nm, while lower levels of damage were observed in the other groups. Similar results were obtained through the terminal deoxynucleotidyl transferase dUTP nick end labeling (TUNEL) assay. A large number of apoptotic cells (green fluorescence) were detected in the treatment group of CHC-CP-FA + 808 nm + 640 nm, which was obviously more than that in other experimental groups (Fig. 7d).
The major organs (heart, liver, spleen, lung, and kidney) of the mice were assessed by H&E staining. As presented in Fig. S10, there is no obvious abnormality in all of the organizations, confirming the low systemic toxicity of the NPs. Moreover, the biochemical parameters in the serum (e.g., glutamic oxalacetic transaminase (AST), creatinine (CREA), urea (UREA), glutamic-pyruvic transaminase (ALT)) were tested. There were no obvious differences between the experimental group and the PBS group (Fig. S11 in Supporting information). The complete blood was also carefully collected for testing the hematological parameters, including the numbers of white blood cells (WBC), red blood cells (RBC), haemoglobin (HGB), hematocrit (HCT), mean corpuscular hemoglobin concentration (MCHC), and platelets (PLT). As presented in Fig. S12 (Supporting information), the parameters in all groups were within the normal range. These results revealed the good biocompatibility of the NPs.
In conclusion, we report the design and synthesis of a tumor-specific and highly effective PDT nanosystem based on the combination of a hollow-structured CuS@PCN nanoparticle and MCT1 inhibitors of CHC with an FA receptor-mediated tumor-targeting strategy. We have experimentally proved that the as-synthesized CHC-CP-FA NPs encompass the benefits of (ⅰ) the effective loading of the MCT1 inhibitors (CHC) for evaluation of O2 concentration, (ⅱ) the photosensitizer-based PCN as PSs for efficient PDT, (ⅲ) photothermal-enhanced release of CHC induced by CuS, and (ⅳ) the specific biorecognition capability of FA. Worth noting that the effective blocking of LA influx through CHC could amplify the PDT efficacy through the increase of intratumor O2 concentration. This work sheds light on the hybrid engineering of nanoparticles to combat the current limitations of PDT.
Declaration of competing interest
The authors declare that they have no known competing financial interests or personal relationships that could have appeared to influence the work reported in this paper.
This work was financially supported by Capital Medical University Outstanding Young Talents Project (No. B2407, China) and Young Elite Scientist Sponsorship Program by Best (No. BYESS2024059).
Supplementary materials
Supplementary material associated with this article can be
found, in the online version, at doi:10.1016/j.cclet.2025.111851.
Scheme 1
Schematic illustration of the synthesis of CHC-CP-FA NPs and the use of CHC-CP-FA NPs for cancer therapy. "CHC-CP-FA-treated tumor cells" referred to the tumor cells treated with CHC-CP-FA nanoparticles; "Untreated tumor cells" referred to the tumor cells without any nanoparticle treatment.
Figure 1
TEM images of (a, b) CuS and (c, d) CP NPs. (e–h) HAADF-STEM images of a single CP NP, along with the corresponding EDS element maps for S and Zr. (i) EDS line scan profile of a single CP NP along the line displayed in the HAADF-STEM image (inset). (j) Absorption spectra of CuS, PCN, and CP-FA NPs. (k) Zeta potentials of CuS, CP, and CP-FA NPs. Data are presented as mean ± standard deviation (SD) (n = 3).
Figure 2
Time-dependent fluorescence spectra of a mixture of SOSG and CP-FA NPs in water under 640 nm light irradiation. (b) Emission intensity of SOSG at 525 nm against irradiation time. (c) Photothermal heating curves of NPs under 808 nm irradiation (1.0 W/cm2). (d) Plot of cooling time versus negative natural logarithm of the temperature driving force, obtained from the cooling curve of CP-FA. (e) Heating curves of an aqueous solution of CP-FA NPs for 4 laser on/off cycles (808 nm, 1.0 W/cm2). (f) CHC releases profiles of CP-FA with/without 808 nm light irradiation.
Figure 3
(a) Fluorescent images of tumor cells incubated with CP or CP-FA NPs. Scale bar: 50 µm. (b) Flow cytometric analysis of the cellular uptake of CP or CP-FA NPs. (c) Fluorescent images of tumor cells incubated with NPs and DCFH-DA, with or without 640 nm laser irradiation. Scale bar: 50 µm. (d) Quantification of ROS production in tumor cells treated with CP-FA or CHC-CP-FA with 808 nm laser irradiation. Data are presented as mean ± SD (n = 3). **P < 0.01 (one-way ANOVA).
Figure 4
(a) Quantification of MCT1 mRNA expression in tumor cells. (b) LA concentrations in the tumor cells after different treatments. (c) Fluorescent images of tumor cells for the intracellular HIF-1α detection. Scale bar: 50 µm. (d) Quantification of intracellular HIF-1α expression in tumor cells after different treatments. Data are presented as mean ± SD (n = 3). *P < 0.05, **P < 0.01, ****P < 0.0001 (one-way ANOVA).
Figure 5
(a) Cell viability test of tumor cells by using the CCK-8 test. Data are presented as mean ± SD (n = 3). (b) Cell viability test of tumor cells by using a live/dead cell staining kit. Scale bar: 50 µm. (c) Cell apoptosis was analyzed by flow cytometry after different treatments.
Figure 6
Representative fluorescence images of tumor-bearing mice treated with CP-FA at different time points. The red circle in each image indicates the tumor site. (b) Quantification of the fluorescent signal at the tumor sites in (a). (c) Representative fluorescence images of tumor-bearing mice treated with CP or CP-FA at 6 h post-injection. (d) Quantification of the fluorescent signal at the tumor sites in (c). **P < 0.01 (one-way ANOVA). (e) Representative photothermal images of tumor-bearing mice treated with CP or CP-FA under 808 nm light irradiation. Data are presented as mean ± SD (n = 3).
Figure 7
(a) Body weights of mice after different treatments. (b) Tumor volumes of mice after different treatments. (c) Final weights of the excised tumors on the last day of experiments. (1) PBS, (2) CHC-CP-FA, (3) CP-FA + 808 nm, (4) CP-FA + 640 nm, (5) CP-FA + 808 nm + 640 nm, (6) CHC-CP-FA + 808 nm + 640 nm. (d) H&E staining and TUNEL staining of tumor tissues from different treatment groups. Scale bar: 100 µm. Data are presented as mean ± SD (n = 3). *P < 0.05, **P < 0.01, ***P < 0.001, ****P < 0.0001 (one-way ANOVA). ns, no significance.

 DownLoad:

 下载:
下载:


 下载:
下载:
