School of Environmental Science and Technology, Dalian University of Technology, Dalian 116024, China
* Corresponding author. E-mail address: myang@dlut.edu.cn (M. Yang). 1 These authors contributed equally to this work.
Received Date:
11 August 2025 Accepted Date:
17 September 2025 Revised Date:
08 September 2025 Available Online:
15 November 2026
Abstract:
The vast reserves of uranium in seawater offer a sustainable feedstock for nuclear energy, yet their exploitation is hindered by ultralow concentrations and a complex ionic milieu. We report a structurally engineered molybdenum nitride–carbon cloth (E-MoN/CC) electrode that combines high surface area (95.8 m2/g) with tailored electronic structure for highly efficient electrochemical uranium recovery. Nitrogen incorporation into MoN creates catalytically active sites that accelerate the reduction of uranyl species, while etching-induced hierarchical porosity enhances electron transport and facilitates ion diffusion. In uranium-spiked artificial seawater (10 ppm), E-MoN/CC delivers a capacity of 586 mg/g at −0.9 V vs. RHE, exceeding MoO3/CC by 1.2-fold, and achieves 99% removal within 1 h. The electrode sustains a record the maximum extraction capacity of 11,990 mg/g in uranium-spiked seawater, while maintaining negligible performance loss over seven cycles. This work establishes metal nitride architectures as robust, scalable platforms for green electrochemical uranium extraction from complex marine environments.
The global reliance on nuclear energy as a low-carbon and high-efficiency power source has underscored the strategic importance of uranium as a primary fuel. With the continuous expansion of nuclear power infrastructure, the urgency to secure sustainable uranium supplies has intensified [1-4]. However, the finite terrestrial reserves are insufficient to meet the long-term demands of the nuclear fuel cycle, prompting increasing attention toward marine uranium resources as a vast yet underutilized alternative [5-7]. Seawater contains approximately 4.5 billion tons of uranium, thousands of times greater than land-based deposits, yet its ultralow concentration (3.3 ppb), high salinity, and complex ionic composition pose formidable barriers to efficient extraction.
Traditional extraction approaches, including adsorption [8-10] and ion exchange [11], typically suffer from limited selectivity and rely on reversible physical interactions, which complicate product isolation and necessitate additional regeneration steps. In contrast, electrochemical uranium extraction (EUE) offers a direct and environmentally benign route by electrochemically reducing soluble uranyl ions (UO22+) into insoluble uranium compounds under an applied potential. This method enables in situ deposition of solid products and shows strong potential for integration into flow-based, continuous systems [12,13].
The performance of EUE, however, is heavily dependent on the development of robust electrode materials capable of maintaining high conductivity, chemical stability, and catalytic activity in corrosive marine environments.
In this study, we designed and synthesized high-surface-area spherical MoN as a functional electrode material for EUE. Nitrogen atoms in MoN act as active sites to promote uranyl ion reduction and facilitate electron transfer. Notably, the etched MoN (E-MoN) exhibits substantially enhanced extraction kinetics and capacity compared to its pristine counterpart, attributed to increased active surface exposure and improved charge transfer dynamics. The E-MoN/carbon cloth (E-MoN/CC) electrode achieves a high extraction capacity of 11,990 mg/g and enables complete removal of 10 ppm U(Ⅵ) from spiked seawater within 1 h, surpassing the performance of most reported electrodes. These findings highlight the promise of MoN-based architectures for advancing electrochemical uranium recovery and offer a scalable pathway toward sustainable utilization of oceanic uranium resources.
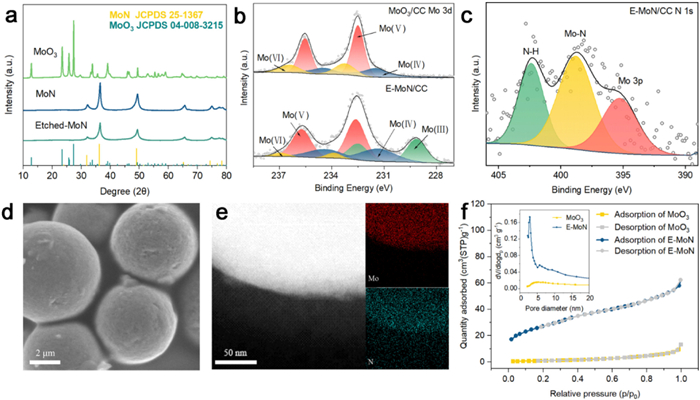
The precursor materials were synthesized via a solvothermal method, followed by calcination under ammonia atmosphere to obtain MoN (Fig. 1a). X-ray photoelectron spectroscopy (XPS) analysis reveals that the Mo 3d orbital splits into multiple peaks, with the peak at 228.5 eV attributed to Mo3+ in the nitrided state (Fig. 1b) [14]. Additionally, the N 1s orbital exhibits overlap with the Mo 3p orbital (Fig. 1c). As shown in the scanning electron microscopy (SEM) image of E-MoN (Fig. S1 in Supporting information), the E-MoN maintains a nanosphere structure composed of surface nanoparticles with an average diameter of approximately 600 nm (Fig. 1d). In contrast, MoO3 exhibits irregular block-like structures, while the surface of unetched MoN appears relatively smooth (Fig. S1). The elemental SEM mapping of E-MoN confirms the uniform distribution of Mo and N elements (Fig. 1e). Likewise, the SEM elemental mapping of MoO3 reveals a homogeneous distribution of Mo and O elements (Fig. S2 in Supporting information).
Figure 1
Figure 1.
(a) X-ray diffraction (XRD) patterns of MoO3/CC, MoN/CC and E-MoN/CC. High-resolution X-ray photoelectron spectroscopy (XPS) spectra of (b) Mo 3d and (c) N 1s. (d) Scanning electron microscopy (SEM) images of E-MoN/CC. (e) High-angle annular dark-field scanning transmission electron microscopy (HAADF-STEM) and corresponding elemental mapping. (f) N2 adsorption-desorption curves and pore size distribution (inset) of E-MoN/CC and MoO3/CC.
As shown in the high-resolution transmission electron microscopy (HRTEM) image, E-MoN nanospheres display two distinct sets of lattice fringes with spacings of 1.86 and 2.48 Å, corresponding to the (202) and (200) crystal planes of MoN, respectively (Fig. S3 in Supporting information) [15,16]. The HRTEM results of MoO3, reveal two distinct sets of lattice fringes with interplanar spacings of 2.11 and 2.18 Å, corresponding to the (411) and (501) crystal planes of MoO3, respectively (Fig. S4 in Supporting information). The Brunauer-Emmett-Teller (BET) surface area measurements analysis revealed that the specific surface area of MoN increased significantly after etching, reaching 95.8 m2/g, 23 times higher than that of MoO3. E-MoN exhibits a typical type IV isotherm, characterized by convexity in the low-pressure region, capillary condensation in the high-pressure region, and an upward isotherm trend (Fig. 1f). Etching resulted in a significant increase in the specific surface area of MoN from 4.2 m2/g to 95.8 m2/g (Fig. S5 in Supporting information). The pore size distribution curve, obtained through BJH fitting, indicated a uniform mesoporous structure centered around 3.8 nm. In contrast, MoO3 exhibited an irregular pore size distribution. The mesoporous architecture of E-MoN/CC provides highly accessible channels for the rapid diffusion of uranyl ions, while its exceptionally high surface area facilitates effective contact and adsorption between the uranyl species and the electrode material [17,18].
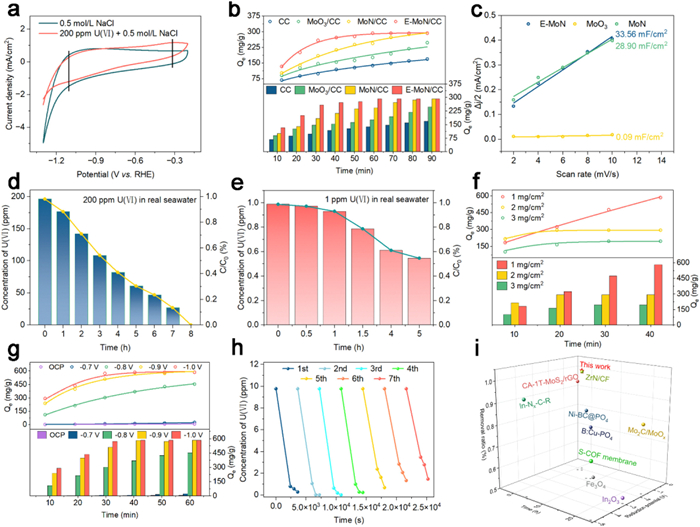
Cyclic voltammetry (CV) was employed to measure uranium reduction activity. Compared to uranium-free simulated seawater, an additional reduction peak was observed at −0.9 V (vs. RHE), corresponding to the uranium reduction reaction (Fig. 2a). Additionally, a UV calibration curve for U(Ⅵ) was established by measuring the linear relationship between U(Ⅵ) concentration and absorbance, which was subsequently used to quantify U(Ⅵ) concentrations under experimental conditions (Fig. S6 in Supporting information). The uranium extraction performance was evaluated in real seawater. Under identical conditions of initial uranium concentration (10 ppm) and applied potential (–0.9 V vs. RHE), the E-MoN/CC electrode demonstrated faster electrochemical extraction kinetics, higher extraction efficiency, and greater extraction capacity compared to MoO3. E-MoN/CC approached dynamic equilibrium within 60 min, while MoO3 showed no evident plateau even after 90 min. Moreover, the maximum extraction capacity of E-MoN/CC exceeded that of MoO3 by more than 1.2 times (Fig. 2b and Fig. S7 in Supporting information). The CV curves in real seawater with 10 ppm U(Ⅵ) solution were recorded with the sweep rate of 2–10 mV/s under non-Faraday intervals. Attributable to the electric double-layer capacitance and additional pseudocapacitive contributions, the CV curves exhibited nearly rectangular shapes without distinct Faradaic peaks (Fig. S8 in Supporting information). The double-layer capacitance (Cdl) of MoN is significantly higher than that of MoO3, suggesting a larger electrochemically active surface area (Fig. 2c). This enhanced surface area facilitates more efficient ion transfer between the solution and the electrode. Nyquist spectra indicate that E-MoN exhibits the lowest charge transfer resistance, reflecting superior electron transfer kinetics (Fig. S9 in Supporting information).
Figure 2
Figure 2.
(a) Cyclic voltammetry (CV) measurements in simulated seawater with 10 ppm U(Ⅵ) compared to unspiked simulated seawater. (b) A comparative analysis of uranium extraction performance of MoO3/CC, MoN/CC and E-MoN/CC with loading amount of 2 mg/cm2 and 10 ppm U(Ⅵ) in real seawater and applied voltage of −0.9 V. (c) Double layer capacitance (Cdl) measurements by CV of E-MoN, MoO3 and MoN. (d) Uranium extraction performances for E-MoN/CC with loading amount of 1 mg/cm2 with 1 ppm U(Ⅵ) in real seawater and applied voltage of −0.9 V. (e) Uranium extraction performances for E-MoN/CC with loading amount of 1 mg/cm2 and 200 ppm U(Ⅵ) in real seawater and applied voltage of −0.9 V. (f) The effect of loading amount on uranium extraction performance for E-MoN/CC with 10 ppm U(Ⅵ) in real seawater and applied voltage of −0.9 V. (g) The influence of applied voltage on uranium extraction efficiency for E-MoN/CC with 10 ppm U(Ⅵ) in real seawater and loading amount of 1 mg/cm2. (h) Successive removal performance of E-MoN/CC for seven cycles with 10 ppm U(Ⅵ) in real seawater and loading amount of 1 mg/cm2 and applied voltage of −0.9 V. A total volume of 60 mL of 10 ppm uranium-spiked seawater was used for all seven cycles. (i) The comparison of the uranium extraction performance by this work with other related materials.
In a high-concentration environment (200 ppm), the system achieved a remarkable 99.9% uranium removal efficiency, reducing the U(Ⅵ) concentration from 200 ppm to below 1 ppm within 8 h (Fig. 2d and Fig. S10 in Supporting information) with maximum extraction capacity up to 11,990 mg/g. E-MoN exhibits competitive advantages comparing to other electrode materials (Fig. S11 and Table S1 in Supporting information). At a lower initial U(Ⅵ) concentration of 1.0 ppm, the concentration decreased to 0.54 ppm after 5 h, corresponding to a removal rate of 46% (Fig. 2e). These demonstrate the suitability of E-MoN/CC for different enriched uranium systems. Uranium extraction experiments conducted with varying loadings revealed that the extraction capacity increased with lower loadings. An optimal loading of 1 mg/cm2 was identified and used in subsequent experiments (Fig. 2f and Fig. S12 in Supporting information).
To assess the contribution of physical adsorption, control experiments were performed under open-circuit potential (OCP) (Fig. 2g and Fig. S13 in Supporting information). No significant change in uranyl concentration was observed after 60 min, indicating that the reduction in U(Ⅵ) concentration was primarily driven by the applied potential through redox reactions, rather than physical adsorption. As the applied voltage increased from –0.7 V to –1.0 V, the uranium extraction capacity rose significantly, reaching a maximum of 586 mg/g at –1.0 V, surpassing the performance of comparable uranium extraction systems reported to date. However, we believe that –0.9 V offers better economic feasibility and does not markedly affect the reaction kinetics compared with more negative potentials, therefore, –0.9 V was selected for subsequent testing (Text in Supporting information).
The reusability of the electrode is critical for ensuring economic viability [19,20]. The electrode maintained stable performance even after 7 consecutive usage cycles in Fig. 2h, the electrochemical uranium extraction efficiency remained above 90% indicating good stability and ensuring reliable, repeatable practical applications [21,22]. This performance is comparable to values reported in recent literature [23,24]. We evaluated the electrochemical stability of E-MoN within the Faradaic region by recording CV and linear sweep voltammetry (LSV) curves before and after seven cycles. The results indicated negligible attenuation of electrochemical activity, confirming the excellent long-term stability of E-MoN in real seawater (Fig. S14 in Supporting information), which is essential for long-term operation and large-scale applications.
Considering the complex cationic environment of seawater, we evaluated the extraction selectivity of the material toward uranyl ions. Simulated seawater (0.5 mol/L NaCl) containing 10 ppm U was spiked with 100 ppm of common coexisting cations (Ni2+, Co2+, Zn2+, V5+, Ca2+, Mg2+, and K+). The results revealed that E-MoN exhibited excellent resistance to cationic interference. Even in the presence of seven competing cations at concentrations ten times higher than that of uranyl ions, the U extraction efficiency remained above 90%, while the extraction efficiencies for the interfering cations were all below 15% (Fig. S15 in Supporting information). In addition, we tested the effect of pH on the uranium extraction capacity of E-MoN in seawater with a pH range of 3–9, and the results showed that E-MoN could reach more than 70% of the theoretical extraction capacity over the entire wide pH range within 50 min, indicating that E-MoN had good selectivity and environmental stability for UO22+ (Fig. S16 in Supporting information). Comparative analysis with alternative methods further confirmed the superior uranium extraction efficiency of E-MoN/CC nanospheres (Fig. 2i and Table S2 in Supporting information).
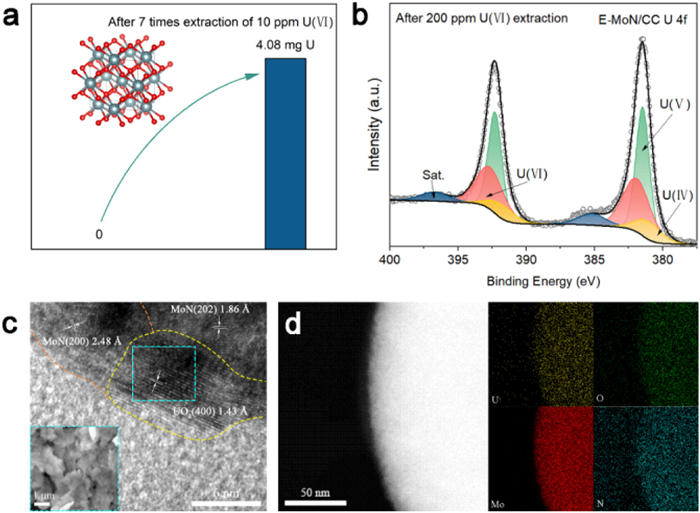
0.1 mol/L HNO3 solution was used as the eluent to desorb the extracted products and to regenerate the electrode after each extraction cycle. The uranium concentration in the eluate was measured by Inductively coupled plasma optical emission spectrometer (ICP-OES), revealing that a total of 4.08 mg of uranium was extracted after seven cycles, corresponding to an overall extraction efficiency of 97% (Fig. 3a). After electrochemical extraction, the reacted electrode was analyzed by XRD (Fig. S17 in Supporting information). In addition to the extracted UO2, impurities such as NaCl and Mg(OH)2 were detected on the electrode surface, originating from residual electrolyte components (Fig. S18 in Supporting information). SEM images reveal particle agglomeration on the otherwise smooth spherical surface, which is attributed to the deposited uranium species (Fig. 3c). Lattice fringes corresponding to UO2 were observed at the edge of the nanospheres, providing further evidence that UO2 was deposited on the MoN surface (Fig. 3c). High-resolution XPS spectra of uranium reveal that the U 4f5/2 peak splits into three distinct peaks at 392.7, 392.3, and 392.85 eV, corresponding to U(Ⅳ), U(Ⅴ), and U(Ⅵ) species, respectively (Fig. 3b) [25]. EDS mapping further confirms that uranium is uniformly distributed across the selected areas, indicating both high elemental content and homogeneous deposition (Fig. 3d). We collected the products extracted from the electrode surface under high-concentration conditions, and ICP analysis revealed a uranium purity of 71.8%. Notably, this crude product purity is substantially higher than that achieved in our previous work (32.7%) [26].
Figure 3
Figure 3.
(a) The mass of calculated U after extracting seven cycles (with loading amount of 1 mg/cm2 and 10 ppm U(Ⅵ) in real seawater and applied voltage of −0.9 V). (b) XPS of the collected solid from the solution after electrochemical extraction. (c) HRTEM and SEM images (inset) of E-MoN/CC after electrochemical extraction. (d) HAADF-STEM and corresponding elemental mapping of E-MoN/CC after electrochemical extraction.
Finally, we assessed the economic feasibility of the E-MoN-based EUE system. Energy consumption analysis indicated that the system required only 51.4 kWh/kg U in real seawater containing 10 ppm uranium, nearly an order of magnitude lower than that of conventional EUE systems (517.2 kWh/kg U). The overall cost was estimated to be approximately $5.66/kg U, including $5.255/kg U for E-MoN preparation and $0.405/kg U for electricity, based on an average industrial electricity price of $0.00788/kWh reported by the U.S. Department of Energy. This cost is substantially below both the current uranium market price ($164.68/kg U) and the cost reported for other electrochemical methods ($360/kg U) [27]. Collectively, these results highlight the remarkably low energy demand and cost-effectiveness of E-MoN-based EUE, underscoring its strong potential for practical uranium extraction.
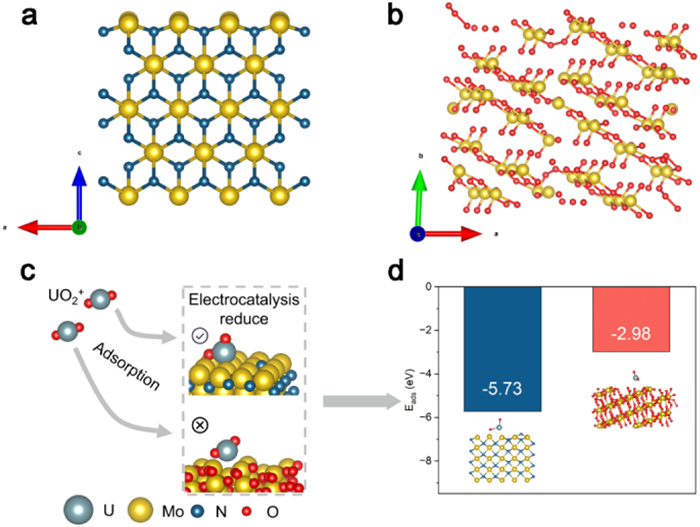
We analyzed the origin of the ultra-high extraction capacity of E-MoN/CC. For E-MoN, the etching treatment effectively removes amorphous or weakly crystalline components from the MoN precursor, while simultaneously inducing the formation of internal pores. The resulting high surface area and porous architecture shorten ion diffusion pathways, thereby enhancing charge transport efficiency and enlarging the electrochemically active surface area (ECSA) of MoN nanospheres during uranium recovery. Density functional theory (DFT) calculations were used to explore the high activity of MoN at the molecular level. The structure models of MoN and MoO3 were constructed based on previous literature as well as XRD and HRTEM results (Figs. 4a and b) [26]. After structural optimization, both adsorbed uranium models shown in Figs. 4c and d exhibited typical coordination structures involving U-O and U-N bonds, whereas the MoO3 surface displayed repulsive interactions. The adsorption energy (Eads) of UO22+ molecules on the MoN surface was 2.75 eV higher compared to the MoO3 surface. These results indicate that metal nitride electrodes offer distinct advantages in uranium extraction, primarily due to their stronger affinity for uranyl species.
Figure 4
Figure 4.
(a) E-MoN and (b) MoO3 structural model, indicated by Mo (yellow), N (blue) and O (red). (c) Adsorption model of the reaction process. (d) Adsorption energies (Eads) of UO2 species on E-MoN and MoO3.
In summary, we have demonstrated that etched MoN nanospheres, integrated on carbon cloth, serve as a robust and efficient platform for electrochemical uranium extraction from seawater. The etching process generates hierarchical porosity and enriches electroactive nitrogen sites, enabling strong UO22+ binding, rapid ion transport, and efficient electroreduction. Even in complex marine matrices, the E-MoN/CC electrode achieves complete removal of 10 ppm U(Ⅵ) within 1 h, delivering a record the maximum extraction capacity of 11,990 mg/g, surpassing most state-of-the-art adsorbents. The architecture maintains structural integrity and extraction efficiency ( > 97%) over seven continuous adsorption–desorption cycles, yielding 4.08 mg of recovered uranium. This work not only establishes E-MoN/CC as a promising candidate for scalable, green uranium recovery but also provides a generalizable design framework for electrochemical extraction materials in challenging aqueous environments.
CRediT authorship contribution statement
Pengyu Chen: Writing – original draft, Visualization, Methodology, Data curation, Conceptualization. Xiaoli Wang: Writing – original draft, Data curation. Zhaorui Zhang: Data curation. Minghui Yang: Writing – review & editing, Supervision.
Declaration of competing interest
The authors declare that they have no known competing financial interests or personal relationships that could have appeared to influence the work reported in this paper.
Acknowledgments
This work was supported by the Young Scientists Fund (Class A) of the National Natural Science Foundation of China (No. 22525102), the National Natural Science Foundation of China (No. 62471085), the Fundamental Research Funds for the Central Universities (Nos. DUT22RC(3)050, DUT24YG149, and DUT24YG109). The authors acknowledge the assistance of the DUT Instrumental Analysis Center.
Supplementary materials
Supplementary material associated with this article can be found, in the online version, at doi:10.1016/j.cclet.2025.111848.
Figure 1
(a) X-ray diffraction (XRD) patterns of MoO3/CC, MoN/CC and E-MoN/CC. High-resolution X-ray photoelectron spectroscopy (XPS) spectra of (b) Mo 3d and (c) N 1s. (d) Scanning electron microscopy (SEM) images of E-MoN/CC. (e) High-angle annular dark-field scanning transmission electron microscopy (HAADF-STEM) and corresponding elemental mapping. (f) N2 adsorption-desorption curves and pore size distribution (inset) of E-MoN/CC and MoO3/CC.
Figure 2
(a) Cyclic voltammetry (CV) measurements in simulated seawater with 10 ppm U(Ⅵ) compared to unspiked simulated seawater. (b) A comparative analysis of uranium extraction performance of MoO3/CC, MoN/CC and E-MoN/CC with loading amount of 2 mg/cm2 and 10 ppm U(Ⅵ) in real seawater and applied voltage of −0.9 V. (c) Double layer capacitance (Cdl) measurements by CV of E-MoN, MoO3 and MoN. (d) Uranium extraction performances for E-MoN/CC with loading amount of 1 mg/cm2 with 1 ppm U(Ⅵ) in real seawater and applied voltage of −0.9 V. (e) Uranium extraction performances for E-MoN/CC with loading amount of 1 mg/cm2 and 200 ppm U(Ⅵ) in real seawater and applied voltage of −0.9 V. (f) The effect of loading amount on uranium extraction performance for E-MoN/CC with 10 ppm U(Ⅵ) in real seawater and applied voltage of −0.9 V. (g) The influence of applied voltage on uranium extraction efficiency for E-MoN/CC with 10 ppm U(Ⅵ) in real seawater and loading amount of 1 mg/cm2. (h) Successive removal performance of E-MoN/CC for seven cycles with 10 ppm U(Ⅵ) in real seawater and loading amount of 1 mg/cm2 and applied voltage of −0.9 V. A total volume of 60 mL of 10 ppm uranium-spiked seawater was used for all seven cycles. (i) The comparison of the uranium extraction performance by this work with other related materials.
Figure 3
(a) The mass of calculated U after extracting seven cycles (with loading amount of 1 mg/cm2 and 10 ppm U(Ⅵ) in real seawater and applied voltage of −0.9 V). (b) XPS of the collected solid from the solution after electrochemical extraction. (c) HRTEM and SEM images (inset) of E-MoN/CC after electrochemical extraction. (d) HAADF-STEM and corresponding elemental mapping of E-MoN/CC after electrochemical extraction.
Figure 4
(a) E-MoN and (b) MoO3 structural model, indicated by Mo (yellow), N (blue) and O (red). (c) Adsorption model of the reaction process. (d) Adsorption energies (Eads) of UO2 species on E-MoN and MoO3.


 DownLoad:

 下载:


 下载:

