Citation:
Haotian Yang, Jinke Shen, Nan Qin, Yaoxin Du, Yuhan An, Chen Hu, Yifan Li, Wenlong Cai, Cunman Zhang, Zonghai Chen, Jim P. Zheng, Liming Jin. Tailoring layer-by-layer gradient porous ultra-thick electrodes via solvent-free processing method for high-areal-capacity and high-rate lithium-ion batteries[J]. Chinese Chemical Letters,
2026, 37(7): 111833.
doi:
10.1016/j.cclet.2025.111833
Tailoring layer-by-layer gradient porous ultra-thick electrodes via solvent-free processing method for high-areal-capacity and high-rate lithium-ion batteries
English
Tailoring layer-by-layer gradient porous ultra-thick electrodes via solvent-free processing method for high-areal-capacity and high-rate lithium-ion batteries
Received Date:
20 July 2025 Accepted Date:
11 September 2025 Revised Date:
03 September 2025 Available Online:
15 July 2026
Abstract:
Ultra-thick electrodes (UTEs) hold great promise for high-energy-density lithium-ion batteries (LIBs), yet the practical application is hindered by challenges in precise fabrication and reaction kinetics modification. In this contribution, a solvent-free processing method is introduced to tailor UTEs through layer-by-layer fabrication with positive, uniform, and negative gradient porosity from the separator side to the current collector side, denoted as P-UTEs, U-UTEs, and N-UTEs. In contrast to conventional slurry coating, the proposed solvent-free approach effectively circumvents capillary stress, thereby facilitating the fabrication of crack-free UTEs (> 300 µm) while simultaneously mitigating environmental toxicity concerns. The three-layer N-UTEs (> 220 µm) with a gradient porosity of (~34%, ~31%, ~27%) deliver an exceeding areal capacity over 5 mAh/cm2 at 0.29 mA/cm2 and a high-capacity retention over 62% at 2.9 mA/cm2, indicating a favorable balance between the areal capacity and the high-rate behavior. Detailed mechanistic simulations reveal that the multi-center reaction pathways enabled by enhanced ionic accessibility in N-UTEs significantly improve reaction kinetics. This work offers new insights into the gradient porosity tailoring for high-areal-capacity and high-rate UTEs for the next generation LIBs.
Lithium-ion batteries (LIBs) are widely regarded as the most promising energy storage devices due to their superior energy density and long cycle life compared to their counterparts [1-5]. Areal capacity, as well as volumetric capacity, while easily neglected, is of great importance, especially for the emerging embodied intelligence devices and low-altitude vehicles [6-8]. In short, increasing the energy density is an urgent and long-term research direction to meet the booming market demands. In terms of the structure of the LIBs, electrodes, particularly cathodes with low specific capacities, play a pivotal role in determining the energy density of LIBs [9,10]. Moreover, improving areal capacity while maintaining favorable reaction kinetics, particularly under high current densities, presents a significant challenge due to their often-conflicting nature [10,11]. Generally, enhancing areal capacity could be achieved either by developing high specific capacity active materials or by fabricating ultra-thick electrodes (UTEs), in which UTEs engineering provides the most straightforward pathway to amplify battery-level energy density through geometric amplification and are more promising while today's researches have been gradually approaching the limit of the specific capacity of active materials [12-14]. Meanwhile, enhanced ion/electron transportation and electrochemical kinetics are also essential for the fast-charging capability [15].
Traditionally, electrodes are prepared using a slurry-coating process, in which active materials, polyvinylidene fluoride (PVDF) binders, and n-methyl-2-pyrrolidone (NMP) solvents are mixed, coated onto current collectors, and subsequently dried and rolled. Despite its widespread use, this method is hindered by a thickness limitation of under 100 µm by a series of challenges, e.g., diffusion difficulties, which worsen in electrodes over ~150 µm, and critical cracking thickness (CCT), where excessive electrode thickness over ~200 µm generally leads to cracking during drying due to capillary stress [16-18]. Alternatively [19-21], a solvent-free-processing method using fibrillated polytetrafluoroethylene (PTFE) binders to create robust fiber networks has been developed to eliminate the capillary stress issue and hence break the limitation of CCT [13,22,23]. Therefore, prepared electrodes with enhanced mechanical stability allow the precise fabrication and multiscale structure tailoring of UTEs with higher areal capacities. While recent advances in solvent-free methods have successfully overcome the CCT limitation, the critical challenge of ion transport inefficiency in UTEs remains largely unaddressed. Notably, prior studies on gradient porous structures focused primarily on conventional slurry-coating electrodes, leaving a knowledge gap in understanding how such structural gradients interact with solvent-free prepared UTEs.
On the other hand, thickening electrodes inevitably introduces challenges related to ionic diffusion behavior, hence harming the kinetics as described by the limited penetration depth (LPD) equation:
where ε represents the electrode porosity, τ is the pore tortuosity, Dl is the intrinsic diffusion coefficient of the electrolyte, c0 is the initial electrolyte concentration, t+ is the transference number of Li+, I is the applied current density, and F is the Faraday constant [24]. In general, it implies that spatially varying porosity (ε) and tortuosity (τ) along the electrode thickness could locally modulate Ld values. This motivates the hypothesis that a rationally designed porosity gradient could establish depth-dependent ionic diffusion regimes, potentially extending the effective reaction zone beyond the limitations of homogeneous structures, therefore it is significant to optimize porosity and tortuosity to balance areal capacity and reaction kinetics using various approaches such as templating, magnetic field-assisted techniques, and shear force-induced alignment [25-29]. However, the fine multiscale structure (e.g., porosity and/or tortuosity variation) in electrodes, in particular UTEs, on ionic diffusion and reaction kinetics is still lacking fundamental understanding.
Herein, a series of layer-by-layer gradient porous UTEs was successfully tailored using a solvent-free-processing method, in which positive, uniform, and negative gradient porosity from the separator side to the current collector side is donated as P-UTEs, U-UTEs, and N-UTEs. N-UTEs exhibited superior electrochemical performance compared to P-UTEs and U-UTEs, showing a superior capacity retention over 62% at 2.9 mA/cm2 and reduced ionic resistance of 60 Ohm, while P-UTEs have just shown a capacity retention around 45% at 2.9 mA/cm2, and higher ionic resistance of 92 Ohm, around 50% higher than that of N-UTEs. Such advantages have been comprehensively validated by electrochemical analyses, based on which simulations further reveal the multi-center reaction mechanism, a synergistic mechanism absent in previous studies, in the N-UTEs with enhanced ionic accessibility, enabling the improved reaction kinetics, offering insights into the complex electrochemical mechanisms within UTEs [30]. The work is of great significance for the development and scalability of the solvent-free processing method for next-generation LIBs.
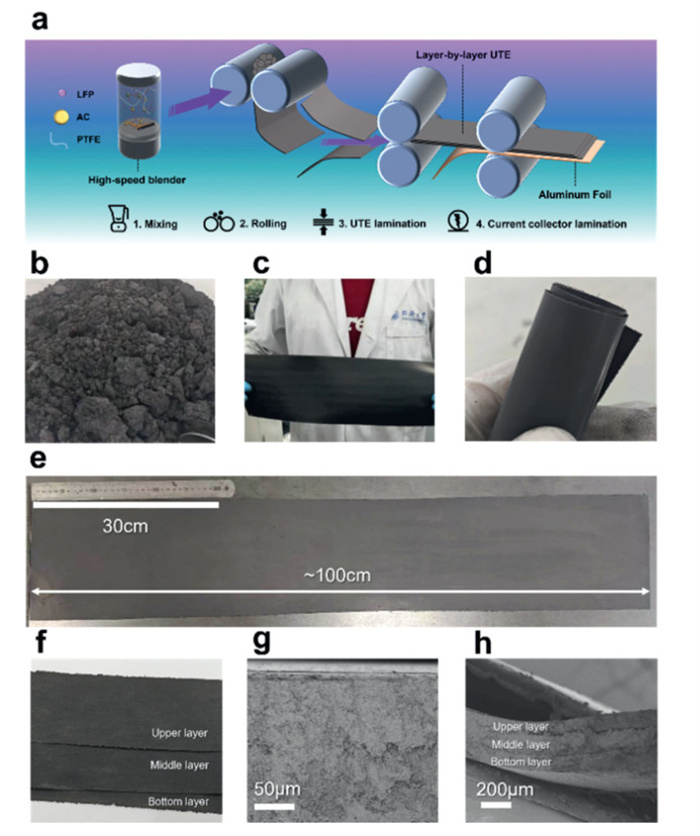
The layer-by-layer fabrication process is schematically illustrated in Fig. 1a, whose images at different scales and intermediate steps were taken and analyzed for careful evaluations, highlighting a solvent-free-processing method for UTEs. Firstly, a mixture of LiFePO4 (LFP), activated carbon (AC), and PTFE was blended at a high speed (18,000 rpm) for 3 min to make the binder fibrillated and achieve uniform powder. As shown in Fig. 1b, the resulting powder exhibits significant agglomeration following shear treatment, suggesting that fibrillation enhances the adhesion properties of the electrode material. Subsequently, the powder was then repeatedly calendared at 120 ℃ to fabricate an LFP dry electrode with a thickness of approximately 100 µm (Fig. S1 in Supporting information). The LFP dry electrode exhibits a smooth surface (Fig. 1c and Fig. S2 in Supporting information) and good flexibility (Fig. 1d and Video S1 in Supporting information), implying that the free-standing film has robust mechanical properties and a stable structure. In addition, the large-size layer-by-layer UTEs with a length of ~100 cm and an area of ~2250 cm2 were prepared (Fig. 1e and Video S2 in Supporting information), demonstrating the potential for large-scale manufacturing. Fig. 1f and Video S3 (Supporting information) further show the process of superimposing three different electrodes to form a gradient electrode, whose cross-section morphology is uniform without clear interfaces between layers (Fig. 1g). Moreover, the layer-by-layer structure could be clearly observed in the cross-sectional image at the edge of the composite electrode in Fig. 1h and Fig. S3 (Supporting information) for the inconsistency of electrode sizes in different layers at the edges. Generally, the solvent-free process enables the production of even, smooth, and flexible electrodes, demonstrating processability for high scalability and sustainability in electrode preparation. In the final hot-pressing (180 ℃) step, the electrode was mechanically pressed onto an aluminum foil. Herein, to demonstrate the effects of gradient porous structures on the electrochemical performance of UTEs, three kinds of single-layer electrodes were prepared by mixing LFP, AC, and PTFE with mass ratios of 75:12.5:12.5, 80:10:10, and 85:7.5:7.5, labeling LFP@75, LFP@80, and LFP@85, and three kinds of UTEs were then prepared via the lamination of single-layer UTEs: LFP@75- 80–85 (P-UTEs), LFP@80–80–80 (U-UTEs), and LFP@85–80–75 (N-UTEs).
Figure 1
Figure 1.
Fabrication process characterization of layer-by-layer UTEs. (a) Schematic of the layer-by-layer fabrication process. (b) Uniform powder blending state. (c) Free-standing UTE membrane after cutting. (d) Tightly wound UTE assembly. (e) Macroscopic view of layer-by-layer UTEs (2250 cm2). (f) Lamination process demonstration. (g, h) Cross-sectional SEM at central and peripheral regions.
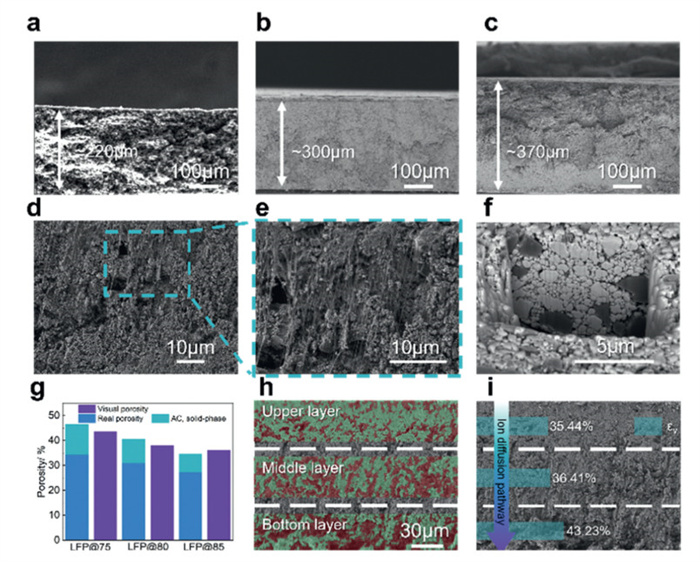
To validate the effectiveness of the manufacturing strategies described in the previous sections, the morphology and structure of the UTE cross-section were further characterized using scanning electron microscopy (SEM). Figs. 2a-c demonstrate that the solvent-free-processing method is an effective approach for fabricating UTEs capable of surpassing the CCT, which typically occurs at around 200–250 µm due to capillary stress mismatch and binder dispersion challenges in the slurry-coating process [13-15]. In contrast, the solvent-free process achieves complete and uniform cross-sections in electrodes with thicknesses exceeding 300 µm, while maintaining structural integrity and uniformity. As shown in Figs. 2d and e, the thin, long, and strongly oriented PTFE fiber networks are clearly visible, particularly in the magnified rectangular region. These fibers effectively entangle with or anchor around the LFP particles, indicating successful fibrillation of the PTFE binder during the sequential cutting and calendaring processes. This mechanical framework ensures the stability and durability of the UTEs (Figs. 1c-e and Fig. S4 in Supporting information).
Figure 2
Figure 2.
Structural characterization of ultra-thick layer-by-layer UTEs. (a-c) Thickness-dependent cross-sectional morphologies. (d, e) PTFE fiber network structure. (f) Cross-sectional image of UTE obtained by Ar-ion milling. (g) Porosity comparison: Segmentation results by Weka vs. theoretical. (h) Color segmentation results for different layers of ultra-thick layer-by-layer UTE. (i) Color-segmentation-based porosity distribution results of a layer-by-layer UTE.
Furthermore, one of the key objectives in the aforementioned fabrication process is to establish a gradient pore structure, which is a critical factor in determining ionic diffusion efficiency and overall electrode performance. However, traditional methods for porosity analysis, such as mercury intrusion porosimetry, which introduces pressed mercury, or Brunauer–Emmett–Teller (BET) measurements, whose tested targets are usually mesopores (pores with diameter of 2–50 nm) and micropores (pores with diameter of < 2 nm), failing to capture the layer-dependent porosity variations present in our UTEs for larger pore sizes (Fig. S5 in Supporting information) [31,32]. To address these limitations, a segmentation-based approach is introduced based on the color difference of different materials revealed in FIB-SEM images (Fig. 2f and Fig. S6 in Supporting information). Weka Segmentation (Weka), a plugin in commercial software ImageJ, is introduced to quantify the porosity variation precisely. The pores inside the electrode are composed of two parts: gap pores between different material particles and inner pores of porous AC. When labeling the dataset, these pores were categorized as Class 1, while the remaining LFP particles were classified as Class 2. Weka trained the model to classify them automatically. Fig. S7 (Supporting information) illustrates the cross-sectional SEM images, segmentation results, and processed graphics for LFP@75, LFP@80, and LFP@85 electrodes, with calculated porosities of 43.65%, 37.88%, and 36.12%, respectively. The Weka results were further validated against theoretical calculations to ensure accuracy. Real porosity (excluding solid-phase volume of AC particles) and visual porosity (including AC particles as pores) were derived using the following equations:
where εr, εAC, and εv represent the real porosity, AC porosity, and visual porosity, respectively. The parameters mp and Vp are the mass and visual volume of the UTEs, while ηLFP, ηAC, ρLFP, and ρAC correspond to the mass fraction and compacted density of LFP and AC, respectively, and the detailed material properties are summarized in Table S1 (Supporting information). The theoretical porosities of LFP@75, LFP@80, and LFP@85 were calculated as 34.45%, 30.86%, and 27.28%, respectively (Table S2 in Supporting information), after which the comparison between theoretical and segmentation-based porosity results are shown in Fig. 2g. The theoretical calculations align closely with the visual porosity results identified by Weka, with respective errors of 8.3%, 8.5%, and 5.9%. These results confirm the reliability and accuracy of the Weka-based analysis. Further cross-sectional SEM analysis and processing of gradient porous UTEs (Figs. 2h and i, Fig. S10 in Supporting information) reveal porosities of 35.44%, 36.41%, and 43.23% in different layers, demonstrating a precisely controlled gradient that surpasses the random porosity variations observed in conventional electrodes. Moreover, these values are in quantitative agreement with those of the corresponding single-layer electrodes, confirming the fidelity of porosity estimation across interfaces. Thus, the consistent correlation between theoretical and segmentation-based porosity values strongly supports the successful creation of a gradient pore structure within the UTEs. Additionally, pore diameter distribution is also analyzed using mercury intrusion porosimetry, which lacks reliability for pores over 1 µm, as shown in Fig. S11 (Supporting information), in which LFP@75 displays more micropores for more AC, aligning with the expectation. Such a structure establishes a hierarchy of ionic diffusion pathways, which significantly enhances ion transport and decreases polarization resistance inside the UTEs. This structural optimization contributes to the superior electrochemical performance observed in UTEs, highlighting the efficacy of the proposed manufacturing strategy.
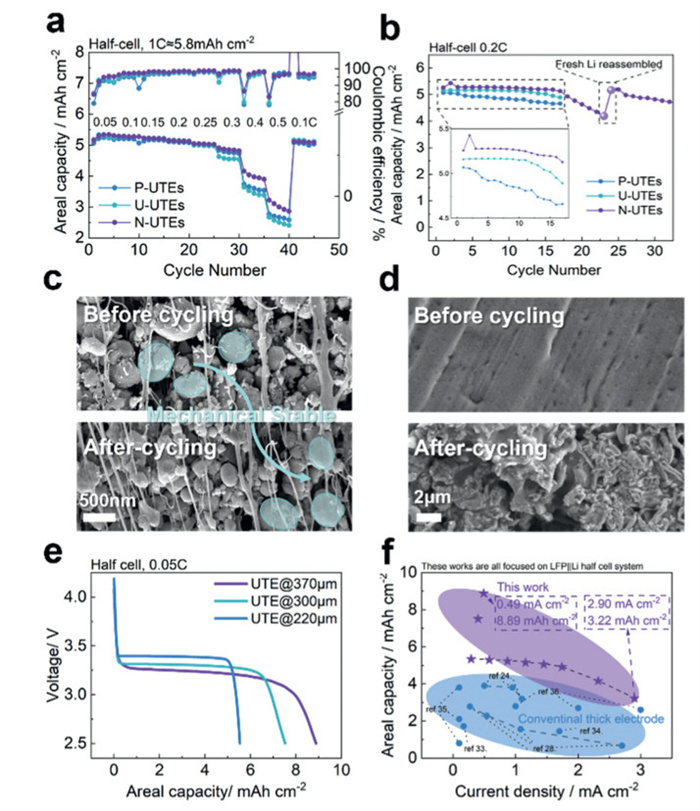
Various electrochemical tests were performed on UTE||lithium half cells to systematically evaluate the kinetics of P-UTEs, U-UTEs, and N-UTEs, based on the fabricated gradient porous structures. As shown in Fig. 3a, while different UTEs exhibit minimal differences in areal capacity at rates below 0.25 C, N-UTEs achieve 6.19%/1.82%, 13.92%/9.94%, and 17.28%/12.94% higher areal capacities than P-UTEs and U-UTEs at rates of 0.3, 0.4, and 0.5 C, respectively. This indicates that the gradient porous structure in N-UTEs provides efficient ion transport pathways, enabling higher reaction depth, especially under high-rate conditions, compared to other UTEs. Furthermore, cells with N-UTEs demonstrate better stability and slightly higher capacity during cycling compared to P-UTEs and U-UTEs, suggesting that N-UTEs effectively mitigate the formation of inactive lithium by promoting diffusion of Li+ and their embedding and de-embedding on the surface of LFP particles (Fig. 3b). Hereafter, a series of experiments to investigate failure mechanisms during electrochemical cycling was systematically conducted. Cross-sectional SEM analysis of UTEs before and after cycling revealed that there was no clear particle dilatation exhibited in active materials (Fig. 3c and Fig. S9 in Supporting information), eliminating UTEs as the primary failure origin. To elucidate lithium metal counter electrode degradation, fresh lithium metal foils were reassembled into coin cells with degraded capacity for continued cycling tests under identical protocols. Post-mortem analysis demonstrated that the reassembled cells achieved a capacity recovery to 97.8% (Fig. 3b), concomitant with extensive dendritic lithium formation, oxide and electrolyte deposition variation observed via SEM and corresponding energy-dispersive X-ray spectroscopy (EDS) mapping images in Fig. 3d, Figs. S10 and S12 (Supporting information). Moreover, cracks have appeared on the lithium plates after cycling, indicating a possible mechanical failure (Fig. S13 in Supporting information). These observations demonstrate that lithium metal counter electrode deterioration, rather than UTE structural instability, governs cell failure. Also, EDS mapping images of cycled UTE are analyzed (Fig. S14 in Supporting information), further confirming the stability of UTE. This finding underscores the critical need for advanced cathode engineering in UTE battery systems.
Figure 3
Figure 3.
Electrochemical performance of P-UTEs, U-UTEs, and N-UTEs. (a) Rate capability of half-cells with different types of UTEs. (b) Cycle stability of half-cells with different types of UTEs. (c) Cross-sectional SEM evolution before and after cycling, also highlighting the mechanical stability of LFP particles. (d) Lithium foil surface morphology evolution before and after cycling. (e) Discharge potential profiles of half-cells with different types of UTEs. (f) Literature summary of thick electrodes by cathode areal capacity and applied current density.
Subsequently, thicker samples were tested to evaluate performance trends and compared with cathodes from previous studies. As shown in Fig. 3e, increasing electrode thickness from 220 µm to 300 and 370 µm improves discharge areal capacity by approximately 36% and 61%, while the discharge platform decreases slightly from ~3.39 V to ~3.30 and ~3.25 V, achieving an ultra-high areal capacity of 7.52 mAh/cm2 and 8.89 mAh/cm2. Additionally, a simple summary of current research focused on thick electrodes is shown in Fig. 3f and Table S3 (Supporting information), in which a significant increase in areal capacity under roughly similar current density could be observed, highlighting the superiority of our work [24,28,33-36].
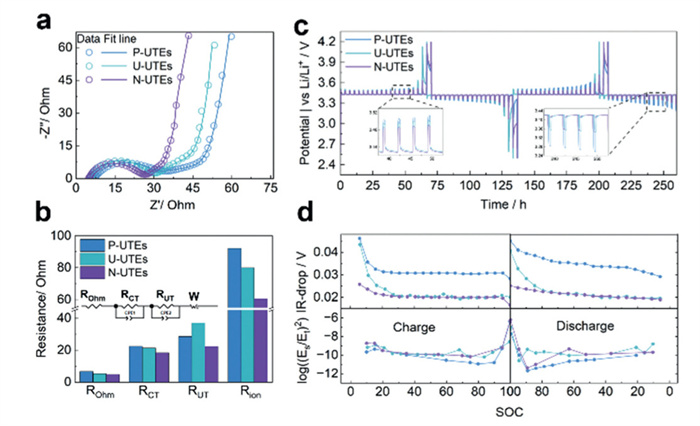
Based on these observations, EIS data were fitted to equivalent circuits and analyzed to decouple and quantify various electrochemical processes (Figs. 4a and b) in which symmetric cells assembled by DPEs at 0%SOC (state of charging) were utilized to eliminate the influence of commonly used lithium counter electrodes [37,38]. According to Ogihara et al., the equivalent circuit for thick electrodes generally consists of three components: a high-frequency pure resistance identified as contact resistance (ROhm), followed by a semicircle corresponding to charge transfer resistance (RCT), and a slope associated with solid-phase diffusion (W) [38-41]. The ion resistance (Rion) and tortuosity of the electrode are calculated using the following equations:
$
\tau=\frac{R_{\text {ion }} A k \varepsilon}{2 d}
$
(5)
Figure 4
Figure 4.
Electrochemical kinetics' characterization of P-UTEs, U-UTEs, and N-UTEs. (a, b) EIS results from symmetric cell tests and corresponding resistances. (c, d) GITT-based diffusion kinetics analysis corresponding to ion-diffusion properties and IR-Drops.
where A, k, and d are the UTE surface area, electrolyte ionic conductivity, and UTE thickness, respectively [37,41]. All of the above fitted or calculated data are summarized in Table S4 (Supporting information). However, Ogihara's research primarily focuses on electrodes with thicknesses below 100 µm. For electrodes exceeding 200 µm, an additional slope has been observed in many of the recent research between the semicircle and the diffusion slope [24,42-45]. This slope, designated as RUT, is incorporated into the equivalent circuit to account for the unique behavior of ultra-thick electrodes. The N-UTEs exhibit a ROhm that is 1.86 and 0.45 Ohm lower than that of P-UTEs and U-UTEs, respectively. Additionally, the RCT of N-UTEs is 4.09, 3.03 Ohm lower compared to the other UTEs, indicating superior kinetics and higher capacities under high-rate conditions attributed to the reverse gradient structure. Lower Rion and τ are hence calculated as shown in Fig. 4b and Table S4, implying such directional porosity modulation effectively reduces the ionic resistance and real diffusion path length (Lreal) as defined by the equation:
$
L_{\text {real }}=\tau \mathrm{L}
$
(6)
where L is the electrode thickness. The N-UTE configuration achieves 24.5% and 34.4% lower Lreal compared to U-UTE and P-UTE, indicating simplified diffusion processes. The lower RUT observed in N-UTEs further suggests that this structure reduces the additional impedance caused by excessive electrode thickness. Additionally, as shown in Figs. 4c and d, galvanostatic intermittent titration technique (GITT) results confirm that N-UTEs exhibit higher capacities, higher diffusion coefficient, and lower internal resistance during charging and discharging. The above results answer how the rating performance was benefitted from negative gradient porous structure, while statement from distribution of relaxation times test (DRT) (Fig. S15 in Supporting information), further confirms that negative gradient porous structure could enables more uniform growth of lithium dendrites on the counter electrode, which in turn reduces impedance, thus enhancing the cycling stability [46-50]. The correspondence between morphological observations and electrochemical performance highlights the synergistic effect of the negative gradient structure, leading to reduced polarization, improved diffusion properties, and faster reaction kinetics.
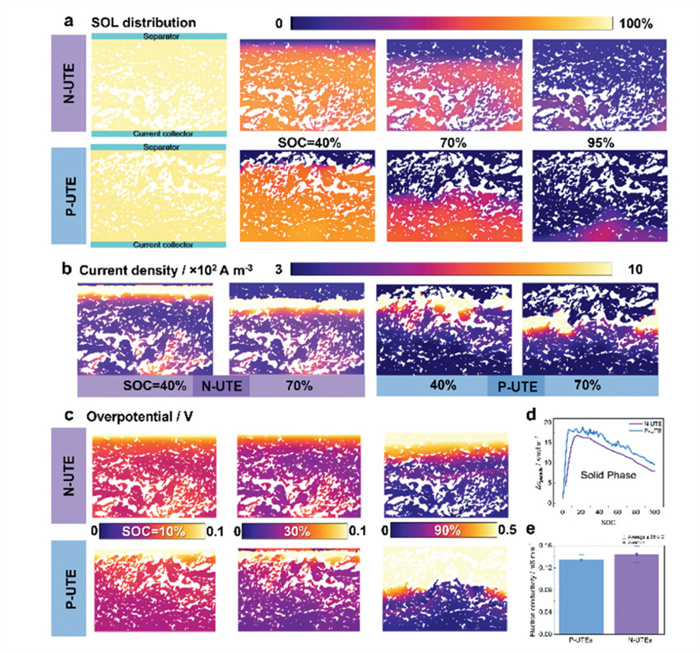
To investigate the electrochemical processes within the electrode, an ion-transportation model inside the UTEs was developed. The geometries of the model were reconstructed from the actual SEM images of an N-UTE using Weka (Fig. S8 in Supporting information). For the P-UTE, the geometry was flipped upside down to minimize structural inconsistencies and their potential impact on the simulation results. To simplify the calculation, the active material domain computational framework adopts a homogenization approach wherein the active particle ensemble is modeled as a continuum porous medium with uniform pore distribution [51]. Besides, a constant current was applied at the current collector side with some parameters (Table S5 in Supporting information). The lower side of the model was shown in Fig. 5a and Video S4 (Supporting information), with the opposite side corresponding to the separator domain and a simplified one-dimensional lithium metal counter electrode to elucidate the ionic diffusion process. Initially, Li+ were uniformly distributed throughout the electrode with a starting SOC of 5%. As illustrated in Fig. 5a, the N-UTE exhibits a more uniform SOL distribution during charging, indicating a more homogeneous Li+ deintercalation reaction from LFP as quantified by lower Δcperticle (maximum minus minimum embedded Li+ concentration difference) compared to P-UTE in Fig. 5d. This homogeneity stems from the N-UTE's collector-side porosity gradient, which establishes spatially distributed reaction zones and provides additional electrochemical reaction sites and facilitates ionic diffusion. Such a phenomenon is named a "multi-center electrode reaction mechanism" compared to that of P-UTE, highlighting concurrent activation of separator-side and collector-side reaction fronts. The current density distribution shown in Fig. 5b and the power density distribution (Fig. S16 in Supporting information) corroborates this finding: The pores at the bottom of the N-UTE not only offer additional reaction sites but also contribute to a uniform reaction across the thicker electrode by complementing the electrode reaction centers that migrate from the separator side to the collector side during charging. Consequently, polarization is reduced.
Figure 5
Figure 5.
UTE kinetics simulation results of N-UTE and P-UTE. (a) Schematic of the electrochemical model simulated and the state of lithiation (SOL) distributions in the localized N-UTE and P-UTE during charging. (b) Current density field distribution in the UTEs during charging. (c) Overpotential distribution in the UTEs during charging. (d) The maximum minus minimum embedded Li+ concentration difference in the whole UTE during charging. (e) Electron conductivity statistical distribution comparison of P-UTEs and N-UTEs.
Hereafter, phase-resolved overpotential analysis delineates three regimes (Fig. 5c): (1) Initial stage: Comparable overpotentials could be observed due to surface-dominated reactions, which is manifested as no significant overpotential gap could be observed at 10% SOC; (2) Mid-stage: P-UTE temporarily benefits from better diffusion via higher separator-side porosity, showing slightly lower overpotential compared to N-UTE (30% SOC); (3) Advanced stage: N-UTE's gradient-induced multi-center mechanism dominates, achieving much lower overpotential especially in the later stages of the reaction (90% SOC). The above mechanistic alignment is quantitatively corroborated by EIS analysis (Figs. 4a and b) and electron conductivity characterization, where N-UTEs demonstrated 34.8% lower ionic resistance and 7.4% higher electron conductivity (Fig. 5e) compared to P-UTEs. Given to enhanced ionic transport networks are critical for high C-rate performance, this fundamental agreement validates our modeling and directly accounts for the observed 18.82% improvement in rate capability (Fig. 3a). In summary, the combined simulation-experimental validation confirms that gradient porosity engineering effectively decouples UTE challenges through spatially optimized reaction kinetics, serving as indirect quantitative indicators linking porosity heterogeneity to electrochemical behavior combined with the gradient porous structure characterization.
In conclusion, gradient porous ultra-thick electrodes have been successfully prepared using a solvent-free method, showcasing precise control over the electrode pore structure through layer-by-layer tailoring. Notably, the gradient structure of N-UTEs demonstrates superior electrochemical performance, particularly in achieving high areal capacity and fast kinetics under high-rate conditions (at most 17.28%/12.94% higher areal capacities than P-UTEs and U-UTEs at 0.5 C). Such advantages in performance could be attributed to the higher porosity near the current collector side of the UTEs, which provides additional reaction sites and supports a multi-center electrode reaction mechanism, therefore decreasing internal polarization and resistance. Furthermore, detailed reaction pathway and the relation between porous structure and reaction kinetics are thoroughly quantified through phase-resolved overpotential analysis and conductivity validation. Hence, theoretical yield hierarchy in layered optimization validates electrode utilization. The research provides valuable insights into the advanced design and investigation of UTE kinetics.
Declaration of competing interest
The authors declare that they have no known competing financial interests or personal relationships that could have appeared to influence the work reported in this paper.
The work was sponsored by the financial support from the National Natural Science Foundation of China (No. 52307249), National Science Foundation of Shanghai Province (No. 23ZR1465900), Chenguang Program of Shanghai Education Development Foundation and Shanghai Municipal Education Commission (No. 23CGA25), Fundamental Research Funds for the Central Universities at Tongji University, Students Innovation Training Program of Tongji University (No. 202410247028).
Supplementary materials
Supplementary material associated with this article can be found, in the online version, at doi:10.1016/j.cclet.2025.111833.
[1]
J.B. Goodenough, Energy Environ. Sci. 7 (2014) 14–18. doi: 10.1039/C3EE42613K
[2]
F. Bonaccorso, L. Colombo, G. Yu, et al., Science 347 (2015) 1246501. doi: 10.1126/science.1246501
Figure 1
Fabrication process characterization of layer-by-layer UTEs. (a) Schematic of the layer-by-layer fabrication process. (b) Uniform powder blending state. (c) Free-standing UTE membrane after cutting. (d) Tightly wound UTE assembly. (e) Macroscopic view of layer-by-layer UTEs (2250 cm2). (f) Lamination process demonstration. (g, h) Cross-sectional SEM at central and peripheral regions.
Figure 2
Structural characterization of ultra-thick layer-by-layer UTEs. (a-c) Thickness-dependent cross-sectional morphologies. (d, e) PTFE fiber network structure. (f) Cross-sectional image of UTE obtained by Ar-ion milling. (g) Porosity comparison: Segmentation results by Weka vs. theoretical. (h) Color segmentation results for different layers of ultra-thick layer-by-layer UTE. (i) Color-segmentation-based porosity distribution results of a layer-by-layer UTE.
Figure 3
Electrochemical performance of P-UTEs, U-UTEs, and N-UTEs. (a) Rate capability of half-cells with different types of UTEs. (b) Cycle stability of half-cells with different types of UTEs. (c) Cross-sectional SEM evolution before and after cycling, also highlighting the mechanical stability of LFP particles. (d) Lithium foil surface morphology evolution before and after cycling. (e) Discharge potential profiles of half-cells with different types of UTEs. (f) Literature summary of thick electrodes by cathode areal capacity and applied current density.
Figure 4
Electrochemical kinetics' characterization of P-UTEs, U-UTEs, and N-UTEs. (a, b) EIS results from symmetric cell tests and corresponding resistances. (c, d) GITT-based diffusion kinetics analysis corresponding to ion-diffusion properties and IR-Drops.
Figure 5
UTE kinetics simulation results of N-UTE and P-UTE. (a) Schematic of the electrochemical model simulated and the state of lithiation (SOL) distributions in the localized N-UTE and P-UTE during charging. (b) Current density field distribution in the UTEs during charging. (c) Overpotential distribution in the UTEs during charging. (d) The maximum minus minimum embedded Li+ concentration difference in the whole UTE during charging. (e) Electron conductivity statistical distribution comparison of P-UTEs and N-UTEs.

 DownLoad:

 下载:
下载:


 下载:
下载:
