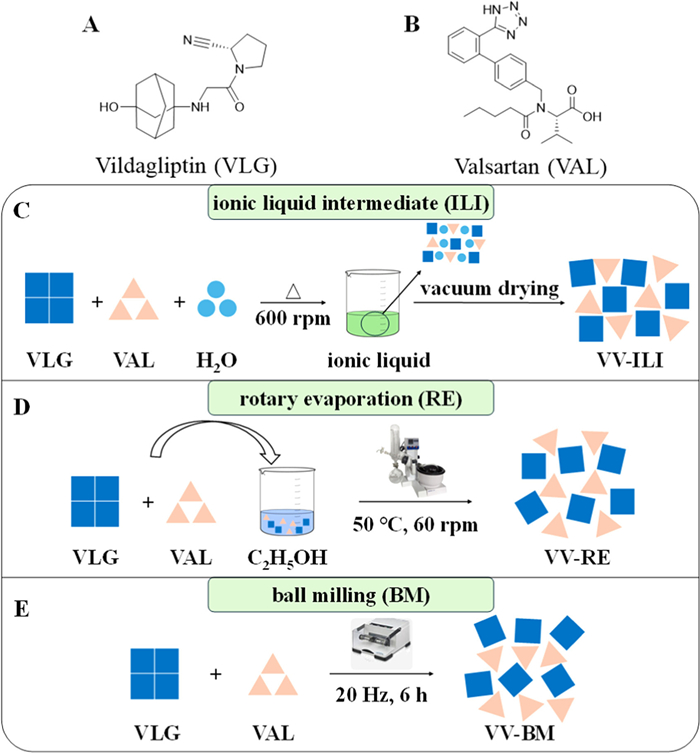
Figure 1.
Chemical structure of (A) vildagliptin and (B) valsartan, and the preparation diagrammatic sketch for (C) VV-ILI, (D) VV-RE, and (E) VV-BM.

Co-amorphization via ionic liquid intermediate: A novel strategy for polyamorphism discovery and property optimization
Xia-Lin Dai , Shuang-Shuang Wang , Ling Yang , Jia-Miao Hao , Wei Gao , Tong-Bu Lu , Jia-Mei Chen


Over 40% of marketed drugs and 90% of candidate drugs suffer from poor solubility [1-3]. Amorphization is a well-established strategy to enhance solubility and dissolution; however, the inherent thermodynamic instability of pure amorphous drugs often limits their practical application [4-7]. Co-amorphous drug delivery systems (CAMS) are single-phase amorphous systems formed by drugs with small-molecule excipients or other active ingredients [8]. Compared to single-component amorphous systems, CAMS offer significant advantages in stabilizing amorphous phase, improving dissolution and bioavailability, and enabling molecular-level combination therapy, highlighting their substantial potential for pharmaceutical applications [9-13].
Common preparation techniques of CAMS face inherent limitations. Solution-based methods, such as rotary evaporation, typically require organic solvents, posing environmental and safety concerns and often leading to solvate formation or selective crystallization [14]. Solid-state methods like melt-quenching and ball milling offer greener alternatives, but melt-quenching requires well-defined melting points and is unsuitable for thermolabile drugs [15]. Ball milling is time-consuming and energy-intensive, with prolonged high-energy input potentially damaging drug structures [16]. Moreover, different preparation methods may result in distinct local ordered structures in the amorphous state, inducing CAMS polyamorphism and significantly impacting their physicochemical properties and efficacy [17]. Therefore, developing novel, green, and efficient CAMS preparation methods is crucial for expanding their applications and optimizing their performance.
Here, we introduce a novel ionic liquid intermediate (ILI) co-amorphization strategy. Ionic liquids (ILs) are room-temperature molten salts composed entirely of anions and cations. Their designability and green properties have positioned them as promising novel functional materials and media [18-20]. The ILI method uses trace water to form an IL intermediate of two components via mild heating (well below component melting points), which is miscible at the molecular level. Upon water removal by drying, the IL structure disintegrates, and the two components can neither form a cocrystal via cocrystallization nor crystallize individually, instead, they form a co-amorphous system. Compared to common methods, ILI operates under milder conditions without melting point constraint, eliminating organic solvents and high-energy input, offering a mild, green, and energy-efficient approach for CAMS synthesis.
The ILI method was employed to synthesize CAMS of the antidiabetic drug vildagliptin (VLG, Fig. 1A) and antihypertensive drug valsartan (VAL, Fig. 1B). For comparison, CAMS with identical compositions were prepared by rotary evaporation (RE) and ball milling (BM), as melt-quenching failed due to component degradation. Studies have demonstrated that combining VLG and VAL exhibits synergistic protective effects against diabetic nephropathy, but their disparate solubilities hinder combination formulation development [21,22]. The VLG-VAL CAMS is expected to enable molecular-level combination therapy, enhancing formulation uniformity and reproducibility. It also shows potential to slow VLG dissolution for extended action while improving the dissolution rate of VAL, thus improving the formulation compatibility between the two drugs.
As shown in Fig. 1, CAMS preparation by ILI involved adding equimolar VLG and VAL to trace water (VLG:VAL, 1:1) and stirring at 80 ℃ until a transparent IL formed. The liquid was cooled to room temperature (remaining liquid) and vacuum-dried to yield the co-amorphous product (VV-ILI). For RE, equimolar VLG and VAL were dissolved in ethanol, rotary-evaporated at 50 ℃ under reduced pressure, and the resulting solids were vacuum-dried (VV-RE). For BM preparation, equimolar quantities of VLG and VAL were ground in a ball mill operating at 20 Hz for 6 h to yield VV-BM.
Comprehensive solid-state characterization was conducted to identify amorphous polymorphs. Powder X-ray diffraction (PXRD) patterns of VV-ILI, VV-RE and VV-BM exhibited characteristic amorphous halos, confirming amorphous phase formation (Fig. 2A). Polarized light microscopy (PLM) revealed all co-amorphous samples lacked birefringence, further confirming their amorphous state (Fig. S1 in Supporting information). Proton nuclear magnetic resonance (1H NMR) analysis confirmed a 1:1 stoichiometric ratio of VLG to VAL in all co-amorphous samples via integration of characteristic proton signals, without significant impurity peaks (Fig. S2 in Supporting information).
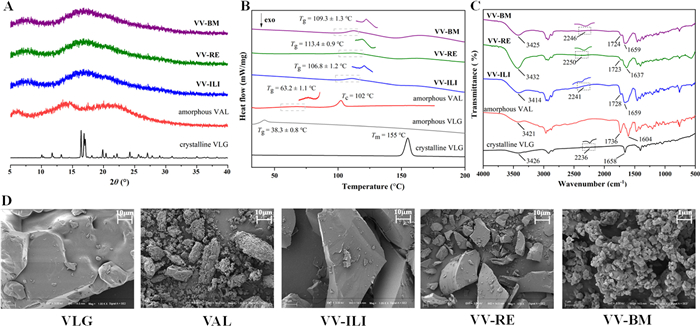
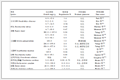
Thermogravimetric analysis (TG) showed no weight loss before decomposition (190 ℃) for all CAMS, indicating the absence of residual water or solvent (Fig. S3 in Supporting information). Differential scanning calorimetry (DSC) revealed single and different glass transition temperatures (Tg) for VV-ILI (106.8 ± 1.2 ℃), VV-RE (113.4 ± 0.9 ℃), and VV-BM (109.3 ± 1.3 ℃). These values differed significantly from those of amorphous VLG (38.3 ± 0.8 ℃) and amorphous VAL (63.2 ± 1.1 ℃), confirming the formation of homogeneous co-amorphous systems (Fig. 2B). Among them, VV-ILI exhibited the lowest Tg, suggesting relatively poorer thermodynamic stability. The theoretical Tg calculated using the Gordon-Taylor equation (52.9 ℃) was markedly lower than the experimental values (Table 1). This significant deviation indicates intermolecular interactions between VLG and VAL in the co-amorphous systems.
 DownLoad:
CSV
| Sample | Molar ratio | Weight ratio | Experimental Tg (℃) | Calculated Tg (℃) |
| VLG | – | – | 38.3 ± 0.8 | N/A |
| VAL | – | – | 63.2 ± 1.1 | N/A |
| VV-ILI | 1:1 | 0.7:1 | 106.8 ± 1.2 | 52.9 |
| VV-RE | 1:1 | 0.7:1 | 113.4 ± 0.9 | 52.9 |
| VV-BM | 1:1 | 0.7:1 | 109.3 ± 1.3 | 52.9 |
This observation aligns with the Fourier transform infrared (FT-IR) spectroscopy results (Fig. 2C). Hydrogen bonds formation in CAMS could induce characteristic peak shifts. VLG exhibited characteristic peaks at 3426 cm-1 (O—H/N—H), 2236 cm-1 (C≡N) and 1658 cm-1 (C═O), whereas amorphous VAL showed peaks at 3421 cm-1 (N—H), 1736 cm-1 (carboxylic acid C═O) and 1604 cm-1 (amide C═O). In VV-ILI, the stretching vibrations of O—H/N—H in VLG and N—H in VAL red-shift to 3414 cm-1; the C≡N stretching vibration in VLG blue-shifts to 2241 cm-1; the carboxylic C═O stretching vibration in VAL red-shifts to 1728 cm-1, and its amide C═O blue-shifts to 1659 cm-1, indicating hydrogen bonds formation among these groups. By comparison, VV-RE involved hydrogen bonding of the above groups along with the amide C═O of VLG, while VV-BM only engaged C≡N of VLG and carboxylic/amide C═O of VAL. The distinct peak shift patterns observed for CAMS prepared by different methods reflect variations in their hydrogen bonding modes. Combined with the different Tg values, these findings indicate that the three CAMS represent distinct co-amorphous polyamorphs.
Molecular electrostatic potential (MEP) calculations were performed to identify potential hydrogen bonding sites of VLG and VAL. As shown in Fig. 3, the C≡N of VLG exhibits the most negative potential (Epmin = −39.49 kcal/mol), followed by C═O group (Epmin = −38.45 kcal/mol), while its O—H shows the most positive potential (Epmax = 39.42 kcal/mol). In VAL, the amide C═O had the most negative Epmin (−41.53 kcal/mol), followed by carboxyl C═O (−33.10 kcal/mol), and N—H showed the highest Epmax (59.51 kcal/mol), followed by carboxylic acid O—H (45.33 kcal/mol). This electrostatic potential distribution suggests hydrogen bonds may form between the C≡N/C═O groups (acceptors) and O—H (donor) of VLG, and C═O (acceptor) and N—H/O—H groups (donors) of VAL.
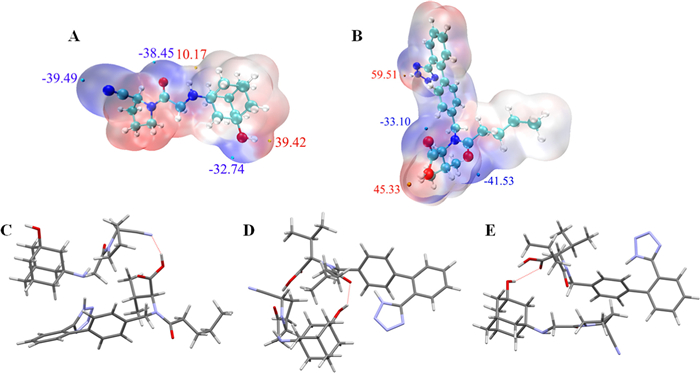
The Artificial Bee Colony (ABC) algorithm was subsequently employed to search for low-energy stable molecular clusters of VLG and VAL, which can simulate possible molecular binding patterns in CAMS. The top three types of molecular binding patterns among the top 10 clusters are illustrated in Fig. 3. Ordered by stability, the possible binding patterns involve the C≡N group of VLG connected with carboxylic O—H of VAL (O—H···N), the O—H of VLG bonded to amide C═O of VAL (O—H···O), and the O—H of VLG linked to the carboxylic C═O of VAL (O—H···O). The hydrogen bonding modes predicted by both MEP analysis and ABC algorithm simulations further corroborated the FT-IR results. Although these predicted low-energy binding motifs do not directly map to specific co-amorphous forms, they provide valuable theoretical insights into potential microstructural arrangements within the CAMS.
The preparation method directly affects the morphology of amorphous systems, thereby impacting their physicochemical properties. As shown in Fig. 2D, scanning electron microscopy (SEM) revealed that crystalline VLG exhibited irregular rough blocks, while amorphous VAL displayed an irregular porous chain-like appearance. The co-amorphous samples exhibited markedly different morphologies dependent on the preparation method. VV-ILI and VV-RE appeared as smooth-surfaced and fluffy blocks, with VV-ILI displaying greater size. In contrast, VV-BM had smaller, rough-surfaced particles with a hard texture. These morphological differences are consistent with the preparation mechanisms. Both ILI and RE involve a bottom-up formation process from a liquid phase, favoring the development of larger, smoother-surfaced particles. Conversely, BM is a top-down process involving mechanical disruption of the starting crystalline materials, resulting in smaller and rougher-surfaced particles. This indicates that the preparation method significantly modulates the morphology of co-amorphous systems, potentially affecting their physicochemical properties.
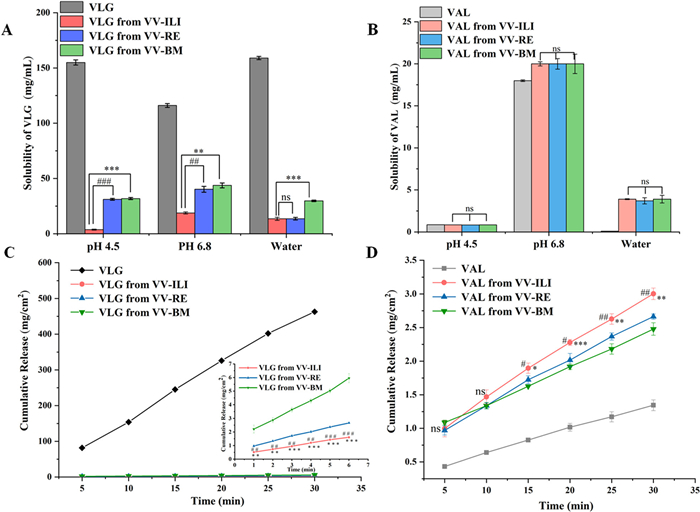
Solubility and dissolution behavior are critical for drug absorption. Equilibrium solubilities of individual components in the co-amorphous systems were measured in pH 4.5/6.8 buffers and water, compared with commercial crystalline VLG and amorphous VAL (Figs. 4A and B). As shown in Table 2, VLG showed solubilities of 155.0 ± 2.31 mg/mL (pH 4.5), 116.0 ± 1.75 mg/mL (pH 6.8), and 159.0 ± 1.44 mg/mL (water), while all co-amorphous systems significantly decreased the solubility of VLG across all media following the order: VLG > VV-BM > VV-RE > VV-ILI. Compared to pure VLG, the solubility of VLG in VV-BM, VV-RE, and VV-ILI decreased to 20.5%, 20.1%, and 2.4% in pH 4.5 buffer; 37.7%, 34.7%, and 16.2% in pH 6.8 buffer; and 18.7%, 8.6%, and 8.5% in water, respectively. Meanwhile, amorphous VAL exhibited solubilities of 0.86 ± 0.001, 18.00 ± 0.10, and 0.09 ± 0.001 mg/mL in pH 4.5, 6.8 and pure water. Co-amorphous systems enhanced VAL solubility in water by 43-fold for VV-BM and VV-ILI, and 41-fold for VV-RE, respectively, with minimal change in buffers. Statistical significance of differences was assessed using an independent samples t-test. The solubility of VLG in VV-ILI exhibited highly or extremely significant differences from that in VV-RE and VV-BM across all media, except for no difference between VV-ILI and VV-RE in pure water. VAL in VV-ILI showed no significant differences from that in VV-RE and VV-BM in any medium.
 DownLoad:
CSV
| Sample | Equilibrium solubility (mg/mL) | IDR (mg cm-2 min-1) | |||
| pH 4.5 | pH 6.8 | Water | Water | ||
| VLG | 155.0 ± 2.31 | 116.0 ± 1.75 | 159.0 ± 1.44 | 15.61 | |
| VV-ILI (VLG) | 3.7 ± 0.47 | 18.8 ± 0.93 | 13.5 ± 1.40 | 0.04 | |
| VV-RE (VLG) | 31.1 ± 0.85 | 40.2 ± 2.63 | 13.6 ± 1.20 | 0.07 | |
| VV-BM (VLG) | 31.8 ± 0.93 | 43.7 ± 2.20 | 29.7 ± 0.68 | 0.15 | |
| VAL | 0.86 ± 0.001 | 18.00 ± 0.10 | 0.09 ± 0.001 | 0.04 | |
| VV-ILI (VAL) | 0.84 ± 0.002 | 20.00 ± 0.25 | 3.90 ± 0.060 | 0.08 | |
| VV-RE (VAL) | 0.83 ± 0.001 | 20.00 ± 0.63 | 3.70 ± 0.370 | 0.07 | |
| VV-BM (VAL) | 0.84 ± 0.002 | 20.00 ± 1.15 | 3.90 ± 0.450 | 0.06 | |
These results demonstrate that CAMS can simultaneously and significantly modulate the equilibrium solubility of both VLG and VAL. Notably, the CAMS prepared by the ILI method exhibited the most pronounced modulation, for example, the greatest reduction in VLG equilibrium solubility in buffer solutions, which is likely attributed to its relatively poorer thermodynamic stability. The solubility modulation may be due to the fact that the solubility of each component in CAMS is related to the system’s overall hydrophilicity. Hydrophilic VLG and hydrophobic VAL form a homogeneous CAMS system through intermolecular interactions, making the solubility of the two components in the CAMS affect each other. In other words, compared to pure drugs, VLG shows reduced hydrophilicity due to its intermolecular binding to hydrophobic VAL in both the CAMS and supersaturated solutions, decreasing its solubility. Similarly, VAL in the CAMS exhibits enhanced hydrophilicity by binding to hydrophilic VLG, ultimately increasing its solubility.
Intrinsic dissolution rates (IDR) were measured in pure water, with IDR curves showing good linearity (R2 > 0.99) (Figs. 4C and D). As shown in Table 2, pure VLG showed an IDR of 15.61 mg cm-2 min-1, while amorphous VAL had an IDR of 0.04 mg cm-2 min-1. The IDR of VLG from CAMS was 0.15, 0.07, and 0.04 mg cm-2 min-1 for VV-BM, VV-RE and VV-ILI, showing a significant decrease in dissolution rate compared to crystalline VLG. For VAL in CAMS, the IDR values were 0.06, 0.07, and 0.08 mg cm-2 min-1 in VV-BM, VV-RE and VV-ILI, approximately 1.5, 1.8, and 2.0-folds higher than amorphous VAL, respectively. The IDR of VLG in VV-ILI displayed highly or extremely significant differences from that in VV-RE and VV-BM at all time points. After 15 min, VAL in VV-ILI also showed significant differences (even greater significance) from that in VV-RE and VV-BM. The IDR trends observed in water for all co-amorphous systems were consistent with their respective equilibrium solubility results, highlighting the ability of CAMS, especially those prepared by ILI method, to simultaneously modulate the dissolution rate of two drugs, greatly improving the formulation compatibility between these two drugs. PXRD analysis of undissolved solids after IDR testing confirmed retention of the original phase, consistent with the observed IDR profiles with good linearity (Fig. S4 in Supporting information).
In addition, the accelerated stability studies conducted at 40 ℃/75% RH for three months demonstrated that all co-amorphous samples retained good physical stability with no signs of recrystallization (Fig. S5 in Supporting information). Notably, VV-ILI, despite exhibiting the lowest Tg, remained physically stable throughout the testing period, highlighting its practical application potential.
To further explore the adaptability of the ILI strategy for co-amorphous preparation, ILI was used to screen CAMS of VAL with sacubitril (SAC), captopril (CAP), and simvastatin (SIM), with comparisons to BM and RE (Table S1 in Supporting information). The results showed ILI successfully prepared all three co-amorphous systems, whereas BM failed to produce CAP-VAL CAMS after 6 h, and RE failed to obtain SIM-VAL CAMS in ethanol (Fig. S6 in Supporting information). Due to space constraints, the comparisons of microstructure and properties of these co-amorphous systems will be reported in subsequent studies. Overall, ILI exhibits good generalizability, providing an alternative strategy for co-amorphous preparation.
In summary, this study successfully developed and validated the ionic liquid intermediate (ILI) method as a novel, green, mild, and efficient technique for preparing co-amorphous systems. Using the VLG-VAL system as a model, the ILI method produced a homogeneous co-amorphous product (VV-ILI) that outperformed those prepared by ball milling (VV-BM) and rotary evaporation (VV-RE) in terms of simultaneously reducing the solubility/dissolution rate of the highly soluble VLG and enhancing the dissolution of the poorly soluble VAL. Notably, VV-ILI maintained amorphous state for at least three months under accelerated stability conditions, demonstrating robust physical stability. The ILI method thus represents a novel, green approach for engineering co-amorphous systems with tailored and diversified physicochemical properties, offering significant potential to advance the application of co-amorphous technology in pharmaceutical formulation development.
Xia-Lin Dai: Writing – review & editing. Shuang-Shuang Wang: Writing – original draft, Data curation. Ling Yang: Data curation. Jia-Miao Hao: Validation. Wei Gao: Validation. Tong-Bu Lu: Supervision. Jia-Mei Chen: Supervision.
The authors declare that they have no known competing financial interests or personal relationships that could have appeared to influence the work reported in this paper.
This work was financially supported by National Nature Science Foundation of China (Nos. 22101204 and 22271220).
Supplementary material associated with this article can be found, in the online version, at doi:
Z.Y. Fang, B.X. Zhang, W.H. Xing, et al., Chin. Chem. Lett. 33 (2022) 2159–2164. doi: 10.1016/j.cclet.2021.10.056
H.M. Johnsen, W. Filtvedt, J. Klaveness, et al., Int. J. Pharm. 666 (2024) 124809. doi: 10.1016/j.ijpharm.2024.124809
S. Salunke, F. O’Brien, D.C. Thiam Tan, et al., Adv. Drug Deliv. Rev. 190 (2022) 114507. doi: 10.1016/j.addr.2022.114507
K. Edueng, D. Mahlin, P. Larsson, et al., J. Control. Release 256 (2017) 193–202. doi: 10.1016/j.jconrel.2017.04.015
J. Han, Y. Wei, Y. Lu, et al., Expert Opin. Drug Deliv. 17 (2020) 1411–1435. doi: 10.1080/17425247.2020.1796631
H. Fael, A.L. Demirel, Int. J. Pharm. 600 (2021) 120448. doi: 10.1016/j.ijpharm.2021.120448
L. Yu, Adv. Drug Deliv. Rev. 48 (2001) 27–42. doi: 10.1016/S0169-409X(01)00098-9
R. Shelke, V. Velagacherla, U.Y. Nayak, Drug Discov. Today 29 (2024) 103863. doi: 10.1016/j.drudis.2023.103863
J. Liu, H. Grohganz, K. Löbmann, et al., Pharmaceutics 13 (2021) 389. doi: 10.3390/pharmaceutics13030389
Y. Deng, G. Huang, S. Liu, et al., Chem. Eng. J. 497 (2024) 154452. doi: 10.1016/j.cej.2024.154452
D. Hu, X. Chen, D. Li, et al., Int. J. Pharm. 635 (2023) 122707. doi: 10.1016/j.ijpharm.2023.122707
K. Rode, I. Maji, S. Mahajan, et al., Drug Discov. Today. 29 (2024) 104050. doi: 10.1016/j.drudis.2024.104050
E. Pardhi, D.S. Tomar, R. Khemchandani, et al., J. Mol. Liq. 425 (2025) 127225. doi: 10.1016/j.molliq.2025.127225
A.Y. Lee, D. Erdemir, A.S. Myerson, Annu. Rev. Chem. Biomol. Eng. 2 (2011) 259–280. doi: 10.1146/annurev-chembioeng-061010-114224
J.A. Baird, B. Van Eerdenbrugh, L.S. Taylor, J. Pharm. Sci. 99 (2010) 3787–3806. doi: 10.1002/jps.22197
A. Martinez-Garcia, L. Fink, L. Bayarjargal, et al., Int. J. Biol. Macromol. 260 (2024) 129579. doi: 10.1016/j.ijbiomac.2024.129579
A. Soyata, K. Kenti, M. Sutoro, et al., Sci. Pharm. 1 (2022) 34–40. doi: 10.58920/sciphar01010041
Y. Zhang, L. Chao, J.Q. Wang, et al., Chin. Chem. Lett. 34 (2023) 107631. doi: 10.1016/j.cclet.2022.06.054
Y.F. Zhao, B.X. Han, Z.M. Liu, Acc. Chem. Res. 54 (2021) 3172–3190. doi: 10.1021/acs.accounts.1c00251
Y. Pei, Y. Zhang, J. Ma, et al., Mater. Today Nano 17 (2022) 100159. doi: 10.1016/j.mtnano.2021.100159
K. Miyagawa, T. Kondo, R. Goto, et al., Cardiovasc. Diabetol. 12 (2013) 1–14. doi: 10.9793/elsj.30.1_1
P.H. Groop, M.E. Cooper, V. Perkovic, et al., Diabetes Obes. Metab. 19 (2017) 1610–1619. doi: 10.1111/dom.13041

Figure 1 Chemical structure of (A) vildagliptin and (B) valsartan, and the preparation diagrammatic sketch for (C) VV-ILI, (D) VV-RE, and (E) VV-BM.

Figure 2 (A) The PXRD pattern, (B) DSC curve, (C) FT-IR spectra, and (D) SEM analyses of VLG, VAL, VV-ILI, VV-RE and VV-BM.

Figure 3 MEP-mapped van der Waals surface (ρ = 0.002 au) of (A) VLG and (B) VAL. The redder the color, the more positive the MEP. Minima and maxima of MEP on the surface are drawn as cyan and orange spheres, respectively, and the unit of electrostatic potential is kcal/mol. (C-E) The first three binding patterns among the top 10 molecular clusters of VLG and VAL.

Figure 4 The equilibrium solubility for (A) VLG, (B) VAL and their co-amorphous forms, and IDR of (C) VLG, (D) VAL and their co-amorphous forms. * and # denote statistical significance for ILI vs. BM and ILI vs. RE, respectively: #/* (P < 0.05), ##/** (P < 0.01), ###/*** (P < 0.001); ns means not significant.
Table 1. The molar and weight ratio, experimental and calculated Tg values of the amorphous VLG, amorphous VAL and their co-amorphous samples.
| Sample | Molar ratio | Weight ratio | Experimental Tg (℃) | Calculated Tg (℃) |
| VLG | – | – | 38.3 ± 0.8 | N/A |
| VAL | – | – | 63.2 ± 1.1 | N/A |
| VV-ILI | 1:1 | 0.7:1 | 106.8 ± 1.2 | 52.9 |
| VV-RE | 1:1 | 0.7:1 | 113.4 ± 0.9 | 52.9 |
| VV-BM | 1:1 | 0.7:1 | 109.3 ± 1.3 | 52.9 |
 下载: 导出CSV
Table 2. Equilibrium solubility and IDR of VLG, VAL and their co-amorphous samples.
| Sample | Equilibrium solubility (mg/mL) | IDR (mg cm-2 min-1) | |||
| pH 4.5 | pH 6.8 | Water | Water | ||
| VLG | 155.0 ± 2.31 | 116.0 ± 1.75 | 159.0 ± 1.44 | 15.61 | |
| VV-ILI (VLG) | 3.7 ± 0.47 | 18.8 ± 0.93 | 13.5 ± 1.40 | 0.04 | |
| VV-RE (VLG) | 31.1 ± 0.85 | 40.2 ± 2.63 | 13.6 ± 1.20 | 0.07 | |
| VV-BM (VLG) | 31.8 ± 0.93 | 43.7 ± 2.20 | 29.7 ± 0.68 | 0.15 | |
| VAL | 0.86 ± 0.001 | 18.00 ± 0.10 | 0.09 ± 0.001 | 0.04 | |
| VV-ILI (VAL) | 0.84 ± 0.002 | 20.00 ± 0.25 | 3.90 ± 0.060 | 0.08 | |
| VV-RE (VAL) | 0.83 ± 0.001 | 20.00 ± 0.63 | 3.70 ± 0.370 | 0.07 | |
| VV-BM (VAL) | 0.84 ± 0.002 | 20.00 ± 1.15 | 3.90 ± 0.450 | 0.06 | |
下载: 导出CSV

 扫一扫看文章


扫一扫关注我们
 下载: