Scheme 1.
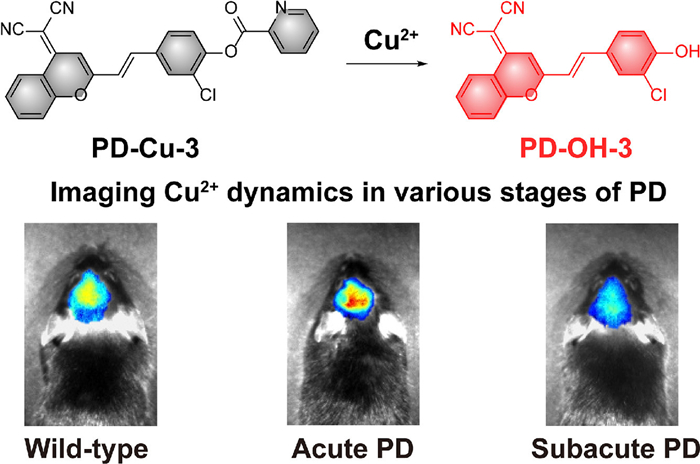
(A) Chemical structures and BBB penetration efficiency of Cu2+ fluorescent sensors. (B) The response mechanism of PD-Cu-3 towards Cu2+.
Visualization of copper metabolic fluctuations across various stages of Parkinson’s disease by a near-infrared fluorescent sensor
Shunping Zang , Jia Ke , Hanbing Zheng , Qing Liu , Benhua Wang , Minhuan Lan , Xiangzhi Song

Parkinson's disease (PD), an age-related neurodegenerative disorder, causes serious health problems such as dyskinesia, memory loss, sleep disturbance [1–3]. Despite extensive clinical efforts to identify reliable biomarkers for early-stage PD detection, the precise pathogenic mechanisms underlying PD remain elusive [4,5]. Additionally, due to its heterogeneous nature and diverse progression patterns, evaluating pathological factor at a single stage of PD is still unconvincing and unilateral, complicating the development of effective therapies [6–8]. Current research suggests that metal dyshomeostasis is tightly associated with the varied progression of PD [9,10]. As a vital trace element, copper (Cu) homeostasis plays a significant role in the pathogenesis of PD [11–13]. PD progression occurs four successive stages: prodromal, acute, panic attacks and chronic phases. In the early or prodromal stage of PD model, excessive cellular Cu2+ accumulation is observed, which is believed to induce α-synuclein aggregation and reactive oxygen species (ROS) production, ultimately leading to neuronal damage in PD brain [14,15]. Conversely, in chronic stage PD models, Cu2+ supplementation exhibit a neuroprotective effect and severs as a necessary cofactor of antioxidant enzyme [16,17]. As a result, how the cellular Cu2+ levels fluctuate across different stages of PD progression remains uncertain. Addressing this knowledge gap necessitates advanced imaging technologies capable of real-time monitoring of Cu2+ fluctuations during various PD pathological stages. Such approaches would substantially enhance the understanding of Cu2+ dynamic role in PD progression, potentially paving the way for improved diagnostic and therapeutic interventions.
Currently, fluorescence sensors are an ideal tool for biosensing and bioimaging in living systems due to its high selectivity, real-time visualization and noninvasive detection manner [18–22]. In particular, imaging sensors for brain tissues are required to be effectively permeable across the blood-brain barrier (BBB) [18,23,24]. To date, several fluorescent sensors have been developed for mapping the change of Cu2+ in several brain diseases [21,25–28]. However, none of them achieve the detection of copper metabolic fluctuations across various stages of PD. In addition, the BBB efficiency of reported sensors has not been evaluated leading to the indefinite administration in living mice imaging.
In this study, to reveal the variation of Cu2+ across different stages of PD, we aimed to develop Cu2+ fluorescent sensors that allow to penetrate BBB for specific Cu2+ monitoring. Cyan-based fluorophores possess long wavelength emission and large Stokes shift, and distinctive hydrophobicity that facilitates permeability across BBB permeable, making them ideal for brain imaging applications [29–31]. Herein, we constructed four Cu2+ fluorescent sensors, PD-Cu-1, PD-Cu-2, PD-Cu-3 and PD-Cu-4, by incorporating a 2-pyridine carbonyl group into the cyan-skeleton (Scheme 1). Among these, PD-Cu-3 displayed exceptional optical performance and superior BBB permeability (62.15%) in vitro. Using 1-methyl-4-phenylpyridinium iodide (MPP+) to generate PD model cells, we observed an initial rapid increase in cellular Cu2+ levels and a subsequent decrease through Cu2+ efflux mediated by ATP7A, highlighting the complex dynamics of Cu2+ regulation during PD procession. Furthermore, in vivo imaging studies revealed elevated intracerebral Cu2+ levels in acute PD model mice, whereas a notable decrease was observed in subacute-stage mice, suggesting stage-dependent alteration of Cu2+ levels during PD development. Overall, these findings highlight the unexpected variation of Cu2+ across PD progression stages and provide valuable insights for developing novel interventions targeting Cu2+ metabolism in PD therapy.
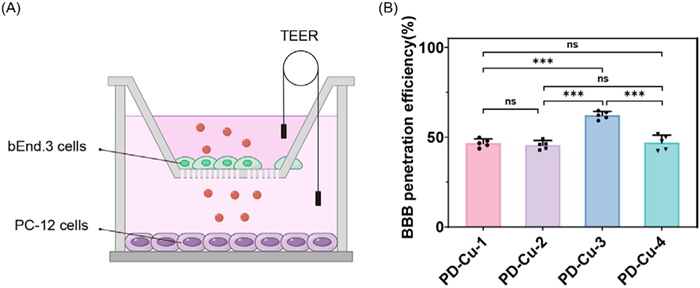
The detailed synthetic route of PD-Cu-1, PD-Cu-2, PD-Cu-3 and PD-Cu-4 was depicted in Scheme S1 (Supporting information), and these products were confirmed by HRMS, 1H NMR and 13C NMR spectral analysis. Next, To identify whether these Cu2+ fluorescent sensors are suitable for brain imaging, their BBB penetration efficiencies were assessed by a well-established transwell assay (Fig. 1) [32]. It was found that the statistical BBB efficiencies of PD-Cu-1, PD-Cu-2, PD-Cu-3 and PD-Cu-4 were 45.56%, 45.60%, 62.15%, and 46.97%, respectively. In addition, the log P of PD-Cu-3 was measured to be 1.065, implying the good lipophilicity (Table S1 and Fig. S1 in Supporting information). Thus, PD-Cu-3 was selected as the optimal Cu2+ fluorescent sensor for PD brain imaging.
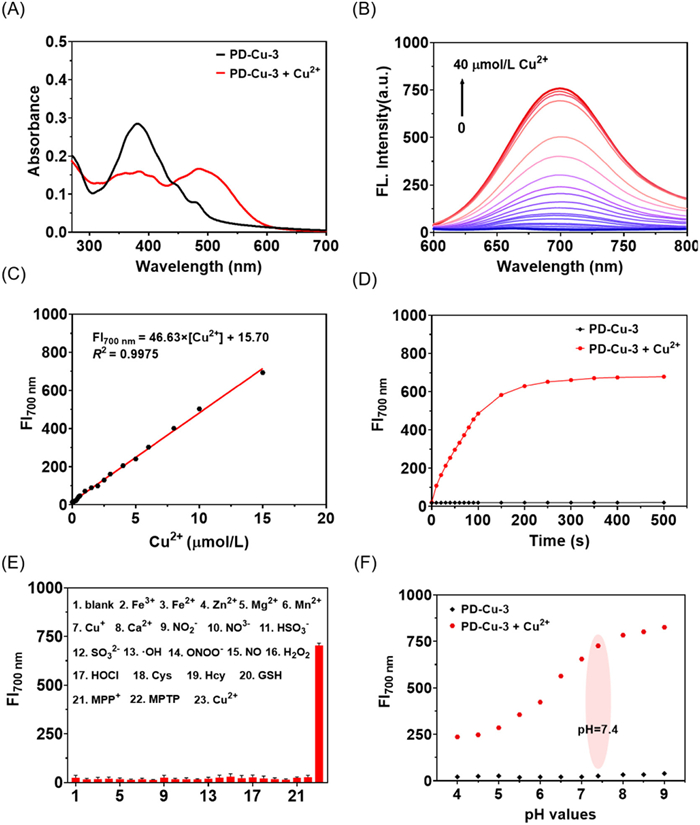
Next, the photophysical properties of PD-Cu-3 were investigated in details. As illustrated in Fig. 2A, PD-Cu-3 has an absorption with a maximum at 380 nm. Upon the addition of Cu2+, a red-shift to 495 nm was observed. Meanwhile, PD-Cu-3 is non-fluorescent whereas near-infrared (NIR) fluorescence occurred and reached saturation within 5 min when the solution of PD-Cu-3 was treated with Cu2+ (Figs. 2B and D). The fluorescence enhancement was enlarged with increasing the concentration of Cu2+. A good linear relationship between the fluorescence intensity and the concentration of Cu2+ within 0 µmol/L to 15 µmol/L and a detection limit (LOD) of 28.0 nmol/L was obtained (Fig. 2C). To assess the selectivity and anti-interference properties of PD-Cu-3, we tested its performance in the presence of common cations (Fe3+, Fe2+, Zn2+, Mg2+, Mn2+, Cu+, Ca2+), anions (NO2−, NO3−, HSO3−, SO32−), ROS (•OH, ONOO−, NO, H2O2, HOCl), and biothiols (Cys, Hcy, GSH). As shown in Fig. 2E, PD-Cu-3 exhibited a negligible fluorescence change in response to these interferring analytes. Moreover, the presence of these interferring analytes didnot affect the performence of PD-Cu-3 in the detection of Cu2+ (Figs. S2 and S3 in Supporting information). Furthermore, pH-dependent experiments demonstrated that PD-Cu-3 could reliably detect Cu2+ under physiological conditions (Fig. 2F) and both PD-Cu-3 and its related fluorophore, PD-OH-3 exhibited a good photostability (Figs. S4 and S5 in Supporting information), supporting its potential for biological applications. Moreover, the mixture of PD-Cu-3 with Cu2+ displayed a peak at m/z 345.0436 in the HRMS spectra, corresponding to the molecular weight of PD-OH-3 ([M-H] = 345.0431) (Fig. S6 in Supporting information). These above results suggest that PD-Cu-3 can effectively monitor Cu2+ with high sensitivity, selectivity, a rapid response under mild environment and exhibit it potential application in living systems. Other three Cu2+ fluorescent sensors were also studied for the detection of Cu2+ and they also showed an approving performance (Figs. S7–S9 in Supporting information).
Before the potential of PD-Cu-3 for monitoring Cu2+ dynamics in living cells, we first evaluated its cytotoxicity and biocompatibility using MTT and hematoxylin-eosin (H&E) staining assays. As presented in Fig. S10 (Supporting information), MTT assays indicated that the viability of PC-12 cells remained above 90% after treatment with PD-Cu-3 (20.0 µmol/L) for 24 h. H&E staining experiments further revealed no obvious histological differences between the Sham group and the sensor-treated group, confirming that PD-Cu-3 is non-toxic and biocompatible (Fig. S11 in Supporting information). Next, the capability of PD-Cu-3 to track exogenous Cu2+ fluctuations in PC-12 cells was first investigated (Fig. S12 in Supporting information). Cells were pre-treated with an increasing dosage of CuCl2 (5.0, 10.0, 15.0 and 20.0 µmol/L) and then stained with PD-Cu-3. Cells without CuCl2 treatment showed weak red fluorescence, indicating a low intrinsic Cu2+ concentration. In contrast, the red fluorescence signal was progressively intensified when cells were incubated with higher concentration of Cu2+. Then, Cu2+-pretreated cells (20.0 µmol/L) were further incubated with D-penicillamine (DPA), a Cu2+-selective chelating agent, and a marked reduction in red fluorescence was clearly observed. These results indicated that PD-Cu-3 has the capability to track Cu2+ fluctuations in living cells.
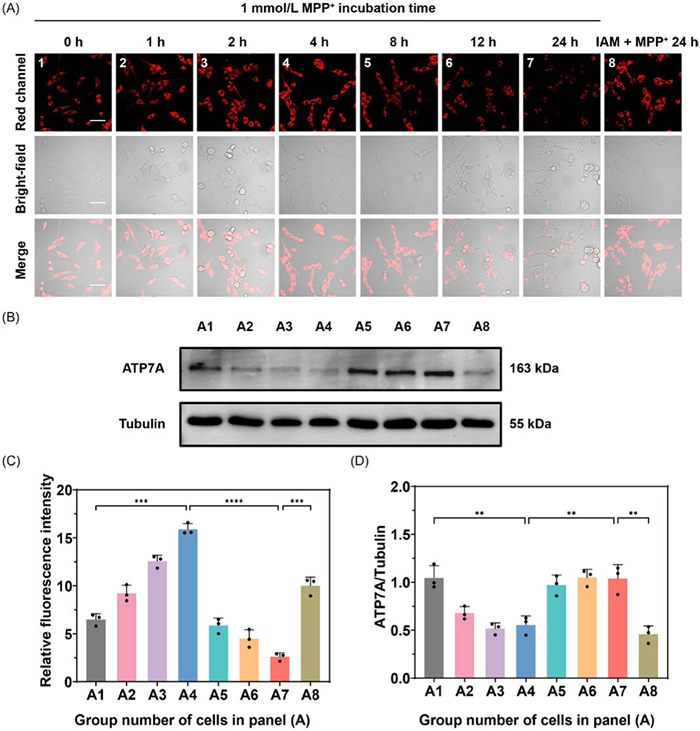
To investigate the fluctuation of Cu2+ at different PD stages, we established PD model cells using MPP+ as a stimulant, with the duration of MPP+ administration to modulate the disease state. During the first 4 h of MPP+ treatment, we observed a time-dependent red fluorescence enhancement (Fig. 3A), suggesting a significant accumulation of intracellular Cu2+ levels at the early stage of PD model cells. However, as the MPP+ exposure time increased from 8 h to 24 h, fluorescence intensity gradually diminished (Fig. 3C), implying a decline in cellular Cu2+ levels at the later stage of PD. ATP7A, a copper-transporting ATPases, is importantly responsible for Cu2+ export. We hypothesized that ATP7A expression varies across different PD stages, contributing to the fluctuation of Cu2+ levels [33,34]. Moreover, ATP7A is an ATP-dependent transporter, and its function is known to be impaired by MPP+-induced ATP depletion [35]. Next, we performed Western blot analysis to examine ATP7A expression in PC-12 cells exposed to MPP+ over different time intervals (Fig. S13 in Supporting information). As expected, MPP+ treatment from 0 h to 4 h led to a reduction in ATP7A expression, which corresponded with decreased Cu2+ efflux and increased accumulation of cellular Cu2+ during the early stage of exposure (Fig. 3B). However, prolonged MPP+ treatment from 8 h to 24 h caused a gradual upregulation of ATP7A expression. These results suggest that ATP7A responses to elevated intracellular Cu2+ levels by facilitating Cu2+ efflux during later PD progression under MPP+ stress. This phenomenon was implicitly in line with the observed copper depletion in the substantia nigra (SN) of PD models and elevated levels of free copper in the cerebrospinal fluid of long-term PD patients [36–38]. To further confirm this, PC-12 cells were pre-treated with iodoacetamide (IAM), an ATP7A inhibitor [39,40], followed by MPP+ exposure for 24 h and Cu2+ levels in these cells were then analyzed by fluorescence imaging. MPP+-induced PD model cells without IAM treatment were used as the control group. As depicted in Fig. 3A, IAM-treated group exhibited significantly brighter red fluorescence compared to the control group cells, indicating greater intracellular Cu2+ retention. This supports the conclusion that Cu2+ depletion observed during the later stage of PD is associated with increased ATP7A expression (Fig. 3D). Overall, these findings revealed the dynamic nature of Cu2+ metabolism in PD progression, with both Cu2+ overload and deficiency playing critical roles in PD pathophysiology.
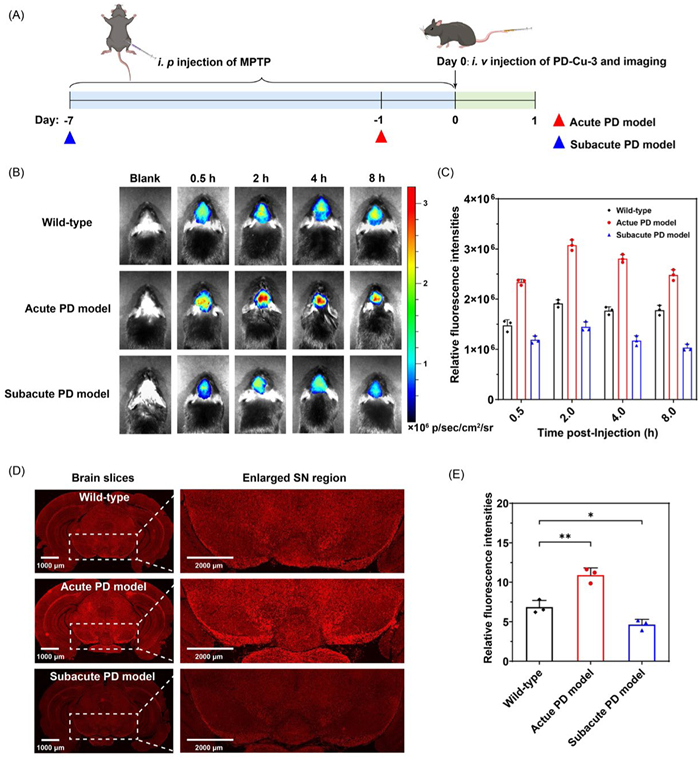
Furthermore, PD-Cu-3 was employed to monitor Cu2+ levels in the brain of various stages of PD model mice. The PD mice models were established using 1-methyl-4-phenyl-1,2,3,6-tetrahydropyridine (MPTP) as the inducer, and PD states was modulated by the administration time of MPTP (Fig. 4A) which were performed in accordance with the ethical committee of Central South University (No. 430727211101478756) and Zhejiang University (No. ZJU20250124). The acute model has a rapid neuronal stress and moderate dopaminergic neuron injury in brain whereas the subacute one displayed a severe degeneration of dopaminergic neurons with typical symptoms. The successful establishment of acute and subacute PD models were confirmed by assessing dopamine neuron damage via tyrosine hydroxylase immunohistochemistry in SN (Fig. S14 in Supporting information). PD-Cu-3 was injected into mice through tail vein, and fluorescence imaging was performed within 8 h post-injection. As illustrated in Figs. 4B and C, and Fig. S15 (Supporting information), the brains of acute PD model mice exhibited a sharp fluorescence increase compared with that of the wild-type group, indicating the elevated Cu2+ levels at early stage of PD. In contrast, subacute PD model mice displayed a diminished fluorescence in brain, suggesting a reduction in Cu2+ levels as neurodegeneration progressed. Moreover, brain slices were collected and imaged to directly assess Cu2+ levels in the whole brain especially in SN, a critical region in PD pathogenesis. As shown in Figs. 4D and E, both the whole brain and the enlarged SN region in acute PD model exhibited an augmented fluorescent intensity in comparison with those of wild-type group; whereas an attenuated fluorescence signal was observed in the whole brain and SN of the subacute PD model. Collectively, using PD-Cu-3 as a valuable imaging tool, we revealed that Cu2+ level rises at early PD stage and diminishes at prolonged PD stage.
In summary, we elucidated the dynamic regulation of Cu2+ metabolism across different stages of PD using a Cu2+ fluorescent sensor, PD-Cu-3, with a good BBB permeability (62.15%). Based on the imaging results of in vitro PD model cells and copper protein assays, we found that Cu2+ levels fluctuate throughout PD progression, with an initial accumulation in the early stages followed by a reduction in later phases due to ATP7A-mediated Cu2+ efflux. Through in vivo PD model mice, we demonstrated that Cu2+ fluctuation is intricately linked to PD pathogenesis. Specifically, we observed an elevation in Cu2+ levels during acute PD stages and a decline in the subacute stage, suggesting a stage-dependent role of Cu2+ in neurodegeneration. This study advances our understanding of Cu2+ metabolism in PD and possibly help the development of Cu2+-targeted diagnostic and therapeutic strategies for PD management.
The authors declare that they have no known competing financial interests or personal relationships that could have appeared to influence the work reported in this paper.
Shunping Zang: Writing – original draft. Jia Ke: Formal analysis. Hanbing Zheng: Formal analysis. Qing Liu: Validation. Benhua Wang: Investigation. Minhuan Lan: Investigation. Xiangzhi Song: Writing – review & editing, Resources, Investigation, Funding acquisition.
This work was supported by the National Natural Science Foundation of China (Nos. 22278447, 22178395, 22478445).
Supplementary material associated with this article can be found, in the online version, at doi:
W. Poewe, K. Seppi, C.M. Tanner, et al., Nat. Rev. Dis. Primers 3 (2017) 17013. doi: 10.1038/nrdp.2017.13
L.V. Kalia, A.E. Lang, Lancet 386 (2015) 896–912. doi: 10.1016/S0140-6736(14)61393-3
H.R. Morris, M.G. Spillantini, C.M. Sue, et al., Lancet 403 (2024) 293–304. doi: 10.1016/S0140-6736(23)01478-2
R. Soni, K. Mathur, J. Shah, Ageing Res. Rev. 94 (2024) 102208. doi: 10.1016/j.arr.2024.102208
L. Parnetti, L. Gaetani, P. Eusebi, et al., Lancet Neurol. 18 (2019) 573–586. doi: 10.1016/S1474-4422(19)30024-9
R.G. Elbers, H.W. Berendse, G. Kwakkel, JAMA 315 (2016) 2340–2341. doi: 10.1001/jama.2016.5260
R. Coukos, D. Krainc, Nat. Rev. Neurosci. 25 (2024) 393–413. doi: 10.1038/s41583-024-00812-2
N. The Lancet, Lancet Neurol. 19 (2020) 797. doi: 10.1016/S1474-4422(20)30320-3
E. Botsford, J. George, E.E. Buckley, Brain Sci. 11 (2018) 194. doi: 10.3390/brainsci8110194
B. Vellingiri, A. Suriyanarayanan, K.S. Abraham, et al., J. Neurol. 269 (2022) 5798–5811. doi: 10.1007/s00415-022-11282-w
M. Huang, Y. Zhang, X. Liu, Ageing Res. Rev. 95 (2024) 102214. doi: 10.1016/j.arr.2024.102214
J.R. Liddell, A.R. White, Neurochem. Int. 117 (2018) 126–138. doi: 10.1016/j.neuint.2017.05.016
M. Bisaglia, L. Bubacco, Biomolecules 10 (2020) 195. doi: 10.3390/biom10020195
E. Carboni, P. Lingor, Metallomics 7 (2015) 395–404. doi: 10.1039/C4MT00339J
E. Masliah, E. Rockenstein, I. Veinbergs, et al., Science 287 (2000) 1265–1269. doi: 10.1126/science.287.5456.1265
M. Rubio-Osornio, S. Montes, F. Pérez-Severiano, et al., Neurochem. Int. 54 (2009) 447–451. doi: 10.1016/j.neuint.2009.01.019
B.G. Trist, K.M. Davies, V. Cottam, et al., Acta Neuropathol. 134 (2017) 113–127. doi: 10.1007/s00401-017-1726-6
H. Wang, X. Mu, J. Yang, et al., Coord. Chem. Rev. 380 (2019) 550–571. doi: 10.1016/j.ccr.2018.11.003
X. Liu, Y. Chen, C. Hang, et al., ACS Nano 18 (2024) 22233–22244. doi: 10.1021/acsnano.4c06103
M.Y. Wu, A.Y.H. Wong, J.K. Leung, et al., Proc. Natl. Acad. Sci. U. S. A. 118 (2021) e2106143118. doi: 10.1073/pnas.2106143118
Z. Zhou, S. Chen, Y. Huang, et al., Biosens. Bioelectron. 198 (2022) 113858. doi: 10.1016/j.bios.2021.113858
G. Yin, Y. Gan, H. Jiang, et al., Anal. Chem. 93 (2021) 9878–9886. doi: 10.1021/acs.analchem.1c01945
T.A. Pollak, S. Drndarski, J.M. Stone, et al., Lancet Psychiat. 5 (2018) 79–92. doi: 10.1016/S2215-0366(17)30293-6
G.C. Terstappen, A.H. Meyer, R.D. Bell, et al., Nat. Rev. Drug Discov. 20 (2021) 362–383. doi: 10.1038/s41573-021-00139-y
B. Wang, J. Shi, W. Zhai, et al., Sensors Actuators B: Chem 423 (2025) 136767. doi: 10.1016/j.snb.2024.136767
J. Chen, R. Luo, S. Li, et al., Chem. Sci. 15 (2024) 13082–13089. doi: 10.1039/d4sc03445g
J. Zhu, M.E. Graziotto, V. Cottam, et al., ACS Sensors 9 (2024) 2858–2868. doi: 10.1021/acssensors.3c02549
C. Liu, M. Qin, S. Xu, et al., Sensors Actuators B: Chem. 407 (2024) 135509. doi: 10.1016/j.snb.2024.135509
W. Zhang, F. Huo, C. Yin, J. Mater. Chem. B 6 (2018) 6919–6929. doi: 10.1039/c8tb02205d
L. Dai, Q. Zhang, Q. Ma, et al., Coord. Chem. Rev. 489 (2023) 215193. doi: 10.1016/j.ccr.2023.215193
H. Li, J. Wang, H. Kim, et al., Angew. Chem. Int. Ed. 63 (2024) e202311764. doi: 10.1002/anie.202311764
J. Ke, C. Yu, S. Li, et al., Adv. Healthcare Mater. 13 (2024) 2302939. doi: 10.1002/adhm.202302939
B.A. Mendelsohn, C. Yin, S.L. Johnson, et al., Cell Metab. 4 (2006) 155–162. doi: 10.1016/j.cmet.2006.05.001
S. Masaldan, S.A.S. Clatworthy, C. Gamell, et al., Redox Biol. 16 (2018) 322–331. doi: 10.1016/j.redox.2018.03.007
J. Telianidis, Y.H. Hung, S. Materia, et al., Front. Aging Neurosci. 5 (2013) 44.
H. Roelofsen, H. Wolters, M.J.A. Van Luyn, et al., Gastroenterology 119 (2000) 782–793. doi: 10.1053/gast.2000.17834
T. Skjørringe, L.B. Møller, T. Moos, Front. Pharmacol. 3 (2012) 1–14.
M.C. Boll, M. Alcaraz-Zubeldia, S. Montes, et al., Neurochem. Res. 33 (2008) 1717–1723. doi: 10.1007/s11064-008-9610-3
Y. Qian, E. Tiffany-Castiglioni, E.D. Harris, Am. J. Physiol. Cell Physiol. 269 (1995) 892–898.
Y. Qian, E. Tiffany-Castiglioni, E.D. Harris, Mol. Brain Res. 48 (1997) 60–66. doi: 10.1016/S0169-328X(97)00083-1

Scheme 1 (A) Chemical structures and BBB penetration efficiency of Cu2+ fluorescent sensors. (B) The response mechanism of PD-Cu-3 towards Cu2+.

Figure 1 (A) Schematic illustration of the transport of sensors in vitro BBB model. (B) BBB penetration efficiencies of Cu2+ fluorescent sensors. Error bars represent SD, n = 5. ***P < 0.001.

Figure 2 (A) UV absorption spectra of PD-Cu-3 (10.0 µmol/L) before and after adding Cu2+ (20.0 µmol/L). (B) Fluorescence spectra of PD-Cu-3 (10.0 µmol/L) towards various concentrations of Cu2+. (C) Linear correlation between fluorescence intensity and Cu2+ concentration. (D) Time-dependent fluorescence intensity of PD-Cu-3 (10.0 µmol/L) in the absence and presence of Cu2+ (20.0 µmol/L). (E) Fluorescence intensity at 700 nm of PD-Cu-3 (10.0 µmol/L) in the presence of various bioactive species (1~23: blank, Fe3+, Fe2+, Zn2+, Mg2+, Mn2+, Cu+, Ca2+, NO2-, NO3-, HSO3-, SO32-, ·OH, ONOO-, NO, H2O2, HOCl, Cys, Hcy, GSH, MPP+, MPTP, Cu2+; other species at 20.0 µmol/L, GSH, MPP+ and MPTP at 1.0 mmol/L). (F) Fluorescence intensity at 700 nm of PD-Cu-3 (10.0 µmol/L) in the presence (red dots) and absence (black dots) of Cu2+ (20.0 µmol/L) at various pH values. λex = 540 nm.

Figure 3 (A) Fluorescence imaging of Cu2+ in PC-12 cells: (A1-A7) Cells treated with MPP+ (1 mmol/L) for different durations (0, 1, 2, 4, 8, 12 and 24 h), followed by staining with PD-Cu-3 (10.0 µmol/L); (A8) Cells pre-treated with IAM (0.5 mmol/L) for 30 min, then treated with MPP+ (1 mmol/L) for 24 h, and subsequently stained with PD-Cu-3 (10.0 µmol/L). (B) Western blot assays of ATP7A expression in cells in panel (A). (C) Relative fluorescent intensity from the images in panel (A). (D) Semi-quantitative contents of ATP7A expression in cells in panel (A). λex = 543 nm, λem = 650–750 nm. Scale bar: 50 µm. Error bars represent SD, n = 3. ***P < 0.001, **P < 0.01, *P < 0.05.

Figure 4 (A) Schematic diagram of the establishment of PD model mice and monitoring Cu2+ in mice and brain tissues. (B) Fluorescence images of brains from wild-type, acute and subacute PD mice at various time points following tail vein injection of PD-Cu-3 (200.0 µg/kg). (C) Relative fluorescence intensities of mice at each time point in panel (B). (D) Fluorescence images of brain slices from each group of mice. (E) Relative fluorescence intensities in the SN of brain slices in panel (D). λex = 543 nm, λem = 650–750 nm. Error bars represent SD, n = 3. **P < 0.01, *P < 0.05.

 扫一扫看文章

扫一扫关注我们
 DownLoad:
 下载:
下载:
 下载:
下载: