Received Date:
13 June 2025 Accepted Date:
09 September 2025 Revised Date:
02 September 2025 Available Online:
15 July 2026
Abstract:
Achieving efficient and sustainable hydrogen production from methanol electrolysis requires significant advances in catalyst design. In this study, we present a novel strategy where nickel selenide, featuring distinct crystal phases, anchors on mesoporous hollow carbon spheres to synergistically enhance the activity of Pt for methanol-assisted water splitting reactions. The heterostructured NiSe/NiSe2 nanosheets modulate the electronic structure of Pt, positioning it closer to an optimal thermodynamic state, and creating a highly oxophilic environment that accelerates charge transfer and optimizes the adsorption and desorption of reaction intermediates. The engineered hybrid catalyst exhibits exceptional enhancements in both mass and specific activity for methanol oxidation, significantly outperforming commercial catalysts. In addition, the catalyst exhibits a high electroactive surface area, an abundance of active sites, fast catalytic kinetics, and excellent stability. Notably, a methanol electrolyzer utilizing this catalyst achieves a current density of 10 mA/cm2 at only 0.67 V, a remarkable 1.08 V reduction compared to the voltage required for conventional water electrolysis (1.75 V). This work provides a transformative strategy for designing high-performance electrocatalysts, offering new pathways for more efficient and sustainable hydrogen production through methanol electrolysis.
Global energy and environmental challenges have accelerated the development of the hydrogen economy, with electrochemical water splitting for hydrogen generation, powered by clean energy, gaining increasing attention [1–4]. The proton exchange membrane (PEM) electrolyzer, known for its rapid response and high energy efficiency, is well-suited for integration with sustainable energy sources [5–8]. However, the oxygen evolution reaction (OER) in water electrolysis, which requires a theoretical potential of 1.23 V, demands high energy input for hydrogen production [9–11]. In contrast, methanol, a hydrogen-rich liquid fuel with a low theoretical oxidation potential of 0.016 V, presents an attractive alternative for hydrogen production via methanol electrolysis (CH3OH + H2O → CO2 + 6H+ + 6e-), offering significant energy savings [12,13].
To efficiently facilitate methanol electrolysis, high-performance catalysts with optimal Pt utilization are essential, particularly for the anode methanol oxidation reaction (MOR) [14,15]. Moreover, the tricky issue of susceptibility to the poisoning effect caused by the intermediates badly hindered its practical applications [16–18]. To this end, one efficient strategy is to combine Pt and catalytic promoters to alleviate its toxicity to carbon monoxide (CO) by generating adsorbed hydroxyl groups (OHads) at lower potentials. Specifically, oxyphilic species can provide large amounts of OHads by activating water molecules, thereby promoting the rapid oxidation of adsorbed carbon monoxide (COads) on the Pt surface and re-releasing the Pt active site [19–21]. According to previous reports, transition metal oxides and phosphides have successively made great achievements as catalytic promoters in effectively mitigating CO poisoning and improving the MOR performance on the surface of Pt catalysts [22,23]. Recent reports have found that transition metal selenides with appropriate d-electron density have stimulated more attention due to their good electrical conductivity, robust water molecule activation, and dissociation ability [24–26]. Meanwhile, the anionic radius of Se is larger than O and P, which provides a suitable band gap for enhancing its electrochemical intrinsic activity, making transition metal selenides a potential platform of Pt catalysts [27–29].
Nickel selenides, with different stoichiometric ratios and various nanomorphological structures, are an effective platform for enhancing electrocatalytic performance based on their specific electronic properties and morphologies [30]. Unfortunately, pure nickel selenide as a catalytic promoter has limited contribution to the electrocatalytic performance. Thus, various strategies, such as element doping or constructing heterostructures have been adopted to enhance its co-catalytic properties [31,32]. By employing interface engineering to construct heterostructures, the surface electronic structure can be tailored, while the synergistic interactions between various components enhance the intrinsic catalytic activity [33–36]. Given the outstanding performance of heterostructure systems in various electrocatalytic reactions [28,37], it is reasonable to speculate that the coupling of heterostructures with Pt could yield a superior co-catalytic effect compared to either component alone. However, to the best of our knowledge, the coupling of a nickel selenide heterostructure with Pt for methanol electrolysis has yet to be reported.
Considering that traditional carbon black-supported catalysts suffer from poor stability due to their easy coalescence [38,39], herein, silica was used as a template to synthesize mesoporous hollow carbon spheres (MHCS) as conductive support. The NiSe/NiSe2@MHCS nanohybrid materials were synthesized, followed by the deposition of Pt nanoparticles to obtain the Pt-NiSe/NiSe2@MHCS catalyst. The resulting catalyst demonstrated remarkable electrocatalytic activity and stability. Specifically, the Pt-NiSe/NiSe2@MHCS achieved a peak current density of 85.5 mA/cm2 for methanol oxidation, surpassing the performance of the Pt/C catalyst (27.2 mA/cm2) by a factor of 3.1. Moreover, the methanol electrolyzer incorporating the Pt-NiSe/NiSe2@MHCS required only 0.67 V to sustain a current density of 10 mA/cm2, representing a significant reduction of 1080 mV compared to water electrolysis. The substantial performance improvement can be attributed to the electronic structure modulation of Pt active sites, enabled by the superior electron transport of MHCS, the high dispersion of Pt nanoparticles, and the synergistic effect between Pt and the oxyphilic NiSe/NiSe2 heterostructures. These results highlight the critical role of heterostructure engineering in optimizing Pt-based catalysts for hydrogen generation via methanol electrolysis.
The strategy for the Pt-NiSe/NiSe2@MHCS catalyst fabrication is schematically depicted in Fig. 1a. The process begins with the preparation of MHCS, which was obtained by removing the SiO2 template from the resorcinol-formaldehyde oligomers-coated SiO2 core particles (SiO2@SiO2/RF). The Ni(OH)2 deposited over the MHCS was used to obtain NiSe/NiSe2@MHCS by selenization with Se powder. Se-rich NiSe2 is stable at low temperatures, and it will be readily decomposed into NiSex at high temperatures to form NiSe/NiSe2 heterostructure where x < 2 [40]. At last, the final Pt-NiSe/NiSe2@MHCS catalyst was prepared by loading Pt nanoparticles on NiSe/NiSe2@MHCS. Pt-NiSe@MHCS and Pt-NiSe2@MHCS catalysts were synthesized under the same conditions, except for the different selenization temperatures (details see Supporting information).
Figure 1
Figure 1.
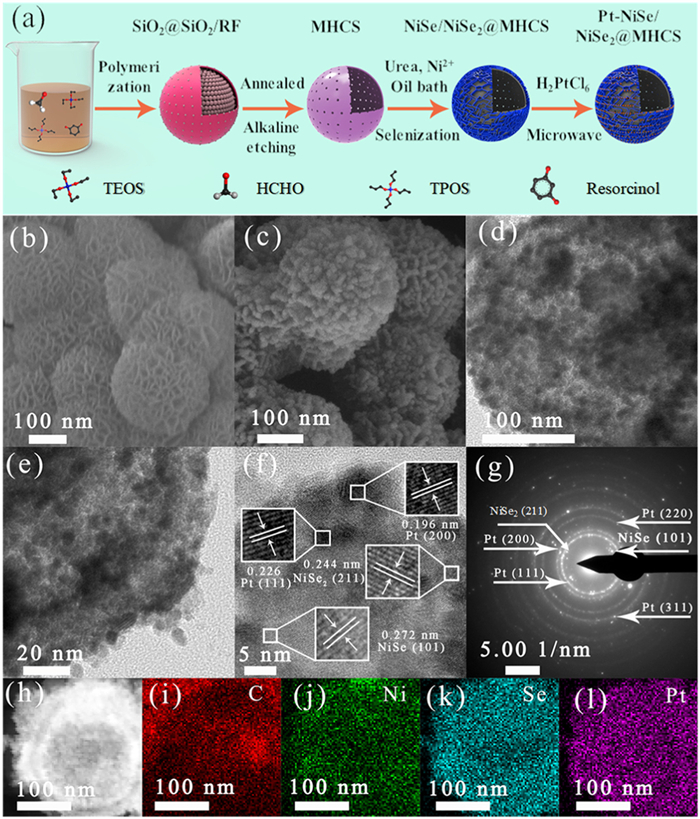
(a) Synthesis strategy of Pt-NiSe/NiSe2@MHCS catalyst. (b) SEM image of Ni (OH)2@MHCS. (c) SEM image of NiSe/NiSe2@MHCS catalyst. (d, e) TEM image, (f) HRTEM image, (g) SAED pattern, (h) High-resolution HAADF-STEM image, and (i-l) elemental mapping of Pt-NiSe/NiSe2@MHCS catalyst.
The morphology of the samples at different stages was analyzed using scanning electron microscopy (SEM). The as-prepared MHCS exhibits a uniform spherical morphology with an average diameter of 230 ± 20 nm (Fig. S1 in Supporting information). The surface of the carbon shell has many pores, which are irregularly arranged. When Ni(OH)2 nanosheets were assembled on the surface of MHCS, the original spherical shape was still maintained (Fig. 1b). Fig. 1c displays the morphology of the NiSe/NiSe2@MHCS sample, where the nanosheets on the carbon sphere surface are slightly agglomerated after thermal annealing. In the transmission electron microscopy (TEM) observation for the Pt-NiSe/NiSe2@MHCS catalyst, the spherical structure is well preserved and uniformly coated with large numbers of nanoparticles of Pt (Figs. 1d and e, Figs. S2a and b in Supporting information). The high-resolution TEM (HRTEM) images well indicate the combination of Pt nanoparticles with NiSe/NiSe2, where the lattice spacings attributed to NiSe (101) and NiSe2 (211) crystal planes, and (200) and (111) facets of Pt are well indicated (Fig. 1f). The heterojunction interface of NiSe/NiSe2 was indicated in the local magnification, and Pt nanoparticles were located next to NiSe/NiSe2 (Fig. S2c in Supporting information). The close contact between Pt nanoparticles and NiSe/NiSe2 is expected to promote efficient electron exchange and thus favour the electrocatalytic processes. The selected area electron diffraction (SAED) pattern of Pt-NiSe/NiSe2@MHCS shows a polycrystalline structure with the diffraction rings indexed to Pt, NiSe and NiSe2 (Fig. 1g). The atomic ratio of Ni to Se in the sample is close to 1:1.5 as indicated by the energy dispersive X-ray (EDS) energy spectrum, signifying the hybrid structure of NiSe and NiSe2 formation; the content of Pt was measured to be 19.74 wt% (Fig. S3 in Supporting information). This content was close to that (19.65 wt%) obtained by inductively coupled plasma-mass spectrometry (ICP-MS). The elemental mapping images show the distribution of C, Se, Ni, and Pt around the MHCS (Figs. 1h-l). Some elements did not overlap with one another quite well because of the thermal annealing-induced element diffusion and their anchoring effect of the Pt nanoparticles.
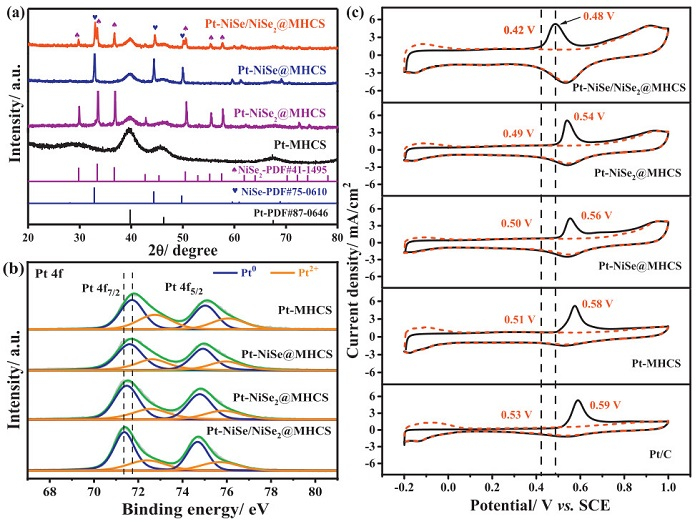
The crystal phase of nickel selenide can be controlled by simply adjusting the annealing temperature by selenization of Ni(OH)2@MHCS as confirmed by the X-ray diffraction (XRD) pattern (Fig. S4 in Supporting information). NiSe2@MHCS and NiSe@MHCS were prepared at 350 and 500 ℃, respectively. NiSe2 is unstable at high temperatures and easily decomposes to NiSe, therefore, the coexistence of NiSe and NiSe2 was obtained at 450 ℃. After Pt deposition over their surfaces, some peaks assigned to Pt were observed at around 39.8°, 46.3°, and 67.5° (PDF #87-0646), respectively (Fig. 2a). The crystal size of Pt was calculated using the Scherrer equation by the Pt (111) peak, and the size was ca. 2.57, 3.61, 4.36 and 4.81 nm for Pt-NiSe/NiSe2@MHCS, Pt-NiSe2@MHCS, Pt-NiSe@MHCS, and Pt-MHCS, respectively. Smaller Pt nanoparticles exhibit larger surface areas and more uniform dispersion, which are beneficial for catalytic performance. The electronic properties of these catalysts were investigated by X-ray photoelectron spectroscopy (XPS), and the binding energy was calibrated by referring to the C 1s peak of sp2 hybridization at 284.8 eV (Fig. S5 in Supporting information). Pt 4f spectrum showed two doublets of 4f7/2 and Pt 4f5/2 states from the spin-orbital splitting (Fig. 2b). Each peak can be fitted to the metallic Pt and Pt2+ species (Table S1 in Supporting information); specifically, the peaks at 71.37 and 74.68 eV were attributed to the Pt(0) of Pt 4f7/2 and Pt 4f5/2 for Pt-NiSe/NiSe2@MHCS catalyst, respectively [41]. Note that the binding energy of the samples containing NiSe or/and NiSe2 was negatively shifted in contrast to that of Pt-MHCS, where the Pt-NiSe/NiSe2@MHCS exhibits the maximum negative shift of about 0.35 eV, indicating a much stronger electronic interaction in the system [42]. This negative shift indicates that the electron donation from the support increases the electron density of Pt; theoretically, this will lead to a down-shift of the Pt d-band center, weakening the Pt-CO bond and enhancing the electrocatalytic performance (vide infra). Consequently, a high content of metallic Pt was observed in the Pt-NiSe/NiSe2@MHCS sample, which shows more active sites for methanol adsorption and dissociation. Similar Ni 2p profiles were observed for different samples (Fig. S6 in Supporting information). The Se 3d spectra (Fig. S7 in Supporting information) revealed distinct peak profiles for the Se-Ni bond and Se-O bond, with the surface oxidation of Se being notably suppressed in the Pt-NiSe/NiSe2@MHCS catalyst compared to the control samples [43]. The electron interaction might mainly come from the Pt-Se interaction because of the profile of the Se 3d peak change and positive shift in the peak position among the samples.
Figure 2
Figure 2.
(a) XRD patterns, (b) XPS spectra of the Pt 4f region for Pt-NiSe/NiSe2@MHCS, Pt-NiSe2@MHCS, Pt-NiSe@MHCS, and Pt-MHCS. (c) CO stripping curves of Pt-NiSe/NiSe2@MHCS, Pt-NiSe@MHCS, Pt-NiSe2@MHCS, Pt-MHCS, and Pt/C catalysts in 0.5 mol/L H2SO4 solution at the scan rate of 20 mV/s.
The electrocatalytic behaviors of catalysts loaded on glass carbon electrodes were first studied by cyclic voltammetry (CV) in 0.5 mol/L H2SO4 solution (Fig. S8 in Supporting information). The characteristic electrochemical behavior of Pt was evident in all catalysts, with a peak around 0.9 V observed for those containing NiSe and/or NiSe2. This indicates the easier formation of oxygen-containing species compared to the Pt-MHCS and Pt/C samples with peaks above 1.2 V. Since CO is the main substance that causes the poisoning of Pt catalyst during MOR [44,45], the CO-stripping voltammetry was then used to probe the CO tolerance ability (Fig. 2c). The Pt-NiSe/NiSe2@MHCS catalyst exhibited notably more negative onset and peak potentials for COads oxidation, with both shifting by approximately 110 mV compared to the commercial Pt/C catalyst, indicating a marked resistance to CO poisoning [46]. It is worth noting that negative shifts observed for the Pt-NiSe2@MHCS and Pt-NiSe@MHCS catalysts were less pronounced (Table S2 in Supporting information). The electrochemical active surface area (ECSA) was calculated based on the electrooxidation charge of the monolayer CO adsorbate on Pt sites (420 µC/cm2). Pt-NiSe/NiSe2@MHCS showed the highest value of 76.1 m2/g, most likely due to the good dispersion and small size of Pt nanoparticles (Table S2).
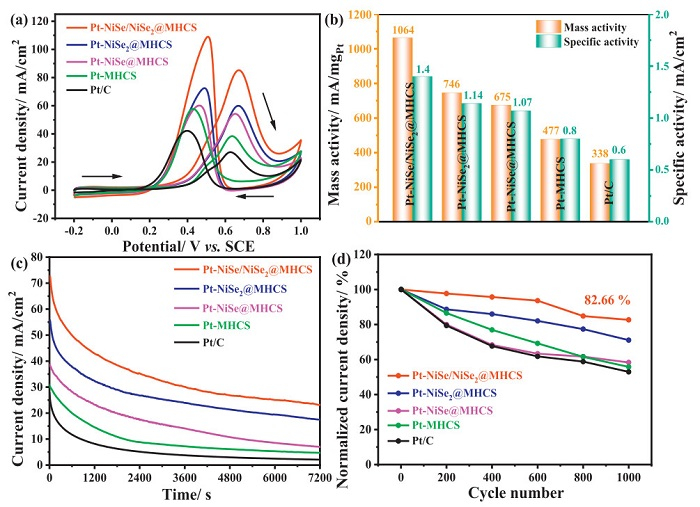
Subsequently, to evaluate the MOR activity, the CV tests were conducted in 0.5 mol/L H2SO4 + 1 mol/L CH3OH solution at 50 mV/s (Fig. 3a). Each CV curve displays typical features of methanol electrooxidation, including forward and reverse scanning peaks [47]. The methanol electrooxidation performance of the catalyst is usually evaluated by the onset potential and forward peak current density [47]. Pt-NiSe/NiSe2@MHCS showed the onset potential of 0.42 V, the lowest one among the samples, confirming the faster reaction kinetics. The same result was found for the forward peak current density; Pt-NiSe/NiSe2@MHCS showed a current density of 85.5 mA/cm2, ca. 3.1 times that of the Pt/C catalyst (27.2 mA/cm2). To explore the intrinsic catalytic properties, we further calculate the mass activity and the specific activity by normalizing the forward peak current to mass and ECSA of Pt, respectively (Fig. 3b and Fig. S9 in Supporting information). As observed, the Pt-NiSe/NiSe2@MHCS exhibits the mass activity of 1064 mA/mgPt, and the specific activity of 1.4 mA/cm2, which is also much larger than that of the control samples (Table S3 in Supporting information). The performance of Pt-NiSe/NiSe2@MHCS for MOR exceeds most of the reported Pt-based catalysts, indicating a promising application in fuel cells (Table S4 in Supporting information).
Figure 3
Figure 3.
(a) CV curves recorded at the scan rate of 50 mV/s. (b) Mass and specific activity, (c) CA curves of Pt-NiSe/NiSe2@MHCS, Pt-NiSe2@MHCS, Pt-NiSe@MHCS, Pt-MHCS, and Pt/C catalysts. (d) The forward peak current density vs. cycling numbers during the accelerated durability test. Condition: N2-saturated 0.5 mol/L H2SO4 + 1 mol/L CH3OH; Pt loading: 0.08 mg/cm2.
The durability of all catalysts for acid methanol oxidation was investigated by the chronoamperometry (CA) technique operated at 0.6 V vs. SCE for 7200 s (Fig. 3c). Since the MOR on the electrode was controlled by mass transfer, thus, the current density will be reduced, which can be supported by the Cottrell equation, where the current is inversely proportional to the time. Moreover, the performance decay was also influenced by the poisoning species accumulation, corrosion, and catalyst leaching. Here, all the MHCS-supported catalysts exhibit much higher current density than Pt/C throughout the test. Among them, the end current density for Pt-NiSe/NiSe2@MHCS (23.1 mA/cm2) is ca. 11 times that of Pt/C (2.1 mA/cm2), confirming the better durability. An accelerated dynamic stability test was also performed with a successive scan for 1000 cycles with 150 mV/s (Fig. 3d and Fig. S10 in Supporting information). It can be seen that all catalysts show a decay trend in the peak current density; the Pt-NiSe/NiSe2@MHCS catalyst exhibits the best durability keeping 82.66% after 1000 cycles among the electrodes; while it was 52.94% for the Pt/C catalyst.
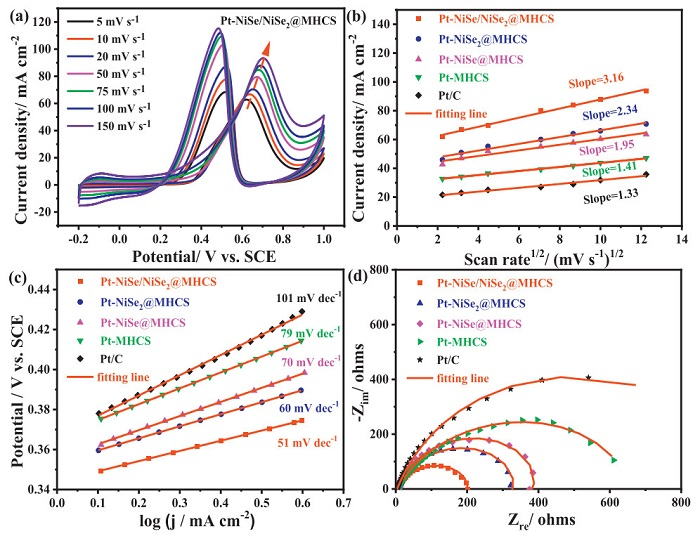
The reaction kinetics is an important appraisal factor reflecting the catalytic performance. The CV curves recorded at different scanning rates for methanol oxidation were studied (Fig. 4a and Figs. S11a-e in Supporting information). The variation of peak potential is partially attributed to the interaction between the electrode surface and electrolyte, and the irreversible electrode reaction process was surface-controlled by kinetics [48]. The surface coverage $ \left(\varGamma^*\right) $ could be calculated by the following formula:
$
j_{\mathrm{p}}=\left(n^2 F^2 / 4 R T\right) υ \varGamma^*
$
(1)
Figure 4
Figure 4.
(a) CV curves of Pt-NiSe/NiSe2@MHCS for methanol oxidation. (b) The corresponding plot of forwarding jpversus v1/2). (c) Tafel plots of Pt-NiSe/NiSe2@MHCS, Pt-NiSe2@MHCS, Pt-NiSe@MHCS, Pt-MHCS and Pt/C catalysts (d) Nyquist plots of Pt-NiSe/NiSe2@MHCS, Pt-NiSe2@MHCS, Pt-NiSe@MHCS, Pt-MHCS and Pt/C catalysts in 0.5 mol/L H2SO4 + 1 mol/L CH3OH solution at 0.4 V vs. SCE.
where jp is the peak current density in mA/cm2, n is the total electron transfer number, υ is the scan rate in mV/s, and $ \varGamma^* $ is the surface coverage of redox species in mol/cm2 [49,50]. The average value of $ \varGamma^* $ for different catalysts is shown in Table S5 (Supporting information). The Pt-NiSe/NiSe2@MHCS catalyst has the largest $ \varGamma^* $ value, consistent with the highest ECSA and catalytic activity. A diffusion-controlled process was further supported by the good linear relationship between the jp and the υ1/2 (Fig. 4b). The diffusion coefficient of the methanol molecule can be obtained according to the following formula:
jp=2.99×10⁵n[(1−α)n0]1/2CD1/2υ1/2
(2)
where n0 is the number of electrons, α is the transfer coefficient, C is concentration, and D is the diffusion coefficient [49,50].
The value of α can be calculated from the following formula:
Ep=(0.03/n0α)logυ+constant
(3)
where Ep is the peak potential.
Calculations revealed that Pt-NiSe/NiSe2@MHCS exhibited the highest methanol diffusion coefficient (Fig. S11f and Table S5 in Supporting information), which aligns with other dynamic parameters such as the Tafel slope. As shown in Fig. 4c, the Tafel slopes for Pt-NiSe/NiSe2@MHCS, Pt-NiSe@MHCS, and Pt-NiSe2@MHCS are approximately 60 mV/dec, indicating that the rate-determining step is water activation, promoted by the oxyphilic NiSe and NiSe2 phases [51,52]. Electrochemical impedance spectroscopy (EIS) further elucidated the charge transfer resistance (Rct) during methanol oxidation (Fig. 4d). By fitting the Nyquist plots with an equivalent circuit (Fig. S12a in Supporting information), the Rct for Pt-NiSe/NiSe2@MHCS was found to be 186.5 Ω, lower than that of the other samples (Table S6 in Supporting information). The reduced Rct suggests faster charge transfer, further supporting the superior electrocatalytic performance of Pt-NiSe/NiSe2@MHCS. These findings confirm that the incorporation of MHCS and the NiSe/NiSe2 heterostructure significantly enhances both surface mass and charge transport properties.
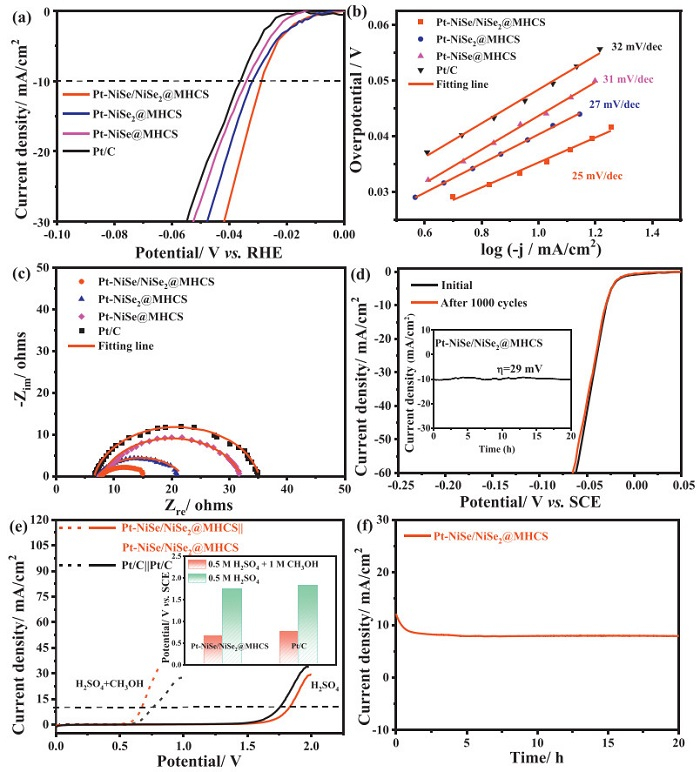
The hydrogen evolution reaction (HER) performance was assessed using linear sweep voltammetry (LSV) in a nitrogen-saturated methanol solution. All Pt-based catalysts exhibited high HER activity due to the intrinsic catalytic properties of Pt (Fig. 5a). Notably, the Pt-NiSe/NiSe2@MHCS electrode required only a 29 mV overpotential to achieve a kinetic current density of 10 mA/cm2. Tafel slope analysis showed values close to the typical 30 mV/dec for all electrodes, indicating that HER kinetics follow the Volmer-Tafel mechanism (Fig. 5b) [53]. Further evaluation of reaction kinetics using electrochemical impedance spectroscopy (EIS) revealed that the Rct of Pt-NiSe/NiSe2@MHCS was only 8 Ω, lower than those of Pt-NiSe2@MHCS (14 Ω), Pt-NiSe@MHCS (24 Ω), and Pt/C (28 Ω), indicating faster electrocatalytic kinetics (Fig. 5c). The durability of the Pt-NiSe/NiSe2@MHCS electrode was assessed through 1000 CV cycles and CA tests (Fig. 5d), showing negligible shifts in the CV curves after 1000 cycles and no significant current attenuation at 10 mA/cm2 for 20 h. These results confirm the excellent durability and long-term stability of Pt-NiSe/NiSe2@MHCS, which is critical for practical HER applications.
Figure 5
Figure 5.
(a) HER polarization curves, (b) Tafel plots, (c) Nyquist plots at -0.029 V vs. RHE for Pt-NiSe/NiSe2@MHCS, Pt-NiSe2@MHCS, Pt-NiSe@MHCS, and Pt/C catalysts, (d) LSV polarization curves of Pt-NiSe/NiSe2@MHCS before and after 1000 CV cycles (inset: chronoamperometry curve at -0.029 V vs. RHE for 20 h). (e) Polarization curves of Pt-NiSe/NiSe2@MHCS||Pt-NiSe/NiSe2@MHCS and Pt/C||Pt/C electrolyzer for methanol and water electrolysis (Insert: Comparative performance analysis of Pt-NiSe/NiSe2@MHCS and Pt/C Catalysts). (f) Stability of Pt-NiSe/NiSe2@MHCS at 0.67 V for 20 h.
Given the more favorable kinetics of MOR compared to the OER, an electrolyzer for the methanol electrolysis was assembled using Pt-NiSe/NiSe2@MHCS as both the anode and cathode. The performance of methanol electrolysis was compared to water electrolysis (Fig. 5e). For water electrolysis, Pt-NiSe/NiSe2@MHCS electrolyzer showed a cell voltage of 1.75 V to reach the kinetic current density of 10 mA/cm2. In contrast, methanol electrolysis required only 0.67 V to achieve the same current density. Even compared to the cell voltage of the Pt/C||Pt/C electrolyzer in 0.5 mol/L H2SO4 (1.83 V) and in 0.5 mol/L H2SO4 containing methanol (0.76 V), Pt-NiSe/NiSe2@MHCS demonstrated lower potentials, highlighting its superior catalytic efficiency (insert of Fig. 5e). The current efficiency was calculated by comparing the current contribution of water and methanol oxidation. The current efficiency for methanol electrolysis was gradually increased by increasing the potentials from 0.4 V to 0.8 V, which was above 95% (Fig. S12b in Supporting information). It was further confirmed by gas chromatography (GC), the Faraday efficiency at 0.6, 0.7 and 0.8 V was calculated to be 96.43%, 97.85% and 98.72%, respectively (Figs. S13a-d in Supporting information). The stability of the Pt-NiSe/NiSe2@MHCS electrode was further tested by continuous operation for 20 h (Fig. 5f). An initial performance decay was observed, primarily due to MOR-related degradation by poisoning species adsorption. After the stability test, the Pt-NiSe/NiSe2@MHCS catalyst still showed a good crystal structure and morphology, indicating its excellent stability (Figs. S14a and b in Supporting information). While the leaching indeed happened, where 1.82 wt% Pt, 3.25 wt% Ni and 4.34 wt% Se was lost into the electrolyte. This significant reduction in energy consumption suggests that methanol oxidation, rather than water oxidation, holds great promise for achieving more energy-efficient hydrogen production.
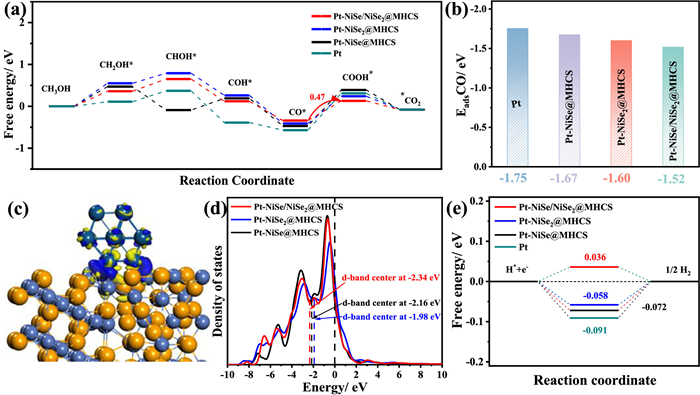
We conducted density-functional theory (DFT) calculations to gain deeper insight into the kinetic mechanisms governing the MOR and HER. Details of the calculations and models are provided in the supporting information (Figs. S15-S18 in Supporting information). Based on the catalytic mechanism, we plotted the full reaction free energy diagrams for MOR (Fig. 6a). The adsorption-free energy values of CO were found to be lower than those of other intermediates, indicating that CO-poisoned species are the most stable intermediates, consistent with previous literature [54]. Notably, the adsorption-free energy of CO on Pt-NiSe/NiSe2@MHCS is higher compared to Pt, suggesting a weaker Pt-CO bond on the Pt-NiSe/NiSe2@MHCS surface. This weaker interaction points to the critical role of the heterogeneous interfaces in reducing CO* adsorption on the platinum surface, enhancing the MOR catalytic activity.
Figure 6
Figure 6.
(a) Free energy diagram for MOR on Pt-NiSe/NiSe2@MHCS, Pt-NiSe2@MHCS, Pt-NiSe@MHCS, and Pt surface. (b) Adsorption energy of CO on Pt-NiSe/NiSe2@MHCS, Pt-NiSe2@MHCS, Pt-NiSe@MHCS, and Pt surface. (c) Electron density difference of CO adsorption on Pt-NiSe/NiSe2@MHCS (yellow for electron depletion and blue for electron accumulation). (d) The calculated density of states plot. (e) Calculated ΔGH* of Pt-NiSe/NiSe2@MHCS, Pt-NiSe2@MHCS, Pt-NiSe@MHCS, and Pt.
The rate-determining step (RDS) in the MOR involves the oxidation of CO* to COOH*. Our calculations reveal a lower energy barrier for this step on Pt-NiSe/NiSe2@MHCS (0.47 eV) compared to Pt (0.88 eV), implying more favorable kinetics and superior catalytic performance. The free energy of CO* adsorption (ECO*) is a key descriptor for evaluating MOR performance [55], Pt-NiSe/NiSe2@MHCS demonstrates the lowest ECO*, suggesting that the formation of heterogeneous interfaces optimizes the charge distribution, thereby weakening CO* chemisorption (Fig. 6b). To validate this, differential charge density analysis revealed significant electron transfer from the support to Pt, with charge accumulation at the interface (Fig. 6c). This electron abundance at the interface favors attenuating CO adsorption, consistent with XPS analysis and CO-stripping results. The density of states (DOS) further supports this, showing that the d-band center of Pt in Pt-NiSe/NiSe2@MHCS is furthest from the Fermi energy level, implying the weakest CO adsorption (Fig. 6d). For HER performance, Gibbs free energy (ΔG) is a critical parameter, with the ideal catalyst having an ΔG value near zero [56,57]. We established adsorption models for H on the surface and calculated the Gibbs free energy of H adsorption (ΔGH*). The ΔGH* value for Pt-NiSe/NiSe2@MHCS (0.036 eV) is the closest to thermodynamic neutrality, demonstrating superior HER activity (Fig. 6e and Fig. S19 in Supporting information). Moreover, the total DOS (Fig. S20 in Supporting information) shows an increase in electronic states near the Fermi level after heterojunction formation and Pt modification, contributing to the enhanced HER and MOR catalytic activities.
In conclusion, nickel selenide with distinct crystal phases and structures, combined with mesoporous hollow carbon spheres (MHCS), was explored for its efficacy in enhancing Pt-catalyzed acid methanol-assisted water-splitting reactions. Among the tested catalysts, the Pt-NiSe/NiSe2@MHCS with a heterogeneous architecture demonstrated the most outstanding electrochemical performance, including superior catalytic activity, stability, anti-poisoning properties, and efficient kinetics for both MOR and HER. The outstanding performance can be primarily attributed to the following factors: (1) MHCS enables rapid electron transport, (2) the surface nanosheet structure facilitates uniform and stable Pt nanoparticle deposition, (3) the oxophilic NiSe/NiSe2 heterojunction structure boosts surface active species generation through water activation, (4) the modification of Pt’s electronic states by the heterogeneous NiSe/NiSe2 interface dramatically reduces Pt-CO interactions, significantly enhancing MOR kinetics, and (5) the synergistic interaction between Pt nanoparticles and the NiSe/NiSe2 heterostructure maximizes catalytic efficiency. Notably, the Pt-NiSe/NiSe2@MHCS bifunctional electrocatalyst enabled a methanol electrolyzer to operate at a remarkably low cell voltage of 0.67 V to achieve a current density of 10 mA/cm2, which is 1.08 V lower than the required voltage for water electrolysis (1.75 V), and significantly outperforms the Pt/C electrode. This study provides valuable insights for catalytic kinetics understanding of heterogeneous NiSe/NiSe2 support promoting Pt for H2 generation via methanol electrolysis.
Declaration of competing interest
The authors declare that they have no known competing financial interests or personal relationships that could have appeared to influence the work reported in this paper.
CRediT authorship contribution statement
Fangfang Ren: Writing – original draft, Validation, Methodology, Investigation, Formal analysis, Data curation. Wei Qiao: Writing – original draft, Validation, Investigation, Formal analysis, Data curation. Yubin Kuang: Writing – original draft, Methodology, Investigation, Formal analysis. Yajing Xie: Writing – review & editing, Writing – original draft, Resources, Formal analysis. Ligang Feng: Writing – review & editing, Validation, Supervision, Funding acquisition.
Acknowledgment
This work was financially supported by the National Natural Science Foundation of China (Nos. 22302168, and 22272148).
Supplementary materials
Supplementary material associated with this article can be found, in the online version, at doi:10.1016/j.cclet.2025.111816.
T. Chu, P. Tian, G. Wang, et al., Adv. Mater. 37 (2025) 2504603. doi: 10.1002/adma.202504603
Figure 1
(a) Synthesis strategy of Pt-NiSe/NiSe2@MHCS catalyst. (b) SEM image of Ni (OH)2@MHCS. (c) SEM image of NiSe/NiSe2@MHCS catalyst. (d, e) TEM image, (f) HRTEM image, (g) SAED pattern, (h) High-resolution HAADF-STEM image, and (i-l) elemental mapping of Pt-NiSe/NiSe2@MHCS catalyst.
Figure 2
(a) XRD patterns, (b) XPS spectra of the Pt 4f region for Pt-NiSe/NiSe2@MHCS, Pt-NiSe2@MHCS, Pt-NiSe@MHCS, and Pt-MHCS. (c) CO stripping curves of Pt-NiSe/NiSe2@MHCS, Pt-NiSe@MHCS, Pt-NiSe2@MHCS, Pt-MHCS, and Pt/C catalysts in 0.5 mol/L H2SO4 solution at the scan rate of 20 mV/s.
Figure 3
(a) CV curves recorded at the scan rate of 50 mV/s. (b) Mass and specific activity, (c) CA curves of Pt-NiSe/NiSe2@MHCS, Pt-NiSe2@MHCS, Pt-NiSe@MHCS, Pt-MHCS, and Pt/C catalysts. (d) The forward peak current density vs. cycling numbers during the accelerated durability test. Condition: N2-saturated 0.5 mol/L H2SO4 + 1 mol/L CH3OH; Pt loading: 0.08 mg/cm2.
Figure 4
(a) CV curves of Pt-NiSe/NiSe2@MHCS for methanol oxidation. (b) The corresponding plot of forwarding jpversus v1/2). (c) Tafel plots of Pt-NiSe/NiSe2@MHCS, Pt-NiSe2@MHCS, Pt-NiSe@MHCS, Pt-MHCS and Pt/C catalysts (d) Nyquist plots of Pt-NiSe/NiSe2@MHCS, Pt-NiSe2@MHCS, Pt-NiSe@MHCS, Pt-MHCS and Pt/C catalysts in 0.5 mol/L H2SO4 + 1 mol/L CH3OH solution at 0.4 V vs. SCE.
Figure 5
(a) HER polarization curves, (b) Tafel plots, (c) Nyquist plots at -0.029 V vs. RHE for Pt-NiSe/NiSe2@MHCS, Pt-NiSe2@MHCS, Pt-NiSe@MHCS, and Pt/C catalysts, (d) LSV polarization curves of Pt-NiSe/NiSe2@MHCS before and after 1000 CV cycles (inset: chronoamperometry curve at -0.029 V vs. RHE for 20 h). (e) Polarization curves of Pt-NiSe/NiSe2@MHCS||Pt-NiSe/NiSe2@MHCS and Pt/C||Pt/C electrolyzer for methanol and water electrolysis (Insert: Comparative performance analysis of Pt-NiSe/NiSe2@MHCS and Pt/C Catalysts). (f) Stability of Pt-NiSe/NiSe2@MHCS at 0.67 V for 20 h.
Figure 6
(a) Free energy diagram for MOR on Pt-NiSe/NiSe2@MHCS, Pt-NiSe2@MHCS, Pt-NiSe@MHCS, and Pt surface. (b) Adsorption energy of CO on Pt-NiSe/NiSe2@MHCS, Pt-NiSe2@MHCS, Pt-NiSe@MHCS, and Pt surface. (c) Electron density difference of CO adsorption on Pt-NiSe/NiSe2@MHCS (yellow for electron depletion and blue for electron accumulation). (d) The calculated density of states plot. (e) Calculated ΔGH* of Pt-NiSe/NiSe2@MHCS, Pt-NiSe2@MHCS, Pt-NiSe@MHCS, and Pt.

 DownLoad:

 下载:
下载:


 下载:
下载:
