Citation:
Zhongjie Song, Nannan Zhang, Jun Yu, Huiyu Sun, Zhengying Wu, Yukou Du. Growth of Ce-doped NiCo-LDHs on tin dioxide-modified nickel foam as oxygen evolution reaction catalyst electrode[J]. Chinese Chemical Letters,
2026, 37(1): 111804.
doi:
10.1016/j.cclet.2025.111804
Growth of Ce-doped NiCo-LDHs on tin dioxide-modified nickel foam as oxygen evolution reaction catalyst electrode
English
Growth of Ce-doped NiCo-LDHs on tin dioxide-modified nickel foam as oxygen evolution reaction catalyst electrode
College of Chemistry, Chemical Engineering and Materials Science, Soochow University, Suzhou 215123, China
b.
Jiangsu Key Laboratory for Environment Functional Materials, School of Materials Science and Engineering, Suzhou University of Science and Technology, Suzhou 215009, China
Received Date:
13 July 2025 Accepted Date:
08 September 2025 Revised Date:
23 August 2025 Available Online:
15 January 2026
Abstract:
Developing catalysts with excellent stability while significantly reducing the overpotential of the oxygen evolution reaction (OER) is crucial for advancing overall water splitting (OWS) systems. In this study, we synthesized the electrode material Ce-NiCo-LDHs@SnO2/NF through a two-step hydrothermal reaction, where Ce-doped NiCo-LDHs are grown on nickel foam modified by a SnO2 layer. Ce doping adjusts the internal electronic distribution of NiCo-LDHs, while the introduction of the SnO2 layer enhances electron transfer capability. Together, these factors contribute to the reduction of the OER energy barrier and experimental evidence confirms that the reaction proceeds via the lattice oxygen evolution mechanism (LOM). Consequently, Ce-NiCo-LDHs@SnO2/NF exhibits high level electrochemical performance in OER, requiring only 234 mV overpotential to achieve a current density of 10 mA/cm2, with a Tafel slope of just 27.39 mV/dec. When paired with Pt/C/NF, an external potential of only 1.54 V is needed to drive OWS to attain a current density amounting to 10 mA/cm2. Furthermore, the catalyst demonstrates stability for 100 h during the OWS stability test. This study underscores the feasibility of enhancing the OER performance through Ce doping and the introduction of a conductive SnO2 layer.
As non-replenishable energy sources, fossil fuels such as coal, natural gas and petroleum are confronted with the increasingly severe challenge of depletion. Researchers are dedicated to identifying ideal alternative renewable energy sources [1–5]. Hydrogen has a high combustion energy density and generates environmentally benign combustion products, so that it is regarded as an ideal new energy source to replace traditional fossil fuels [6–12]. The chemical method of hydrogen production via water electrolysis has a high energy conversion efficiency. The hydrogen generated by this method exhibits high purity and the raw materials are readily available. Therefore, it is currently considered one of the most promising hydrogen production methods [13,14]. In the electrolysis of water, the anode is the site of the OER (oxygen evolution reaction), and the HER (hydrogen evolution reaction) is catalyzed at the cathode [15–19]. Compared to the HER, the OER involves a four-electron transfer process, which is more challenging to carry out due to the higher overpotential and slower kinetics [20–22]. Therefore, OER is considered as the rate-limiting step of overall water splitting (OWS). Designing appropriate anode materials to reduce the overpotential of OER is currently a major focus of research. Precious metal catalysts like RuO2 and IrO2 [23–29] are classic electrode materials for OER. However, these materials are prone to oxidation during electrolysis in alkaline electrolytes, leading to undesirable deactivation of catalysts. Noble metals, such as Ru and Ir, are characterized by their high cost and limited resources, which severely limit their large-scale industrial application [30,31]. The creation and synthesis of cost-effective and high-performance anode materials for OER play a crucial role in advancement of hydrogen production via water electrolysis.
Firstly, to enhance conductivity, conductive substrates can be employed to construct self-supported materials. In which the active components grow directly on the conductive substrate, which exhibits strong mechanical stability. This eliminates the need for binders, thereby avoiding the loss of conductivity and catalytic activity. Secondly, layered double hydroxides (LDHs) have emerged as highly promising candidates for efficient OER catalysts resulting from the low cost, high activity, exceptional stability, tunable composition, and an abundance of active sites [32,33]. Among those LDHs, NiCo-LDHs is a commonly used non-precious metal catalyst for OER with broad applications [34–39]. However, its relatively weak electron transfer capabilities and low activity limit its further utilization. To enhance the activity, one effective approach is the doping of high-valent metal ions to modulate the internal electronic structure of LDHs [40–48]. The advantage of doping with foreign metal ions is that it is easily tunable. For example, Fan and his colleagues synthesized Ir-doped NiCo LDHs [13]. Ir doping altered the crystal structure of NiCo LDHs, enhanced the synergistic effects between metals in OER, increased the active surface area and improved the conductivity. In addition to this, the doping of other metals, such as Ce [37], Ru [49], Rh [50], Ta [46], has been extensively studied. Moreover, for the purpose of enhancing the electron transfer capability of the catalyst, a conductive layer can be introduced between the active component and the conductive substrate, further improving the overall conductivity and catalytic activity of the electrode. For instance, Qu's team synthesized an electrode catalyst by adding a SnO2 conductive layer between NiFe LDHs and NF [51]. Tin dioxide, a typical N-type semiconductor material with excellent electron transfer ability and increased active surface area of the catalyst, leading to NiFeLDHs@SnO2/NF exhibits excellent OER performance. Moreover, the LDH/SnO2 heterostructure we constructed exhibits unique properties that enhance OER activity. This characteristic of the heterostructure has been recently confirmed in studies on electrocatalytic water splitting [52–57].
Inspired by the aforementioned experiments, we combined high valence ion doping with the introduction of a conductive layer and successfully synthesized the main catalyst Ce-NiCo-LDHs@SnO2/NF. In detail, the growth of Ce-doped NiCo-LDHs on the conductive substrate SnO2/NF were achieved through a two-step hydrothermal reaction. Ce doping regulates the internal electronic distribution of NiCo-LDHs and changes the morphology and structure of the catalyst, while the introduction of the SnO2 layer accelerates electron transfer. Therefore, our catalyst exhibits outstanding OER performance in alkaline solution. Ce-NiCo-LDHs@SnO2/NF, when used as the anode for OER, needs just a 234 mV overpotential to attain a current density of 10 mA/cm2. Its Tafel slope is a mere 27.39 mV per decade. When combined with Pt/C/NF for OWS testing, the reaction can be driven with just 1.54 V. Moreover, the catalyst exhibits excellent stability beyond 200 h at 100 mA/cm2 in OER. Fig. 1a illustrates the overall synthesis process of Ce-NiCo-LDHs@SnO2/NF. Specifically, SnO2/NF was first prepared via a hydrothermal method at 180 ℃ for 12 h. Subsequently, Ce-NiCo-LDHs@SnO2/NF was synthesized by reacting Co(NO3)2·6H2O and Ni(NO3)2·6H2O as metal sources at 180 ℃ for 2 h.
Figure 1
Figure 1.
(a) Schematic diagram of the synthesis of SnO2/NF and Ce-NiCo-LDHs@SnO2/NF. SEM images of (b, c) SnO2/NF, (d, e) NF, (f) NiCo-LDHs@NF, (g) NiCo-LDHs@SnO2/NF and (h) Ce-NiCo-LDHs@SnO2/NF. (i) TEM image, (j) HRTEM image and (k) SAED image of Ce-NiCo-LDHs@SnO2/NF. (l) HAADF-TEM image and (m-q) EDS mapping images of Ce-NiCo-LDHs@SnO2/NF.
The micro-morphological structure of the Ce-NiCo-LDHs@SnO2/NF was characterized by using transmission electron microscopy (TEM) and scanning electron microscopy (SEM). As presented in Figs. 1b and c, compared with the SEM images of clean NF (Figs. 1d and e), SnO2 forms a layer of surface on the surface of nickel foam, showing an etched mesh-like morphology, which can expand the surface area of the catalyst to a measurable extent, which may provide more active surface area and regulate the size of NiCo-LDHs and Ce-NiCo-LDHs grown on nickel foam. We utilized Brunauer-Emmett-Teller (BET) to measure the specific surface area of pristine nickel foam and SnO2 (Fig. S17 in Supporting information), finding an increase of 53.3%. In addition, SnO2 belongs to N-type semiconductor material, which is characterized by excellent electron transfer ability, therefore, the introduction of SnO2 creates more electron transport channels [51]. Fig. 1f shows the SEM image of NiCo-LDHs@NF, it shows that NiCo-LDHs owns a structure of flower. Fig. 1g shows the SEM image of NiCo-LDHs@SnO2/NF. It can be found that NiCo-LDHs has successfully grown on the surface of SnO2/NF, and it presents an exquisite flower shape. It is worth noting that a comparison between Figs. 1f and g reveals that the introduction of the SnO2 layer results in smaller flower-like NiCo-LDHs, the flower-like structure in the former has a larger diameter of 9.75 um, while the latter has a radius of only 5.15 um, which is a reduction of 47.17%. Moreover, as depicted in Fig. 1h, SEM images for Ce-NiCo-LDHs@SnO2/NF shows similar characteristics to NiCo-LDHs@SnO2/NF. It is also a graceful florid, but the obvious difference between them is that the flowers in SEM image of Ce-NiCo-LDHs@SnO2/NF are more densely packed and smaller, with a diameter of only 1.56 µm. Compared with NiCo-LDHs@NF and NiCo-LDHs@SnO2/NF, the diameter of Ce-NiCo-LDHs@SnO2/NF has been reduced by 84% and 69.71%, respectively. The more compact and smaller-sized flower-like structure increases the contact area between the catalyst surface and the electrolyte, facilitating the timely desorption of the generated gases and thereby enhancing the OER performance. It can be concluded that the introduction of the SnO2 layer can reduce the volume of the NiCo-LDHs flower-like structures. Moreover, doping with Ce can make the flower-like structure more compact and also decrease its volume. The TEM images of NiCo-LDHs@NF, NiCo-LDHs@SnO2/NF, and Ce-NiCo-LDHs@SnO2/NF in Fig. S16 (Supporting information) also show the size characteristics of the three catalyst structures. The TEM image (Fig. 1i) shows a complete flake structure, which is consistent with the flake shape in the SEM image. The high-resolution transmission electron microscopy (HRTEM) image, as depicted in Fig. 1j, shows three different lattice fringe spacings of 0.230, 0.330 and 0.275 nm matched with the (002) plane of Ni (OH)2, the (110) plane of SnO2 and the (100) plane of Co (OH)2, indicating that the heterostructure composed of NiCo-LDHs and SnO2 and the channel for high-speed electron transport have been successfully constructed on NF. The selected area electron diffraction (SAED) pattern observed in Fig. 1k confirms the coexistence of NiCo-LDHs and SnO2. The observed diffraction patterns, arranged from smaller to larger radii, can be indexed to the Ni (OH)2 (100) plane, the Co (OH)2 (111) plane, and the SnO2 (422) plane.
To confirm the successful doping of Ce and the distribution of NiCo-LDHs and SnO2, energy-dispersive X-ray spectroscopy (EDS) analysis was performed using scanning transmission electron microscopy (STEM). Fig. 1l shows the high angle annular dark field-scanning transmission electron microscopy (HAADF-TEM) image of Ce-NiCo-LDHs@SnO2/NF. The obtained mapping images are shown in Figs. 1m-q, in which Ni, Co, O, Sn and Ce elements are uniformly distributed. Moreover, EDS spectrum (Fig. S5a in Supporting information) of Ce-NiCo-LDHs@SnO2/NF also confirms the uniform distribution of these elements, and Fig. S6 (Supporting information) shows the EDS spectra of other synthesized catalysts. To further verify the successful fabrication of Ce-NiCo-LDHs@SnO2/NF, X-ray diffraction (XRD) patterns of Ce-NiCo–LDHs@SnO2/NF, Ce-NiCo-LDHs@NF and NiCo-LDHs@SnO2/NF are displayed in Fig. 2a. The common three noticeable peaks at 45.06°, 52.55°, and 77.54° are assigned to (110), (200), and (220) planes of nickel foam (PDF #01–1260) [58]. Because the content of doped Ce is low, the corresponding peak cannot be found in the XRD pattern. In XRD patterns, the diffraction peaks of Ce-NiCo-LDHs and SnO2 received are very inconspicuous for the strong background interference of nickel foam. Fig. 2a shows that Ce doping results in a positive shift of the diffraction peaks and a reduction in peak intensity of NiCo-LDHs, this is attributed to the fact that Ce is doped into NiCo-LDHs via an ion-exchange mechanism, which alters the crystal structure and induces lattice compression [37]. To solve the problem of weak signals, we treated the products on the nickel foam by ultrasonic stripping, centrifuged to obtain the powder samples and studied the XRD pattern of the powder samples (Fig. 2b and Fig. S1a in Supporting information)) [51]. Specifically, Fig. 2b presents the XRD pattern of the Ce-NiCo-LDHs@SnO2/NF powder sample, the diffraction peaks corresponding to the (110), (101), (211), and (301) crystal planes of SnO2 (PDF #46–1088) [51], the (201), (111), (110), (102), (101), (100), and (001) planes of Ni(OH)2 (PDF #14–0117), as well as the (001), (100), (101), (102), (003) and (103) planes of Co(OH)2 (PDF #30–0443) are clearly identified. Additionally, XRD patterns of powders of SnO2 and Ce-NiCo-LDHs are displayed in Fig. S1a. These data provide evidence for the construction of Ce-NiCo-LDHs@SnO2/NF.
Figure 2
Figure 2.
(a) XRD patterns of Ce-NiCo-LDHs@/NF, NiCo-LDHs@SnO2/NF, Ce-NiCo-LDHs@SnO2/NF. (b) XRD pattern of Ce-NiCo-LDHs@SnO2/NF powder. (c) Ni 2p, (d) Co 2p XPS spectra of Ce-NiCo-LDHs@/NF, Ce-NiCo-LDHs@SnO2/NF and NiCo-LDHs@SnO2/NF. (e) Ce 3d XPS spectra of Ce-NiCo-LDHs@NF and Ce-NiCo-LDHs@SnO2/NF. (f) Sn 3d XPS spectra of Ce-NiCo-LDHs@SnO2/NF and NiCo-LDHs@SnO2/NF.
For the purpose of further investigating the chemical interaction between SnO2 and Ce-NiCo-LDHs, X-ray photoelectron spectroscopy (XPS) of Ce-NiCo-LDHs@SnO2/NF, Ce-NiCo-LDHs@NF and NiCo-LDHs@SnO2/NF were performed. From the XPS survey spectra shown in Fig. S1b (Supporting information), characteristic peaks of Ce 3d, Ni 2p, Co 2p, and Sn 3d can be identified. Fig. S2 (Supporting information) shows XPS spectra of survey scan of Ce-NiCo-LDHs@NF and NiCo-LDHs@SnO2/NF. Ni 2p XPS spectrum of Ce-NiCo-LDHs@SnO2/NF (Fig. 2c), shows characteristic peaks at 855.82 and 873.15 eV, associated with the Ni 2p3/2 and Ni 2p1/2 orbitals of Ni2+ [59], along with peaks at 856.99 and 874.89 eV, which are assigned to the Ni 2p3/2 and Ni 2p1/2 orbitals of Ni3+ [38], and the peaks at 862.09 and 880.25 eV are attributed to the satellite peaks of Ni. By comparing the three spectra in Fig. 2c, it is not difficult to find that the addition of Ce and the introduction of SnO2 have shifted the peak of Ni 2p3/2 and Ni 2p1/2 to a position with higher binding energy, indicating that the addition of these two substances has changed the electronic distribution of original NiCo-LDHs. By comparing the area under the peak of Ni3+ and Ni2+, it can be seen that both changes can increase the proportion of Ni3+(Fig. S3 in Supporting information), resulting in higher OER performance. The Ni3+/Ni2+ ratio in catalyst Ce-NiCo-LDHs@SnO2/NF reaches 0.835. The increased proportion of high-valent ions is conducive to the formation of active intermediates, thereby enhancing the OER performance. No peaks corresponding to Ni0 were detected [60], suggesting that the nickel foam surface was entirely enveloped. For the Co 2p XPS spectral pattern of Ce-NiCo-LDHs@SnO2/NF (Fig. 2d), the separation of 16 eV in the binding energies between the Co 2p3/2 (781.36 eV) and Co 2p1/2 (797.36 eV) peaks in the XPS spectrum of cobalt indicates the coexistence of Co2+ and Co3+ [34]. The peaks located at 780.42 and 796.37 eV are in accordance with Co 2p3/2 and Co 2p1/2 orbits of Co3+ [61]. The Co 2p3/2 and Co 2p1/2 orbitals of Co²⁺ are represented by the peaks at 782.16 and 797.82 eV, respectively [38]. The peaks at 787 and 803.24 eV are assigned to the satellite peaks of Co, while the peak at 775.93 eV is attributed to the Auger peak of Co. Similarly, by comparing the three spectra in Fig. 2d, it is obviously that the doping of Ce makes the peak position of Co 2p1/2 and Co 2p3/2 shift to the direction of higher binding energy, indicating that the electron oxidation may occur on the Co surface and the electron density decreases. The introduction of SnO2 makes the peak position of Co shift to a higher binding energy direction as well, indicating that SnO2 has decreased the electron density on the surface of Co, which may be due to the greater electronegativity of Sn compared with Co. The shift in the binding energy of the Co 2p peak may be more favorable for the formation of *OH, thereby accelerating the OER. Moreover, we also studied the effect of the introduction of SnO2 on the dopant Ce to further understand the electronic motion in the catalyst. We do this by comparing the peak positions of Ce 3d (Fig. 2e) which shows the XPS spectrum for Ce 3d of Ce-NiCo-LDHs@SnO2/NF. The peaks at 873.90 and 880.40 eV can be ascribed to Ce 3d5/2 orbit of Ce4+ and Ce3+ and the binding energy ranging from 895.05 to 911.35 eV was ascribed to Ce 3d3/2 for Ce3+ and Ce4+[62]. Comparing the spectra of Ce-NiCo-LDHs@SnO2/NF and Ce-NiCo-LDHs@NF in Fig. 2e, it is found that the introduction of SnO2 shifts the position of the XPS spectrum peak of Ce 3d toward a higher binding energy, which may be because Sn has a greater electronegativity than Ce. Similarly, Fig. 2f shows the XPS spectrum for Sn 3d of Ce-NiCo-LDHs@SnO2/NF, the signals detected at 486.53 and 495.02 eV can be ascribed to the Sn 3d5/2 and Sn 3d3/2 orbitals of tetravalent tin ion (Sn4+) [51]. With the incorporation of Ce, the XPS peaks of Sn shift to the direction of lower binding energy, indicating that electrons flow from Ce to Sn. Integrating the above information, it can be concluded that the doping of Ce and the heterojunction interface between SnO2 and NiCo-LDHs exert a regulatory effect on the active sites. The change in the charge density of Co and the increased presence of Ni3+ improve the catalytic activity for OER.
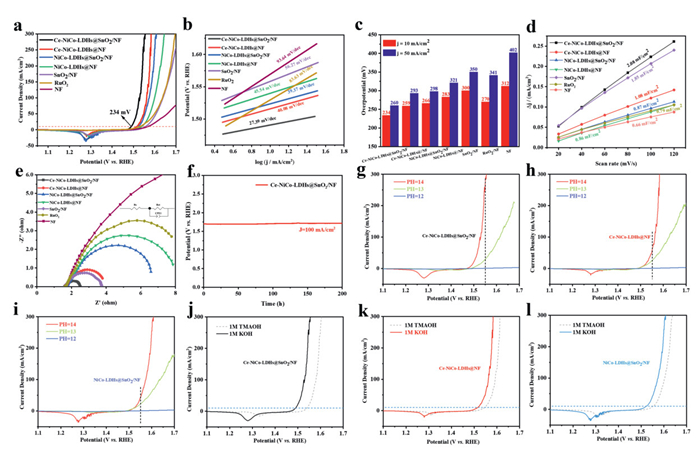
The electrochemical performance of the samples was firstly examined via linear sweep voltammetry (LSV). As illustrated in Fig. 3a, Ce-NiCo-LDHs@SnO2/NF has the best OER performance (η10 = 234 mV), which is superior to Ce-NiCo-LDHs@NF (η10 = 259 mV), NiCo-LDHs@SnO2/NF (η10 = 266 mV), NiCo-LDHs@NF (η10 = 283 mV), SnO2/NF (η10 = 300 mV), RuO2/NF (η10 = 270 mV) and NF (η10 = 312 mV). Likewise, Ce-NiCo-LDHs@SnO2/NF also demonstrates the minimal overpotential of 260 mV at 50 mA/cm2 (Fig. 3c). As a comparison, other catalysts require 293 mV (Ce-NiCo-LDHs@NF), 298 mV (NiCo-LDHs@SnO2/NF), 321 mV (NiCo-LDHs@NF), 350 mV (SnO2/NF), 341 mV (RuO2/NF) and 402 mV (NF) to reach a current density as high as 50 mA/cm2 (Fig. 3c). As a result, the main catalyst Ce-NiCo-LDHs@SnO2/NF has the most outstanding OER performance. In Fig. 3b, the measurement results show that the Tafel slope of Ce-NiCo-LDHs@SnO2/NF is the lowest, which is 27.39 mV per decade. Comparatively, the Tafel slope of Ce-NiCo-LDHs@NF, NiCo-LDHs@SnO2, NiCo-LDHs@NF, SnO2/NF, and NF are 40.08, 39.37, 45.54, 56.27, 83.63 and 93.64 mV/dec, in the same order. The results show that the dense floral nanosheet structure of Ce-NiCo-LDHs@SnO2/NF can provide a larger specific surface area [21], thereby enhancing its reaction kinetics. Besides, the synergistic effect of multi-metal leads to the redistribution of electrons in the catalyst, accelerates the proton transfer process in the electrochemical reaction, and improves the intrinsic activity of the catalyst. After cyclic voltammetry (CV) scanning (Figs. S5b and S7 in Supporting information) in the non-Faraday region of the synthesized electrode material (Fig. 3d), the Cdl (double-layer capacitance) of the electrode material can be obtained by further processing the data obtained. As illustrated in Fig. 3d, the Cdl value assessed for Ce-NiCo-LDHs@SnO2/NF is 2.08 mF/cm2, which is much greater than the Cdl value of Ce-NiCo-LDHs@NF (1.08 mF/cm2), NiCo-LDHs@SnO2/NF (0.87 mF/cm2), NiCo-LDHs@NF (0.86 mF/cm2), SnO2/NF (1.85 mF/cm2), RuO2 (0.79 mF/cm2) and NF (0.66 mF/cm2). The Cdl value is positively correlated with the electrochemical active surface area (ECSA) value, so the larger the Cdl value, the larger the ECSA value. As a result, the main catalyst Ce-NiCo-LDHs@SnO2/NF has the largest ECSA value. Interestingly, the results show that the ECSA value of the SnO2/NF electrode is relatively high, indicating its ability to provide a greater abundance of active sites. However, given the low activity of SnO2/NF in OER and not all active centers are conducive to the OER, its electrochemical performance is relatively poor. The larger ECSA value is because SnO2 possesses excellent electron transport capabilities, which are conducive to the creation of an enhanced ECSA. Furthermore, the heterostructure formed by SnO2 and NiCo-LDHs is also beneficial to the enlargement of ECSA value for their synergistic effect. Apart from reaction kinetics and ECSA value, the charge transfer capability is also an important factor in evaluating electrode electrochemical properties. Electrochemical impedance spectroscopy (EIS) was performed to comparing the charge transfer resistance (Rct) of the above electrode materials. As depicted in Fig. 3e, Ce-NiCo-LDHs@SnO2/NF has the smallest radius of a semicircle, which is much smaller than other catalysts. This result shows that it has the fastest electron transfer kinetics. As shown in Table S1 (Supporting information), the main catalyst Ce-NiCo-LDHs@SnO2/NF exhibits the smallest Rs (solution exesistance) and Rct values, which further demonstrate its superior kinetic performance. Notably, SnO2/NF exhibits a smaller semicircle, proving that it has a smaller charge transfer impedance, confirming the good electron transport ability of the SnO2 layer. Also, a comparison of the Nyquist plots of NF and SnO2/NF (Fig. S4c in Supporting information) reveals that the presence of SnO2 can accelerate electron transfer. In order to study the stability of electrode materials, chronopotentiometry (CP) test was performed on it. As presented in Fig. 3f, the Ce-NiCo-LDHs@SnO2/NF electrode shows remarkable potential stability, maintaining consistent performance over 200 h of OER testing. Also, in chronoamperometry (CA) test (Fig. S10 in Supporting information), the catalyst can maintain a current density of approximately 11 mA/cm² for 15 h when the initial potential is set at 0.48 V. To further investigate the stability of the catalyst, we did a comparison of the catalyst before and after 2000 cycles of CV scanning, as shown in Fig. S11a (Supporting information), the catalyst after testing showed similar performance in LSV as the catalyst before testing. Figs. S11b and c (Supporting information) demonstrates the SEM and TEM images of the catalyst after testing, indicating that the catalyst possesses good stability. Additionally, we have utilized inductively coupled plasma (ICP) technology to measure the content of the doped atom Ce in the material before and after the OER process [40]. As shown in Table S3 (Supporting information), the atomic percentage of Ce remains virtually unchanged before and after the reaction. This indicates the remarkable stability of the material. Moreover, the measured value of 1.58% is in excellent agreement with the 1.6% (Fig. S5a in Supporting information) obtained from EDS measurements. Also, The XPS spectra of the samples after testing indicate that Ni and Co, particularly Co, play a crucial role in the reaction, with significant changes observed in the XPS spectra of Ni and Co (Figs. S12a-e in Supporting information). The content of the higher-valent M3+ (where M = Ni, Co) significantly increases, and the peak positions shift positively. The presence of high-valent metal ions is conducive to shifting the OER mechanism towards the lattice oxygen evolution mechanism (LOM). This is because high-valent metal ions can modulate the covalency of metal-oxygen bonds, facilitating the activation of lattice oxygen and leading to non-concerted proton-electron transfer [63,64]. Moreover, the formation of high-valent ions reflects changes in the electronic structure of the catalyst, thereby promoting the LOM. Regarding the impact of high-valent ions on catalytic activity, we calculated the turnover frequency (TOF) values [2,65] for each material (Figs. S18 and S19 in Supporting information). Ce-NiCo-LDHs@SnO2/NF consistently exhibited the highest TOF across various potentials. This indicates its superior intrinsic activity. The Ce 3d peak shifted positively and the Sn 3d peak shifted negatively after testing, which is consistent with previous studies on the effects of Ce and Sn on electron flow. This further demonstrates that Ce doping and the introduction of the SnO2 layer have a modulating effect on the electronic structure of the catalyst. To further investigate the changes in the crystal structure of the catalyst before and after the reaction, the XRD patterns of the samples after CV testing were obtained (Fig. S13 in Supporting information). After multiple cycles of CV scanning, the peak intensities of the samples were significantly weakened, indicating that a crystalline phase transformation had occurred. To further verify the mechanism, we conducted electrochemical measurements. Because the LOM is known to be highly pH-dependent [66], we varied the KOH electrolyte concentration to investigate the catalytic performance of the materials. As shown in Figs. 3g-i and Figs. S14a and b (Supporting information), the materials exhibit a pronounced response to pH changes. The influence of pH on OER activity can be quantified using the equation: ρ = (∂logj/∂pH) [67,68], where ρ represents the proton reaction order. A larger ρ value indicates a stronger pH dependence of the catalytic activity. As shown in Fig. S15 (Supporting information), Ce-NiCo-LDHs@SnO2/NF exhibits the largest ρ value of 1.28, indicating that its OER activity is the most sensitive to pH variations. In addition, the participation of oxide (O2-) and peroxide (O22-) intermediates in the LOM process renders tetramethylammonium cations (TMA⁺) a suitable indicator for detecting O22-. Because of the strong interaction between TMA+ and O22-, the presence of TMA⁺ suppresses the LOM pathway, consequently leading to a decrease in OER catalytic activity [69]. Therefore, we replaced KOH with 1 mol/L TMAOH (tetramethylammonium hydroxide) to evaluate the catalytic activity. As shown in Figs. 3j-l and Figs. S14c and d (Supporting information), Ce–NiCo-LDHs@SnO2/NF exhibits the most pronounced decrease in activity. These results confirm that Ce–NiCo-LDHs@SnO2/NF operates via the LOM. Compared with other reported NiCo-based catalysts (Table S2 in Supporting information), Ce-NiCo-LDHs@SnO2/NF also exhibits promising activity [34–36,70–76]. To further optimize the experimental protocol, we varied the amount of Ce(NO3)3·6H2O to 6 mg and 18 mg and compared their electrochemical performance with the original 12 mg-doped sample (Fig. S20 in Supporting information). The results indicate that using 12 mg of Ce(NO3)3·6H2O for doping is optimal. The amount of doped atoms significantly influences the catalytic activity of the material.
Figure 3
Figure 3.
(a) Reverse scanning LSV curves, (b) Tafel plots, (c) overpotentials corresponding to current densities of 10 and 50 mA/cm2, (d) Cdl values and (e) Nyquist plots of Ce-NiCo-LDHs@SnO2/NF, Ce-NiCo-LDHs@NF, NiCo-LDHs@SnO2/NF, NiCo-LDHs@NF, SnO2/NF, RuO2 and NF. (f) CP test of Ce-NiCo-LDHs@SnO2/NF. (g-i) LSV curves in different PH environment and (j-l) LSV curves in 1 mol/L TMAOH and 1 mol/L KOH.
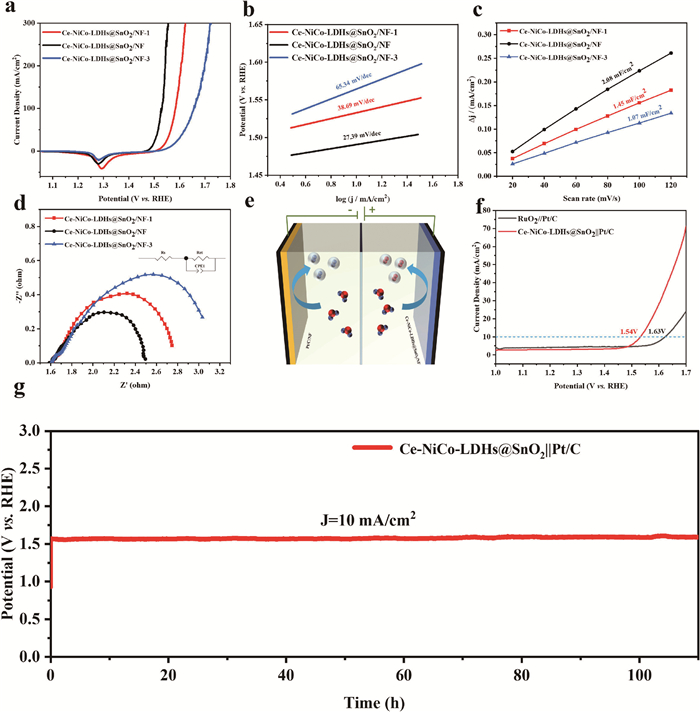
In this work, we have also specifically investigated the effect of the hydrothermal reaction time on the synthesis of the primary catalyst Ce-NiCo-LDHs@SnO2/NF. By means of changing the hydrothermal synthesis time in the second step to 1 and 3 h, the resulting catalysts are denoted as Ce-NiCo-LDHs@SnO2/NF-1 and Ce-NiCo-LDHs@SnO2/NF-3, respectively. As shown in Fig. 4a and Fig. S8 (Supporting information), the Ce-NiCo-LDHs@SnO2/NF catalyst requires an overpotential that is 42 and 72 mV lower than that of Ce-NiCo-LDHs@SnO2/NF-1 and Ce-NiCo-LDHs@SnO2/NF-3 respectively to achieve a current density of 10 mA/cm2. Additionally, the overpotential of Ce-NiCo-LDHs@SnO2/NF is also the smallest (Fig. S8 in Supporting information) when the current density reaches 50 mA/cm2. What is more, Ce-NiCo-LDHs@SnO2/NF owns the smallest Tafel slope value (Fig. 4b), the largest Cdl (Fig. 4c) value and the smallest radius (Fig. 4d) in the EIS Nyquist plot. Additionally, SEM images (Figs. S9a-c in Supporting information) of the products synthesized at different reaction times reveal that a reaction time of 1 h is insufficient to form complete flower-like structures, whereas a reaction time of 3 h tends to disrupt these structures. Similarly, TEM images (Figs. S9d-f in Supporting information) show that only a reaction time of 2 h yields relatively intact, thin-sheet-like structures. These results indicate that 2 h is the best reaction time.
Figure 4
Figure 4.
(a) Reverse scanning LSV curves, (b) Tafel plots, (c) CV values and (d) Nyquist plots of Ce-NiCo-LDHs@SnO2/NF-1, Ce-NiCo-LDHs@SnO2/NF and Ce-NiCo-LDHs@SnO2/NF-3. (e) Schematic diagram of electrochemical water decomposition. (f) LSV curves for OWS. (g) CP test for Ce-NiCo-LDHs@SnO2/NF//Pt/C/NF.
To learn more, we also performed OWS tests using a dual-electrode apparatus with Ce-NiCo-LDHs@SnO2 (anode) and Pt/C (cathode) (Fig. 4e). Compared to RuO2||Pt/C (1.63 V), Ce-NiCo-LDHs@SnO2||Pt/C exhibits excellent performance for OWS, requiring just 1.54 V to attain a current density of 10 mA/cm2 (Fig. 4f). In addition, after 100 h of CP testing, the electrode pair Ce-NiCo-LDHs@SnO2||Pt/C was still able to operate stably for the OWS (Fig. 4g). As a result, Ce-NiCo-LDHs@SnO2/NF has excellent OWS performance and stability. Electrochemical tests indicate that the catalyst synthesized with a reaction time of 2 h exhibits the optimal OER activity. Additionally, the Faraday efficiency measured in the experiment was 98.9% (Figs. S17 and S18).
In this study, we successfully synthesized Ce-NiCo-LDHs@SnO2/NF by the strategies of Ce doping and modifying NF by SnO2. The dense nano-floral structure of Ce-NiCo-LDHs, resulting from Ce doping, significantly enhances the contact area between the catalyst and the alkaline electrolyte. Meanwhile, the presence of SnO2 layer accelerates the electron transport rate and change the size of catalyst. In addition, the interaction between SnO2 and Ce-NiCo-LDHs changes the electron distribution and improves the OER activity, and is experimentally verified to follow the LOM. Ce-NiCo-LDHs@SnO2/NF demonstrates excellent catalytic performance and stability, exhibiting an overpotential of only 234 mV and a Tafel slope of only 27.39 mV/dec for OER at a current density of 10 mA/cm2. Notably, the potential of the synthesized catalyst remains stable after over 200 h of OER testing in an alkaline solution. In OWS test, coupling the Ce-NiCo-LDHs@SnO2/NF with Pt/C/NF, only 1.54 V of external voltage is needed to facilitate the reaction, and this system for OWS also exhibits superior stability. This work explores the synthesis of OER electrode materials using non-noble metal Ce doping and the incorporation of semiconductor material SnO2, providing an innovative approach for the fabrication of OER catalytic electrode materials.
Declaration of competing interest
The authors declare that they have no known competing financial interests or personal relationships that could have appeared to influence the work reported in this paper.
Y. Xiao, P. Zhang, X. Zhang, et al., J. Mater. Chem. A 5 (2017) 15901–15912. doi: 10.1039/C7TA03629A
Figure 1
(a) Schematic diagram of the synthesis of SnO2/NF and Ce-NiCo-LDHs@SnO2/NF. SEM images of (b, c) SnO2/NF, (d, e) NF, (f) NiCo-LDHs@NF, (g) NiCo-LDHs@SnO2/NF and (h) Ce-NiCo-LDHs@SnO2/NF. (i) TEM image, (j) HRTEM image and (k) SAED image of Ce-NiCo-LDHs@SnO2/NF. (l) HAADF-TEM image and (m-q) EDS mapping images of Ce-NiCo-LDHs@SnO2/NF.
Figure 2
(a) XRD patterns of Ce-NiCo-LDHs@/NF, NiCo-LDHs@SnO2/NF, Ce-NiCo-LDHs@SnO2/NF. (b) XRD pattern of Ce-NiCo-LDHs@SnO2/NF powder. (c) Ni 2p, (d) Co 2p XPS spectra of Ce-NiCo-LDHs@/NF, Ce-NiCo-LDHs@SnO2/NF and NiCo-LDHs@SnO2/NF. (e) Ce 3d XPS spectra of Ce-NiCo-LDHs@NF and Ce-NiCo-LDHs@SnO2/NF. (f) Sn 3d XPS spectra of Ce-NiCo-LDHs@SnO2/NF and NiCo-LDHs@SnO2/NF.
Figure 3
(a) Reverse scanning LSV curves, (b) Tafel plots, (c) overpotentials corresponding to current densities of 10 and 50 mA/cm2, (d) Cdl values and (e) Nyquist plots of Ce-NiCo-LDHs@SnO2/NF, Ce-NiCo-LDHs@NF, NiCo-LDHs@SnO2/NF, NiCo-LDHs@NF, SnO2/NF, RuO2 and NF. (f) CP test of Ce-NiCo-LDHs@SnO2/NF. (g-i) LSV curves in different PH environment and (j-l) LSV curves in 1 mol/L TMAOH and 1 mol/L KOH.
Figure 4
(a) Reverse scanning LSV curves, (b) Tafel plots, (c) CV values and (d) Nyquist plots of Ce-NiCo-LDHs@SnO2/NF-1, Ce-NiCo-LDHs@SnO2/NF and Ce-NiCo-LDHs@SnO2/NF-3. (e) Schematic diagram of electrochemical water decomposition. (f) LSV curves for OWS. (g) CP test for Ce-NiCo-LDHs@SnO2/NF//Pt/C/NF.


 DownLoad:


 下载:
下载:


 下载:
下载:
