Received Date:
26 June 2025 Accepted Date:
07 September 2025 Revised Date:
06 September 2025 Available Online:
15 August 2026
Abstract:
Hydrogen sulfide (H2S), a gaseous signaling molecule with diverse biological functions, exhibits abnormal concentrations that are closely associated with arthritic pathogenesis and serve as a characteristic indicator of protein-rich food spoilage. To address the need for reliable H2S detection, this study developed a novel fluorescent probe, BHP-PC, by rationally integrating methylene blue and benzothiazole fluorophores. The probe demonstrates remarkable spectral separation (215 nm) and high selectivity, enabling simultaneous monitoring of fluorescence signals in both blue (detection limit: 12.5 nmol/L) and red (detection limit: 22.6 nmol/L) channels for highly sensitive H2S quantification. BHP-PC exhibits excellent dual-color imaging capabilities in both cellular and zebrafish models. The distinct colorimetric response facilitated the successful development of test strips for practical H2S detection in spoiled proteinaceous samples. Furthermore, the probe’s application in a λ-carrageenan-induced murine arthritis model enabled real-time H2S visualization, demonstrating its potential as an analytical tool for arthritis diagnosis and therapeutic monitoring.
Hydrogen sulfide (H2S) is a colorless, flammable gaseous molecule with multiple characteristics [1–4]. It functions not only as a crucial biological signaling molecule involved in various physiological processes but also serves as an environmental pollutant and an indicator of food spoilage [5,6]. Within biological systems, H2S is the third endogenous gaseous signaling molecule following nitric oxide (NO) and carbon monoxide (CO) [7–9]. It is primarily generated in the cytoplasm and mitochondria through the catalytic actions of enzymes such as cystathionine β-synthase (CBS), cystathionine γ-lyase (CSE), and 3-mercaptopyruvate sulfurtransferase (3-MST) [10–13]. H2S plays a significant role in physiological processes like vasodilation and maintenance of cellular redox balance, and its abnormal concentrations are associated with a variety of diseases, including inflammation, myocardial injury, liver cirrhosis, and cardiovascular diseases [14,15]. Arthritis, a common chronic inflammatory disease, is characterized by joint redness, swelling, pain, and later functional impairment or even deformity. If left untreated, arthritis can significantly impact the quality of life of patients. Research has shown that abnormal levels of H2S are closely related to the pathological process of arthritis [16–18]. Additionally, in the food industry, H2S mainly originates from the degradation of sulfur-containing amino acids by sulfur bacteria and serves as a characteristic indicator of spoilage in protein-rich foods [19–23]. Given the importance of H2S in biological systems and the food industry, the development of sensitive and selective H2S detection methods is of great significance for food quality control, disease diagnosis, and treatment.
Among various detection strategies, fluorescent probes have garnered extensive attention due to their favorable biocompatibility, capability of real-time monitoring, and non-invasive nature. These attributes have facilitated their successful application in the detection of bioactive molecules and in bioimaging [24–26]. To date, a variety of fluorescent probes for H2S detection have been developed, yet the majority are confined to single-channel designs (Table S1 in Supporting information). While these single-channel probes offer advantages such as ease of operation, intuitive signaling, and low cost, they are also subject to inherent limitations [27–31]. For instance, single-channel probes can only provide fluorescence signals in one channel, lacking a comparative signal, which makes them prone to generating false-positive results. Moreover, they are susceptible to interference from the intrinsic fluorescence of samples and various environmental factors, such as changes in pH, temperature, or light intensity, leading to high background noise in complex biological samples. In light of these limitations, dual-channel fluorescent probes not only effectively circumvent the aforementioned defects but also enhance detection sensitivity and accuracy through mutual calibration of signals from two independent channels. For example, when one channel is affected by environmental factors, the other channel can serve as a reference for correction [32–34]. Therefore, the development of high-performance dual-channel fluorescent probes remains an important research direction.
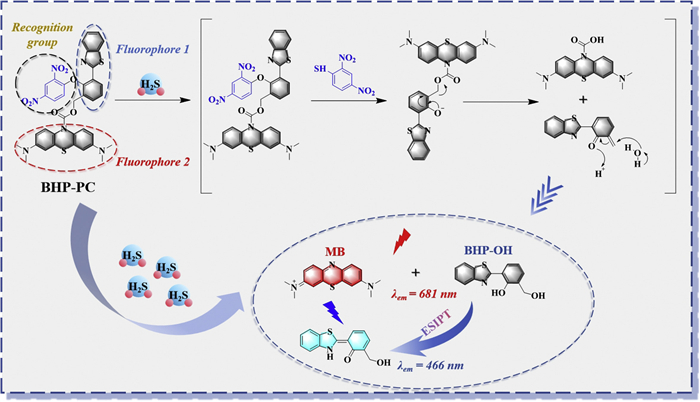
In light of the aforementioned considerations, the 2,4-dinitrophenyl ether was selected as the recognition group, and benzothiazole and methylene blue were employed as potential blue and near-infrared fluorophores, respectively, to construct a novel dual-channel fluorescent probe, BHP-PC (Scheme 1 and Scheme S1 in Supporting information). The probe exhibits a significant spectral separation of 215 nm between its two channels. Upon reaction with H2S, the probe generates detectable fluorescence signals in both channels. This dual-channel detection method enables high-sensitivity monitoring of H2S concentration changes through mutual calibration of signals from both channels. Attributable to its distinctive configuration, BHP-PC has demonstrated exceptional dual-color imaging capabilities in both cellular and zebrafish models. Notably, due to the pronounced color change before and after the reaction, BHP-PC has been successfully formulated into test strips for the detection of H2S gas produced by spoilage in various protein-rich samples, such as shrimp, chicken, beef, and pork. Moreover, with the methylene blue moiety emitting in the near-infrared region, the probe’s real-time imaging capabilities for H2S levels in a mouse model of arthritis induced by λ-carrageenan were further explored, yielding satisfactory results. This work thus provides a potential analytical tool for the future diagnosis of arthritis.
Scheme 1
Scheme 1.
The mechanism of action of fluorescent probe BHP-PC with H2S: (1) H2S cleaves the 2,4-dinitrophenyl ether recognition group; (2) ESIPT is activated in the benzothiazole moiety, emitting blue fluorescence (λem = 466 nm); (3) Methylene blue (MB) is released, restoring red fluorescence (λem = 681 nm).
Compound 3, which retains the benzothiazole fluorophore and 2,4-dinitrophenyl ether recognition group, exhibits a fluorescence response to H2S consistent with the excited-state intramolecular proton transfer (ESIPT) activation mechanism. In its unreacted state, the 2,4-dinitrophenyl ether moiety suppresses ESIPT, resulting in low background fluorescence. Upon reaction with H2S, cleavage of the recognition group restores the phenolic proton donor, reactivating ESIPT and inducing a pronounced blue fluorescence enhancement (λem = 466 nm), mirroring the blue channel behavior of BHP-PC.
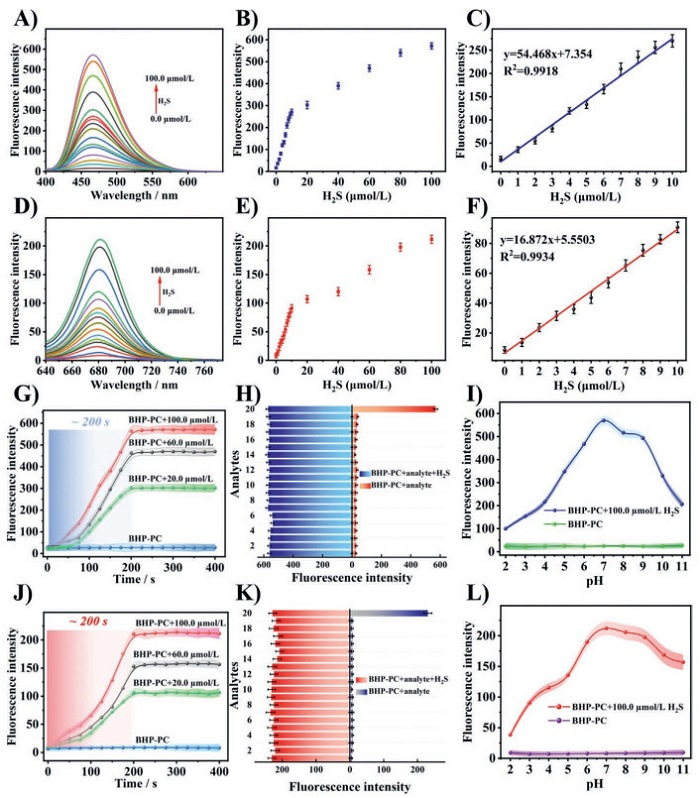
To systematically evaluate the spectroscopic characteristics of the probe towards H2S, the ultraviolet (UV)-visible absorption and fluorescence spectral responses of BHP-PC in phosphate-buffered saline buffer (PBS/CH3CN, 8:2, v/v, 50.0 mmol/L, pH 7.4) were systematically investigated. As shown in Fig. S1 (Supporting information), the absorbance at 353 and 663 nm increased progressively with escalating H2S concentration, signifying the concurrent formation of the two fluorophores (benzothiazole and methylene blue). For fluorescence spectra, upon addition of H2S, two characteristic emission peaks appeared at 466 and 681 nm under excitation at 350 and 600 nm, respectively. The fluorescence intensity exhibited a strictly concentration-dependent enhancement as the H2S concentration increased from 0 to 100.0 µmol/L, with increases of 34- and 24-fold, respectively (Figs. 1A and D). Moreover, the signal intensities at 466 and 681 nm showed good linear relationships with H2S concentration in the range of 0–10.0 µmol/L (R2 = 0.9918 and 0.9934, respectively). Based on the limit of detection (LOD) formula LOD = 3δ/k, the probe achieved low detection limits (blue channel: 12.5 nmol/L, red channel: 22.6 nmol/L), highlighting BHP-PC’s capability for sensitive detection of trace H2S (Figs. 1B, C, E and F).
Figure 1
Figure 1.
(A, D) Fluorescence spectra of probe BHP-PC (10.0 µmol/L) in PBS buffer (PBS/CH3CN, 8:2, v/v, 50.0 mmol/L, pH 7.4) upon reaction with 0.0–100.0 µmol/L H2S (A: λex = 350 nm, EX: 3.0 nm, EM: 5.0 nm; D: λex = 600 nm, EX: 3.0 nm, EM: 10.0 nm). (B, E) Scatter plots of fluorescence intensity of probe BHP-PC at 466 nm (B) and 681 nm (E) versus H2S concentration (0.0–100.0 µmol/L). (C, F) Linear relationship between fluorescence intensity of probe BHP-PC (10.0 µmol/L) and H2S concentration (0.0–10.0 µmol/L). (G, J) Time-dependent fluorescence intensity changes of BHP-PC (10.0 µmol/L) at 466 nm (G) and 681 nm (J) in response to H2S at concentrations of 0.0, 20.0, 60.0, and 100.0 µmol/L. (H, K) Fluorescence intensity response of probe BHP-PC (10.0 µmol/L) to various analytes (analytes 1–20 were tested at 100 µmol/L: 1. Mg2+, 2. Ca2+, 3. Mn2+, 4. Cu2+, 5. Al3+, 6. K+, 7. Zn2+, 8. Br−, 9. Cl−, 10. SO32−, 11. HCO3−, 12. SO42−, 13. HSO4−, 14. Hcy, 15. GSH, 16. Cys, 17. H2O2, 18. ClO−, 19. ONOO−, 20. H2S), and the selectivity of BHP-PC (10.0 µmol/L) for H2S in the presence of competing analytes. (I, L) Fluorescence intensity of probe BHP-PC (10.0 µmol/L) at 466 nm (I) and 681 nm (L) upon reaction with 100 µmol/L H2S across the pH range of 2.0–11.0. n = 3, error bars were ±SD.
The discrepancy in detection limits between the two channels is attributed to differences in fluorescence enhancement folds and background interference in their respective spectral regions. The blue channel (benzothiazole-derived) exhibits a 34-fold fluorescence enhancement upon reaction with H2S, which is significantly higher than the 24-fold enhancement of the red channel (methylene blue-derived) (Figs. 1A and D). This greater signal amplification improves the blue channel’s ability to detect trace H2S. Additionally, the blue channel emits at 466 nm, a spectral range with lower background interference, resulting in a higher signal-to-noise ratio. In contrast, the red channel emits at 681 nm, which is more susceptible to background scattering, leading to relatively higher baseline noise and a higher LOD. These factors collectively contribute to the lower detection limit in the blue channel.
All analytes, including metal ions (Mg2+, Ca2+, Mn2+, Cu2+, Al3+, K+, Zn2+), anions, biothiols, and reactive oxygen species, were tested at a concentration of 100 µmol/L. Notably, common metal ions did not interfere with H2S detection: Mg2+, Ca2+, Mn2+, and K+ showed no significant effect on fluorescence, as they do not interact strongly with the benzothiazole moiety to disrupt its ESIPT process. While Cu2+ and Al3+ have been reported to potentially quench ESIPT via chelation in other systems, the steric configuration of BHP-PC prevents such interactions here. Similarly, Zn2+, which can enhance ESIPT in some fluorophores, did not alter the probe’s response, underscoring BHP-PC’s structural robustness for selective H2S detection. Moreover, interference resistance experiments indicated that even when H2S coexisted with other interfering substances in the same system, these substances did not affect the probe’s selective detection of H2S. In both channels, the probe still exhibited a strong fluorescence signal for H2S (Figs. 1H and K). The results demonstrate the potential utility of the probe for tracking H2S in complex biological environments.
To further validate compatibility with cellular imaging conditions, we assessed the probe’s response to H2S under 405 nm excitation. Under these conditions, BHP-PC still exhibits a concentration-dependent fluorescence enhancement at 466 nm, with a 28-fold increase at 100 µmol/L H2S. It confirms that the blue channel retains high sensitivity to H2S under 405 nm excitation, supporting its applicability in cellular imaging (Fig. S2 in Supporting information).
The capacity for real-time detection and functionality within physiological pH environments is also crucial indicators for evaluating the biological application potential of a probe. Therefore, we assessed the probe’s temporal response to H2S and its adaptability across different pH conditions through fluorescence titration experiments. The results indicated that upon the addition of H2S at varying concentrations (20.0, 60.0 and 100.0 µmol/L), the fluorescence intensity of probe BHP-PC in both detection channels rapidly increased and stabilized within 200 s (Figs. 1G and J). Additionally, within a certain pH range (2.0–11.0), probe BHP-PC exhibited no significant changes in fluorescence intensity under strongly acidic or basic conditions, demonstrating its robust optical stability. However, following the introduction of H2S, a pronounced enhancement in fluorescence intensity was observed within the physiologically relevant pH range of 6.0–9.0 (Figs. 1I and L). These findings confirm that probe BHP-PC can rapidly detect H2S under a variety of physiological conditions.
Based on the spectroscopic data from the aforementioned experiments, a response mechanism for probe BHP-PC towards H2S has been proposed (Scheme 1). In its initial state, the probe’s intramolecular ESIPT process within the benzothiazole structure is effectively inhibited due to the presence of the recognition group (2,4-dinitrophenyl ether), resulting in the suppression of fluorescence emission in the blue channel. Concurrently, the conjugated structure of the methylene blue moiety is disrupted, significantly weakening its near-infrared fluorescence emission capability. As a result, probe BHP-PC exhibits no significant fluorescence emission signals in either channel. Upon specific reaction with H2S, the 2,4-dinitrophenyl ether group undergoes cleavage due to the strong nucleophilic nature of H2S, simultaneously triggering the rupture of the self-elimination group. This dual process releases both fluorescent moieties, thereby generating blue and red fluorescence. The proposed response mechanism was initially verified by determining the molecular weights of the reaction products through high-resolution mass spectrometry (HRMS). As shown in Fig. S12 (Supporting information), following the interaction of probe BHP-PC with H2S, two distinct product peaks appeared in the mass spectrum, corresponding to compounds MB (C16H18N3S+, theoretical m/z: 284.1216, observed m/z: 284.1214) and BHP-OH (C14H11NO2S, [M + H]+, theoretical m/z: 258.0589, observed m/z: 258.0583). Additionally, high-performance liquid chromatography (HPLC) analysis was employed to further investigate the reaction of probe BHP-PC with H2S, thereby providing additional evidence for the proposed mechanism. As depicted in Fig. S3 (Supporting information), the chromatogram of probe BHP-PC initially displayed a single major peak with a retention time of 8.43 min. After reacting with 10.0 equiv. of H2S, two new signal peaks emerged at retention times of 2.40 and 3.80 min, matching the retention times of the standards MB and BHP-OH, respectively. These results indicate that H2S can cleave the 2,4-dinitrophenyl ether group of the probe, releasing both MB and BHP-OH fluorophores simultaneously.
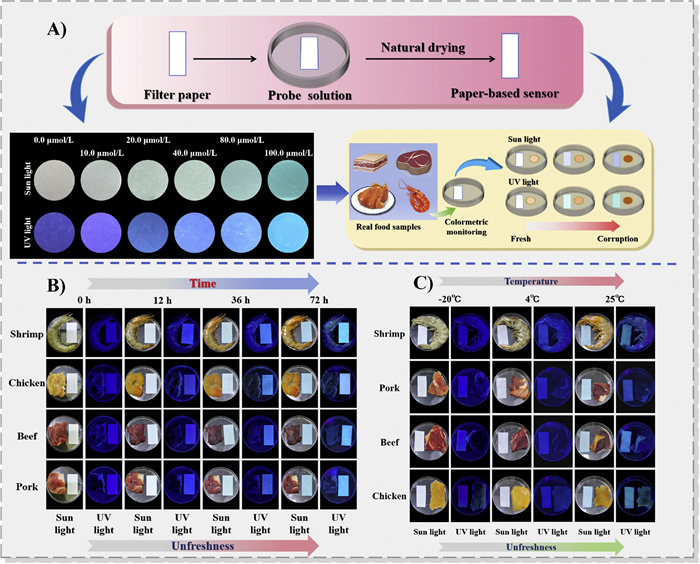
Given that the benzothiazole moiety of probe BHP-PC emits blue fluorescence upon excitation at 365 nm and the methylene blue component undergoes a color change from colorless to blue under naked-eye observation, we have developed a portable test strip containing probe BHP-PC for the rapid and convenient detection of H2S. When these test strips are immersed in solutions containing various concentrations of H2S (10.0, 20.0, 40.0, 80.0 and 100.0 µmol/L) for 5 min and then dried, they exhibit distinct blue fluorescence under 365 nm excitation. Visual inspection revealed that the test strip color gradually turned blue, with the intensity of the color increasing in proportion to the concentration of H2S (Fig. 2A). The BHP-PC-based test strips detect gaseous H2S released from spoiled protein-rich foods. During the experiments, food samples (shrimp, chicken, beef, pork) were placed in sealed petri dishes with the test strips, allowing gaseous H2S generated by bacterial decomposition of sulfur-containing amino acids to diffuse into the headspace and react with the probe. This setup directly reflects real-world storage conditions, where gaseous H2S is a characteristic marker of spoilage, ensuring the practical relevance of the detection method. The background fluorescence observed in Figs. 2B and C originates from light scattering by moist food tissues and weak autofluorescence of microbial metabolites, which are distinct from the test strip signals. The test strips exhibit spatially confined, concentration-dependent blue fluorescence (λem = 466 nm) that is absent in probe-free controls, confirming the enhancement is specific to H2S reaction rather than background interference. The spatial specificity of the strip signals, distinct from the diffuse background, further validates the reliability of the detection.
Figure 2
Figure 2.
Test strips detect gaseous H2S released from food samples during spoilage, with color changes induced by headspace H2S diffusion. (A) The preparation process of the portable test strip based on fluorescent probe BHP-PC and its schematic diagram for monitoring the food spoilage process, as well as the color changes of the BHP-PC test strip (10.0 µmol/L) under natural light and 365 nm UV irradiation when exposed to different concentrations of H2S (0.0, 10.0, 20.0, 40.0, 80.0, and 100.0 µmol/L). (B) Color changes of BHP-PC test strips under natural light and 365 nm UV irradiation for shrimp, chicken, beef, and pork at different time intervals (0, 12, 36, and 72 h) at 25 ℃. (C) Color changes of BHP-PC test strips under natural light and 365 nm UV irradiation for shrimp, chicken, beef, and pork after storage for 72 h at different temperatures (−20, 4, and 25 ℃).
A multitude of studies have indicated that protein-rich foods generate H2S during spoilage as a result of bacterial decomposition [35,36]. Building on the aforementioned test strip experiments with the probe, we employed probe-loaded test strips to assess the freshness of shrimp, chicken, beef, and pork under varying conditions. In the time-course experiment, we monitored the changes in the test strip color under both fluorescence and naked-eye observation at different time points. The results revealed that, over time, the test strips transitioned from colorless to blue under daylight, with the color intensity increasing progressively. Concurrently, in all petri dishes, the fluorescence evolved from no fluorescence to a pronounced blue fluorescence (Fig. 2B). In the temperature group experiment, the test strips were placed in petri dishes containing food samples and stored for 72 h at different temperatures (−20, 4 and 25 ℃). Subsequent observations under daylight and 365 nm UV light indicated that the test strips in the petri dishes stored at 25 ℃ exhibited significant color changes. In contrast, the fluorescence changes in the test strips stored at −20 and 4 ℃ were minimal (Fig. 2C). These findings demonstrate that the probe can effectively monitor H2S production during food spoilage and serves as a potential tool for assessing the freshness of raw meats.
Notably, the fluorescence color change of BHP-PC test strips is specifically induced by H2S, with no interference from alkaline amine gases (e.g., NH3) released during food spoilage. Selectivity experiments confirm that the probe exhibits no significant response to amine-related interferents (Figs. 1H and K, Fig. S4 in Supporting information), even at concentrations comparable to those generated in spoilage. Additionally, pH-dependent studies (Figs. 1I and L) show that the probe’s ESIPT process is not activated by weakly alkaline conditions (pH 7.5–9.0, typical of spoilage environments) alone; fluorescence enhancement occurs exclusively upon reaction with H2S, ensuring specific detection of H2S in complex food spoilage systems.
The test strips leverage the dual-channel nature of BHP-PC through two complementary readouts: Blue fluorescence intensity under 365 nm UV light and visible blue coloration under natural light. Both readouts exhibit concentration-dependent changes with H2S (Fig. 2A), enabling mutual calibration. For example, fluctuations in UV light intensity affecting fluorescence can be validated by the stable colorimetric signal, ensuring reliable detection, thus retaining the core advantage of dual-channel detection in a portable format.
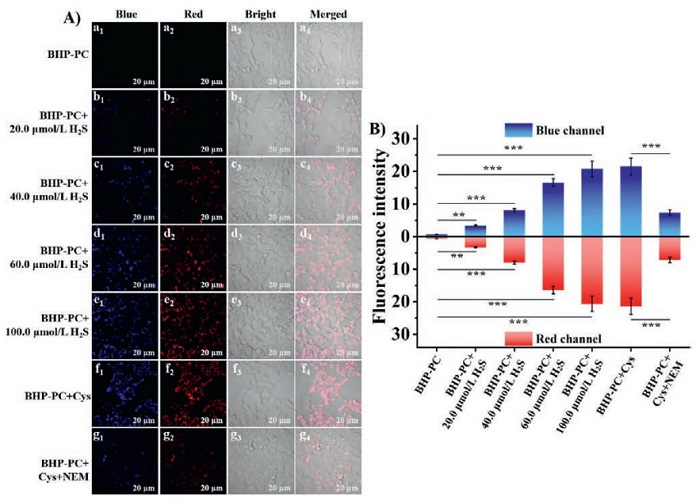
Biocompatibility is a crucial factor in determining the suitability of fluorescent probes for in vivo imaging applications. To validate the reliability of the probe for biological applications, its capacity to detect H2S at the cellular level was initially assessed. The cytotoxicity of probe BHP-PC towards HeLa cells was evaluated using the MTT assay. As illustrated in the Fig. S5 (Supporting information), even at a relatively high concentration of 50.0 µmol/L, the cell viability remained around 85%, indicating that the cytotoxicity of probe BHP-PC towards HeLa cells is negligible, thereby providing a reliable foundation for subsequent cellular experiments. Based on the low cytotoxicity demonstrated in the aforementioned experiments, the probe’s ability to detect exogenous and endogenous H2S in HeLa cells was further explored using confocal laser scanning microscopy. The results showed that HeLa cells incubated solely with probe BHP-PC exhibited weak fluorescence signals. However, upon the addition of H2S, significant fluorescence signals emerged in both channels, with the fluorescence intensity increasing as the concentration of H2S increased. This indicates that probe BHP-PC is capable of tracking changes in the levels of exogenous H2S in living cells (Fig. 3A, a1–e4).
Figure 3
Figure 3.
Detection of exogenous and endogenous H2S in HeLa cells by the fluorescent probe BHP-PC. (A) (a1–a4) HeLa cells were incubated with the probe (10.0 µmol/L) for 30 min. (b1–e4) HeLa cells were incubated with 20.0, 40.0, 60.0, and 100.0 µmol/L H2S for 30 min, followed by incubation with probe BHP-PC (10.0 µmol/L) for an additional 30 min. (f1–f4) HeLa cells were stimulated with 100 µmol/L Cys for 2 h and subsequently incubated with 10.0 µmol/L BHP-PC for 30 min. (g1–g4) HeLa cells were first pre-incubated with 100 µmol/L NEM for 30 min, then stimulated with 100 µmol/L Cys for 2 h, and finally incubated with 10.0 µmol/L BHP-PC for 30 min. Emissions were collected at 450–500 nm for the blue channel (excitation wavelength: 405 nm) and emissions were collected at 660–710 nm for the red channel (excitation wavelength: 633 nm). Scale bar: 20 µm. (B) Fluorescence intensities performance in blue channel or red channel. n = 3, error bars were ±SD. Data analysis was performed using SPSS software. The statistical analysis was performed with a one-way ANOVA. **P < 0.01, ***P < 0.001.
Subsequently, to further evaluate the probe’s ability to detect endogenous H2S in HeLa cells, cells were pre-treated with cysteine and BHP-PC, given that H2S in cells is typically generated from cysteine via the catalysis of CBS and CSE [37,38]. The fluorescence signals were significantly enhanced under these conditions. In contrast, when cells were pre-incubated with N-ethylmaleimide (NEM), the fluorescence in both channels was markedly reduced, attributable to the effective inhibition of H2S accumulation by NEM (Fig. 3A, f1-g4). Furthermore, comparison of the fluorescence intensities from the blue and red channels confirmed that the probe enables accurate quantification of H2S levels via dual-channel imaging, thereby demonstrating the reliability of BHP-PC for applications in biological environments (Fig. 3B).
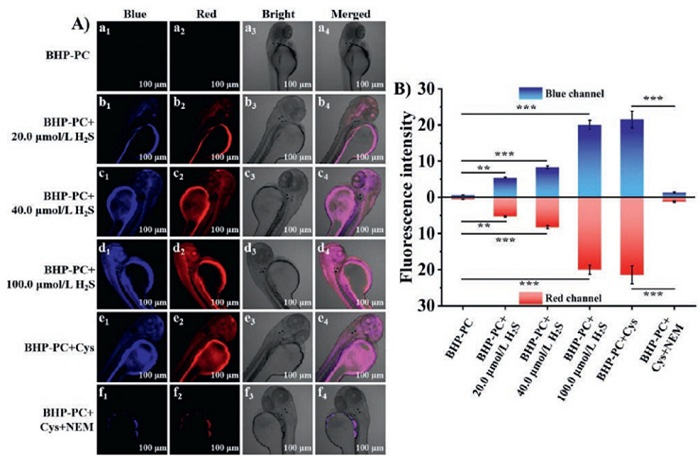
Given the high efficiency of intracellular H2S imaging and the high genetic homology between zebrafish and humans, zebrafish were selected as a model organism in this study to investigate its imaging capabilities in living organisms. Notably, the experimental results in zebrafish were highly consistent with those in HeLa cells (Fig. 4). When 4-day-old zebrafish were incubated solely with the probe, no significant fluorescence signals were detected in either of the two detection channels. However, after the probe solution was added to zebrafish pre-treated with H2S, a significant enhancement in dual-channel fluorescence was observed. Moreover, the fluorescence intensity in the blue and red channels increased in a concentration-dependent manner with the increase in H2S concentration. Subsequently, endogenous H2S was induced in zebrafish by Cys stimulation. Compared with the control group, the fluorescence intensity in both channels significantly increased in the Cys-treated group. In the inhibition group, H2S generation in zebrafish was inhibited by NEM. The results showed a significant reduction in fluorescence intensity in both channels, indicating that the inhibitor NEM effectively blocked H2S production stimulated by Cys. The aforementioned confocal microscopy results in zebrafish confirmed that BHP-PC has good tissue penetration and can sensitively monitor the changes in H2S levels within zebrafish.
Figure 4
Figure 4.
Detection of exogenous and endogenous H2S in zebrafish by the fluorescent probe BHP-PC. (A) (a1–a4) Zebrafish were incubated with the probe (10.0 µmol/L) for 30 min. (b1–d4) Zebrafish were incubated with 20.0, 40.0, and 100.0 µmol/L H2S for 30 min, followed by incubation with probe BHP-PC (10.0 µmol/L) for an additional 30 min. (e1–e4) Zebrafish were stimulated with 100 µmol/L Cys for 2 h and subsequently incubated with 10.0 µmol/L BHP-PC for 30 min. (f1–f4) Zebrafish were first pre-incubated with 100 µmol/L NEM for 30 min, then stimulated with 100 µmol/L Cys for 2 h, and finally incubated with 10.0 µmol/L BHP-PC for 30 min. Emissions were collected at 450–500 nm for the blue channel (excitation wavelength: 405 nm) and emissions were collected at 660–710 nm for the red channel (excitation wavelength: 633 nm). Scale bar: 20 µm. (B) Fluorescence intensities performance in blue channel or red channel. n = 3, error bars were ±SD. Data analysis was performed using SPSS software. The statistical analysis was performed with a one-way ANOVA. **P < 0.01, ***P < 0.001.
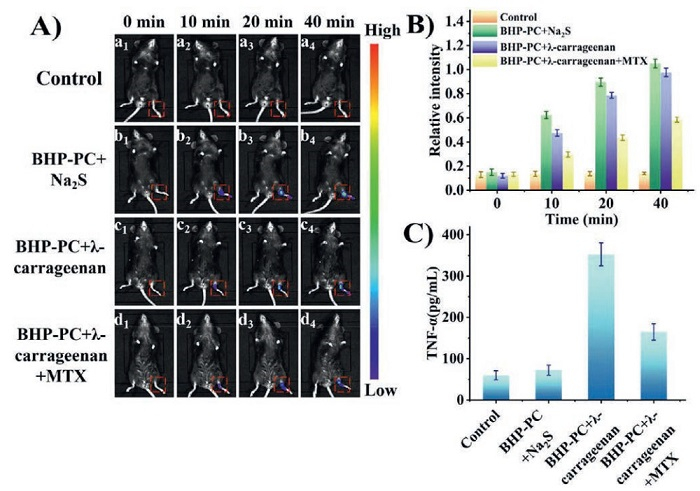
Given that the methylene blue fluorophore generated upon the reaction of the probe with H2S exhibits a significant emission signal at 681 nm, which is within the near-infrared region, the probe holds potential for in vivo H2S detection. Based on this, the current study further explored the probe’s ability to monitor H2S levels during arthritis and its treatment in mice. Throughout the study, mice were housed under standard conditions and all procedures were conducted in strict accordance with the ethical guidelines approved by the Animal Experiment Ethics and Care Committee of Qiqihar Medical University (No. QMU-AECC-2025–04). The results showed that in the control group, where mice were injected with saline at the left ankle, negligible fluorescence was detected over time. In contrast, mice that were manually injected with exogenous Na2S and those with arthritis induced by λ-carrageenan exhibited a significant increase in fluorescence intensity in the left joint over time. These findings indicate that H2S levels in mice with arthritis induced by λ-carrageenan are significantly higher than in normal mice. Mice treated with methotrexate (Methotrexate) (MTX) showed a marked reduction in fluorescence signals in the left joint, suggesting lower H2S levels and confirming the efficacy of MTX in mitigating arthritis-related damage (Figs. 5A and B). Additionally, tumor necrosis factor-alpha (TNF-α) levels, an inflammatory marker, were measured in the joint serum of mice across different groups. The results revealed that TNF-α levels were significantly higher in mice with arthritis compared to the control group and significantly decreased following MTX treatment (Fig. 5C). The differing trends between Figs. 5B and C stem from the distinct biological contexts of the measured metrics. Fig. 5B reflects local H2S concentrations at the joint: the Na2S group shows high fluorescence due to exogenous H2S injection, while the arthritis group exhibits elevated H2S linked to inflammatory pathogenesis. Fig. 5C, measuring serum TNF-α (an inflammatory marker), shows high levels only in the arthritis group (where inflammation is induced by λ-carrageenan) and not in the Na2S group (which lacks inflammatory stimulation). Thus, exogenous H2S alone does not trigger systemic inflammation, while arthritis-associated H2S is coupled with inflammatory responses, accounting for the trend discrepancy. Due to severe Rayleigh scattering and rapid signal attenuation of the blue channel (benzothiazole) in biological tissues, in vivo imaging of the murine arthritis model exclusively utilized the red channel (methylene blue, λem = 681 nm) in the near-infrared window, which offers better tissue penetration. Thus, dual-channel fluorescence was not applied here, with the red channel prioritized for reliable in vivo H2S visualization. The aforementioned experimental results demonstrate that probe BHP-PC can effectively track changes in H2S levels during arthritis and its treatment, offering a potential tool for a deeper understanding of the pathogenesis of arthritis.
Figure 5
Figure 5.
Imaging of arthritis mouse models. (A) (a1–a4) Mice were injected with 100.0 µmol/L saline into the left joint. (b1–b4) Intrarticular injection of Na2S (1.0 mmol/L) was employed for exogenous imaging of H2S in mice. (c1–c4) Intrarticular injection of λ-carrageenan (10.0 mg/kg) into the left joint, followed by a 12-h feeding period, was utilized to induce the development of arthritis. (d1–d4) Four hours after intrarticular injection of λ-carrageenan into the left joint, an intrarticular injection of MTX (2.0 mg/kg) was administered. The excitation wavelength is 605 nm and the emission range is 660–710 nm. (B) The temporal changes in fluorescence intensity among different groups of mice. The excitation wavelength is 605 nm and the emission range is 660–710 nm. (C) The levels of TNF-α in the serum of mice from different groups. Serum TNF-α levels were measured 16 h after initial λ-carrageenan injection (12 h post-arthritis induction and 4 h post-MTX treatment for the therapy group).
In summary, a multifunctional dual-channel fluorescent probe BHP-PC was developed through the rational integration of methylene blue and benzothiazole fluorophores. This probe exhibits remarkable spectral separation, enabling simultaneous monitoring of fluorescence signals in both blue and red channels for highly sensitive H2S detection. BHP-PC demonstrates rapid response kinetics (200 s), excellent selectivity, and robust performance in complex biological environments. Its dual-color imaging capability has been successfully validated in both cellular and zebrafish models. Particularly noteworthy is the successful development of BHP-PC-based test strips for practical H2S detection in spoiled protein-rich foods, including shrimp, chicken, beef, and pork. Furthermore, the probe’s application in a murine arthritis model has enabled precise monitoring of H2S level fluctuations, offering promising potential for early therapeutic intervention and disease progression monitoring in arthritis management.
Declaration of competing interest
The authors declare that they have no known competing financial interests or personal relationships that could have appeared to influence the work reported in this paper.
We gratefully acknowledge the financial support from the Basic Research Support Program for Outstanding Young Teachers in Provincial Undergraduate Universities of Heilongjiang Province of China (No. YQJH2024285); the Fund of Qiqihar Academy of Medical Sciences (No. QMSI2024Z-10); Construction Project of Dominant Characteristic Disciplines of Qiqihar Medical University (No. QYZDXK-008); National Natural Science Foundation of China (No. 22577124).
Supplementary materials
Supplementary material associated with this article can be found, in the online version, at doi:10.1016/j.cclet.2025.111800.
[1]
R.M. Mandel, P.S. Lotlikar, T. Runcevski, et al., J. Am. Chem. Soc. 146 (2024) 18927–18937. doi: 10.1021/jacs.4c00674
Scheme 1
The mechanism of action of fluorescent probe BHP-PC with H2S: (1) H2S cleaves the 2,4-dinitrophenyl ether recognition group; (2) ESIPT is activated in the benzothiazole moiety, emitting blue fluorescence (λem = 466 nm); (3) Methylene blue (MB) is released, restoring red fluorescence (λem = 681 nm).
Figure 2
Test strips detect gaseous H2S released from food samples during spoilage, with color changes induced by headspace H2S diffusion. (A) The preparation process of the portable test strip based on fluorescent probe BHP-PC and its schematic diagram for monitoring the food spoilage process, as well as the color changes of the BHP-PC test strip (10.0 µmol/L) under natural light and 365 nm UV irradiation when exposed to different concentrations of H2S (0.0, 10.0, 20.0, 40.0, 80.0, and 100.0 µmol/L). (B) Color changes of BHP-PC test strips under natural light and 365 nm UV irradiation for shrimp, chicken, beef, and pork at different time intervals (0, 12, 36, and 72 h) at 25 ℃. (C) Color changes of BHP-PC test strips under natural light and 365 nm UV irradiation for shrimp, chicken, beef, and pork after storage for 72 h at different temperatures (−20, 4, and 25 ℃).
Figure 3
Detection of exogenous and endogenous H2S in HeLa cells by the fluorescent probe BHP-PC. (A) (a1–a4) HeLa cells were incubated with the probe (10.0 µmol/L) for 30 min. (b1–e4) HeLa cells were incubated with 20.0, 40.0, 60.0, and 100.0 µmol/L H2S for 30 min, followed by incubation with probe BHP-PC (10.0 µmol/L) for an additional 30 min. (f1–f4) HeLa cells were stimulated with 100 µmol/L Cys for 2 h and subsequently incubated with 10.0 µmol/L BHP-PC for 30 min. (g1–g4) HeLa cells were first pre-incubated with 100 µmol/L NEM for 30 min, then stimulated with 100 µmol/L Cys for 2 h, and finally incubated with 10.0 µmol/L BHP-PC for 30 min. Emissions were collected at 450–500 nm for the blue channel (excitation wavelength: 405 nm) and emissions were collected at 660–710 nm for the red channel (excitation wavelength: 633 nm). Scale bar: 20 µm. (B) Fluorescence intensities performance in blue channel or red channel. n = 3, error bars were ±SD. Data analysis was performed using SPSS software. The statistical analysis was performed with a one-way ANOVA. **P < 0.01, ***P < 0.001.
Figure 4
Detection of exogenous and endogenous H2S in zebrafish by the fluorescent probe BHP-PC. (A) (a1–a4) Zebrafish were incubated with the probe (10.0 µmol/L) for 30 min. (b1–d4) Zebrafish were incubated with 20.0, 40.0, and 100.0 µmol/L H2S for 30 min, followed by incubation with probe BHP-PC (10.0 µmol/L) for an additional 30 min. (e1–e4) Zebrafish were stimulated with 100 µmol/L Cys for 2 h and subsequently incubated with 10.0 µmol/L BHP-PC for 30 min. (f1–f4) Zebrafish were first pre-incubated with 100 µmol/L NEM for 30 min, then stimulated with 100 µmol/L Cys for 2 h, and finally incubated with 10.0 µmol/L BHP-PC for 30 min. Emissions were collected at 450–500 nm for the blue channel (excitation wavelength: 405 nm) and emissions were collected at 660–710 nm for the red channel (excitation wavelength: 633 nm). Scale bar: 20 µm. (B) Fluorescence intensities performance in blue channel or red channel. n = 3, error bars were ±SD. Data analysis was performed using SPSS software. The statistical analysis was performed with a one-way ANOVA. **P < 0.01, ***P < 0.001.
Figure 5
Imaging of arthritis mouse models. (A) (a1–a4) Mice were injected with 100.0 µmol/L saline into the left joint. (b1–b4) Intrarticular injection of Na2S (1.0 mmol/L) was employed for exogenous imaging of H2S in mice. (c1–c4) Intrarticular injection of λ-carrageenan (10.0 mg/kg) into the left joint, followed by a 12-h feeding period, was utilized to induce the development of arthritis. (d1–d4) Four hours after intrarticular injection of λ-carrageenan into the left joint, an intrarticular injection of MTX (2.0 mg/kg) was administered. The excitation wavelength is 605 nm and the emission range is 660–710 nm. (B) The temporal changes in fluorescence intensity among different groups of mice. The excitation wavelength is 605 nm and the emission range is 660–710 nm. (C) The levels of TNF-α in the serum of mice from different groups. Serum TNF-α levels were measured 16 h after initial λ-carrageenan injection (12 h post-arthritis induction and 4 h post-MTX treatment for the therapy group).


 DownLoad:

 下载:
下载:


 下载:
下载:

