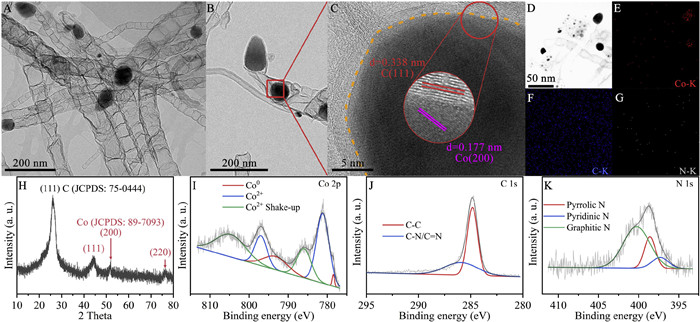
Figure 1.
TEM (A, B) and HR-TEM (C) images of Co/CNT. (D-G) Elemental mapping images. (H) XRD patterns of Co/CNT. High-resolution XPS spectra of (I) Co 2p, (J) C 1s and (K) N 1s.
Molecularly imprinted electrochemical sensor arrays combined with machine learning for simultaneous determination of three neonicotinoid insecticides
Dongshi Feng , Jiangdong Dai , Zhi Zhu , Pengwei Huo , Yongsheng Yan , Chunxiang Li

Neonicotinoid insecticides (NNIs) are a class of systemic pesticides with similar structures. Recent studies have shown that exposure to different NNIs can cause different damage to mammals and may even be carcinogenic. For example, imidacloprid induced mitochondrial dysfunction [1], thiamethoxam might cause DNA methylation [2], and nitenpyram leaded to chromosome damage [3]. Therefore, it is necessary to explore novel methods to carefully distinguish between different NNIs.
Electrochemical sensing technology possesses the advantages of high sensitivity, fast response and low cost [4,5]. It has been proposed as an alternative to immunoassay [6], chromatography [7] and spectroscopy [8]. Nevertheless, most reported electrochemical sensors target only one particular NNI and are unable to achieve the multi-objective for NNIs simultaneous determination.
For NNIs with similar molecular structures (Fig. S1 in Supporting information), the design of recognition probes needs to face two problems. The first is the difficulty of finding an exact match recognition probe for each NNIs, which limits the discriminatory ability of the sensor. The second is that it is difficult to eliminate the cross-reaction generated by non-target NNIs in a specific recognition probe. The cross-reaction has been shown to interfere with the output signals of the sensors, resulting in significant deviation in measurement accuracy [9]. The unintended deviation limits the application of pre-established mathematical models. Instead, sensor arrays incorporating machine learning may be an alternative strategy to solve these problems. The sensor arrays consist of multiple sensing units, each of which can be designed to provide an independent characteristic fingerprint for one analyte [10]. This lays the foundation for simultaneous detection of multiple NNIs. The application of principal component analysis (PCA) or linear discriminant analysis (LDA) facilitates the assignment of feature fingerprint data to their respective clusters, thereby enabling the classification of NNIs. In addition, the mechanism of accumulating prior knowledge through artificial neural networks (ANN, e.g., training on NNIs with known concentrations) [11] has the potential to determine NNIs of unknown concentration to the correct level.
The greatest challenge in sensor array designs lies in the development of multidimensional recognition elements, which determine the discrimination and determination capability of the sensor array. Molecularly imprinted polymers (MIPs) mimic antibody-antigen interactions to specifically recognize template molecules [12,13]. In addition, it is possible to amplify the sensor signal by immobilizing nanomaterials on the sensor surface, thus addressing the inherent shortcomings of MIPs in terms of poor conductivity and low electrocatalytic activity [14]. Carbon nanotubes (CNTs) are favored for their high electrical conductivity, good chemical stability, and unique structure [15,16]. In particular, the conductivity and catalytic activity could be enhanced effectively by encapsulating the transition metal (Fe, Co, and Ni) containing partially filled 3d orbitals into the CNTs [17,18].
Unfortunately, the introduction of MIPs is unable to entirely eliminate cross-reaction, even though we have worked diligently on sample pretreatment, separation and purification, and detection instrument optimization. Holmberg's 1996 study demonstrated machine learning's potential to address signal drift and classify alcohol vapors [19], showcasing its utility in overcoming theoretical model limitations. To date, machine learning has been reported to successfully resolve matrix effects [20], electrode fouling [21], and chemical interference [22] in voltammetric determinations of electrochemical sensors. However, the simultaneous determination of multiple NNIs and the solution of cross-reaction caused by molecular structure analogues has rarely been reported.
To this end, the present work discussed the preparation of MIPs electrochemical sensor array for simultaneous determination of three NNIs (imidacloprid, thiamethoxam and nitenpyram) by electropolymerizing o-Phenylenediamine (OPD) on carbon nanotubes encapsulated with cobalt (Co/CNT). Classification was achieved by analyzing the variety (single or mixed) in which the NNIs were present using PCA. The ANN (the detailed design was presented in section 2 of Supporting information) determined the concentration level of NNIs in the sample in the form of classes, eliminating the effect of cross-reaction. Finally, a spiked tea sample was subjected to analysis and the desired results were obtained.
Co/CNT was synthesised by heat treatment. Fig. 1A displayed the tubular structure was successfully synthesized. Transmission electron microscopy (TEM) and high resolution transmission electron microscopy (HRTEM) images showed that Co had been wrapped in the tubes (Figs. 1B and C). This structure prevented cobalt from falling off during electrochemical reactions [17]. The lattice spacing of 0.177 nm corresponded to the (200) crystal plane of Co (JCPDS No. 89–7093), which exhibited a clear boundary in the tube (illustrated by the orange dotted line in Fig. 1C). The layer distance of 0.338 nm belonged to the (111) plane of carbon (JCPDS No. 75–0444). Elemental mapping (Figs. 1D-G) demonstrated that C, Co, and N were distributed throughout the composite.
The X-ray powder diffraction (XRD) pattern was shown in Fig. 1H, the peaks at approximately 44.23°, 51.53° and 75.86° corresponded to the (111), (200) and (220) planes of Co, respectively. The peak value at approximately 25.30° belonged to (111) plane of carbon. In the high-resolution X-ray photoelectron spectroscopy (XPS), the peaks at 778.4 and 793.5 eV had confirmed the presence of metallic cobalt (Fig. 1I). The presence of the oxidation peak in the spectra may be attributed to the ease with which the metallic cobalt surface is oxidized when exposed to air [23]. The C 1s XPS (Fig. 1J) was decomposed into two fitting curves, corresponding to C–C (284.7 eV) and C–N/C=N (285.8 eV), respectively. The N 1s spectrum had shown three distinct peaks indicating the presence of three types of N bonds in the complex: graphitic N (400.6 eV), pyridinic N (398.7 eV), and pyrrolic N (397.5 eV) (Fig. 1K). These two spectrums confirmed that N was successfully doped in the products. The aforementioned characterization proved the successful preparation of Co/CNT.
The synthesis of MIPs film was conducted using the amperometric method. As shown in Fig. S2 (Supporting information), the oxidation peaks current gradually decreased with the increase of the number of scans. It reached stability after 10 cycles. No reduction peak appeared during this period, indicating that the electropolymerization process was irreversible. In addition, no current response of NNIs was observed, suggesting that the NNIs involved in the reaction were not affected by electropolymerization. It was evident that the thickness of the MIPs film had a significant impact on the sensor's performance, which could be regulated by modifying the number of cycles during the electropolymerization process. Consequently, the thickness of the film was optimized by varying the number of scans from 5 cycles to 14 cycles (Fig. S3 in Supporting information). With few electropolymerization cycles, the MIPs membrane became too thin or loose, allowing NNI molecules free access to the electrode surface, which resulted in prominent differential pulse voltammetry (DPV) peaks for both MIPs and NIPs [24]. On the contrary, more cycles reduced the peak currents of MIPs and NIPs. This was attributed to the difficulty of the molecules to diffuse through the thicker film, and the difficulty of being reduced when being too far from the electrode surface due to the low conductivity of the film [25]. Accordingly, the optimal number of cycles was selected based on the ratio between the MIPs and NIPs responses, with 10 cycles identified as the optimum. The optimization process for the pH values, molar ratio of template to monomer, adsorption time and elution time were described in section S3 (Supporting information).
Next, the morphology of the MIPs before and after elution of the template molecules was characterized by scanning electron microscope (SEM). Since different MIPs were obtained by introducing different NNI molecules during the electropolymerization process, the MIP(imidacloprid) film grown onto Co/CNTs will be presented as an example. Following the electropolymerization process, a uniform polymer film (Fig. S4A in Supporting information) was formed on the CNT surface. This contrasted with the morphology of the initial CNTs (Fig. S5 in Supporting information), confirming the successful modification of the electrodes. It was noteworthy that the film grows along the surface of the CNT, rather than integrally aggregating as a top layer that covers the whole. This specific morphology was ascribed to the electropolymerization method [26]. As previously outlined, the method demonstrated superior control over the distribution and thickness of the MIPs film. As can be seen from the comparison of the images before and after the extraction of the template molecules (Figs. S4A and D in Supporting information), there was no discernible morphological alteration in the structure of the film, thereby confirming the stability of the MIPs. In order to confirm the adsorption capability of MIPs for NNIs, the elemental composition of the two films was revealed using energy dispersive spectroscopy (EDS) [27]. As illustrated in Figs. S4B and E (Supporting information), the elevated oxygen (O) content observed in both polymers can be attributed to their exposure to atmospheric oxygen. Following elution, the peak heights of nitrogen and chlorine revealed a reduction in comparison to the levels observed prior to elution. This phenomenon may be ascribed to the removal of imidacloprid molecules, as nitrogen and chlorine are key elements in substantiating the existence of imidacloprid. AFM three-dimensional topography analysis shows (Figs. S4C and F in Supporting information) that the Ra (Roughness average) of the eluted film increased from 7.36 nm to 7.87 nm, and the Rq (RMS Roughness) increased from 4.43 nm to 4.96 nm. This change in surface roughness can be attributed to the exposure of the imprint cavities, which increases surface undulations, and the microdomain deformation caused by the rearrangement of polymer segments after the removal of template molecules.
Bare GCE initiated a reversible redox reaction of [Fe(CN)6]3−/4− in probe solution (Fig. S6A in Supporting information). The responses were initially compared with those obtained for CNT and Co/CNT modified GECs, which demonstrated that the loading of Co/CNT augmented the electron transfer, as evidenced by the larger peaks in CV and a markedly reduced charge transfer resistance in EIS (Fig. S6B in Supporting information). Quantitative analysis through Randles equivalent circuit fitting revealed a decreasing trend in Rct values: bare GCE (172.1 Ω) > CNT/GCE (119.4 Ω) > Co/CNT/GCE (46.7 Ω), which conclusively demonstrates the synergistic enhancement effect of the composite modification. Then, the electrochemical behavior of MIPs and NIPs in different modification stages was compared. After electropolymerization (Fig. S6C in Supporting information), the current in the MIP and NIP sensors were drastically reduced due to the insulating properties of the polymer matrix resulting in poor conductivity and impeded electron transport [28]. These were in accordance with the distinct semicircular characteristics in the EIS spectrum (Fig. S6D in Supporting information). Subsequent to the extraction of the template, a significant improvement in the electrochemical behavior of the MIPs sensor was observed, as proved by both the cyclic voltammetry (CV) and electrochemical impedance spectroscopy (EIS) analyses. This was attributed to the released sites affording [Fe(CN)6]3−/4− greater accessibility to the electrode surface [29]. Finally, upon rebinding of the cavities with the template molecules, electron transport was reimpeded, as indicated by a decrease in voltammetric current and an increase in resistance. The results of the CV and EIS measurements were in concordance with one another, thereby corroborating the functionalization of the electrode.
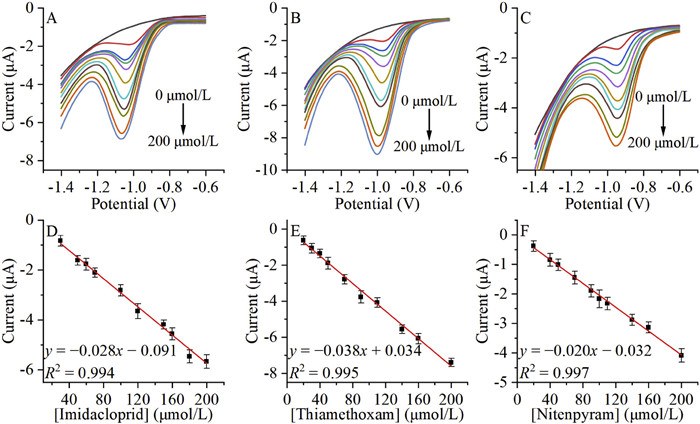
In order to demonstrate the applicability of the sensor array, solutions with increasing concentrations of different NNIs were analyzed by DPV using the different sensor units under optimized conditions. The response curves of each sensing unit to the respective template molecule were shown in Figs. 2A-C (extracted from Figs. S7A, E and I in Supporting information). It was easy to analyze a significant linear relationship between peak current and concentration (Figs. 2D-F, extracted from Figs. S8A, E and I in Supporting information). Not only that, the DPV response and calibration curves of each sensing unit to other NNIs were also plotted (Figs. S7-S9 in Supporting information). It can be seen that each MIPs sensing unit showed the highest response to its specific template. That is, MIP(imidacloprid) clearly shows the highest peak to imidacloprid, while MIP(thiamethoxam) shows to thiamethoxam, and MIP(nitenpyram) shows to nitenpyram, confirming the specific recognition of the different MIP(NNIs) films. However, the NIPs-based sensor exhibited the least response to the three NNIs in comparison with the other three MIPs-based sensors, owing to the absence of recognition sites for the various NNIs [12]. The results of the analyses for the various NNIs (Table S3 in Supporting information) also illustrated that each sensing unit exhibited high sensitivity and a wide linear range for its template molecule.
To further confirm the selectivity of the sensor array, acetamiprid and dinotefuran from the family of NNIs, as well as two other aromatic compounds (dopamine and 2‑chloro-p-nitrophenol) were chosen as disruptors. The concentration of both the template molecules and each disruptor was 50 µmol/L. The response of each sensing unit to the disruptors was evaluated. It can be observed from Fig. S10 (Supporting information) that MIPs improved the response of the template molecule and inhibited the response of the distractors. It was worth noting that the peak currents of the disruptors might appear outside the present potential window, which also made them clearly distinguishable from the template molecules. The excellent selectivity of the sensor array excluded non-target responses, ensuring that the data sources required for the machine learning model to work are all valid.
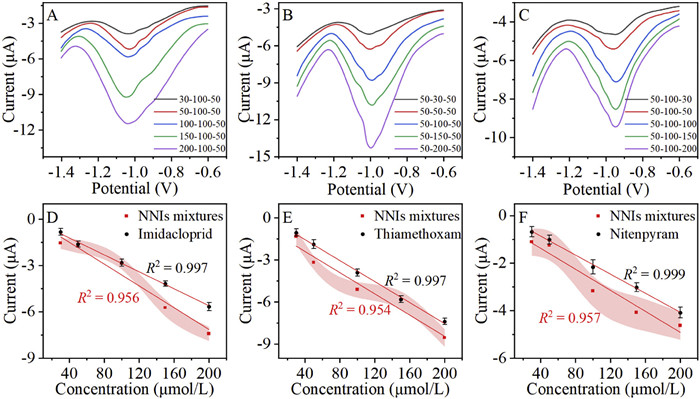
Despite MIPs-based sensors were meant to be highly specific, those still showed certain cross-reaction when NNIs mixtures were analyzed. For this reason, the DPV response of mixtures with different concentrations was examined. As shown in Fig. S11 (Supporting information), each sensing unit not only responds to its target analyte, but also gives feedback to other NNIs. This can be concluded from the phenomenon of peak overlapping in the DPV curves. It suggested that the MIPs may inevitably adsorb similar molecules [30], resulting in corresponding peak currents. Figs. 3A-C and Fig. S12 (Supporting information) revealed the DPV curves for increasing concentrations of template molecules in the mixture and the effect of cross-reaction on the response current. It could be observed that the same concentration of template molecules gave slightly higher peak currents in the NNIs mixtures as compared to the presence of only template molecules. As the concentration of template molecules increased, the peak current showed an irregular increase (Figs. 3D-F). The presence of the phenomenon interfered with the previously obtained linear equations for the quantification of each NNIs [21]. This also demonstrated that to obtain realistic assay results, it was necessary to use a nonlinear model to compensate for cross-reaction effects. However, we proposed a novel approach that combined machine learning with MIPs-based sensor array as a direct solution to eliminate cross-reaction. This approach focused on data processing, discovering patterns and regularities in historical data, and making accurate judgments on new data.
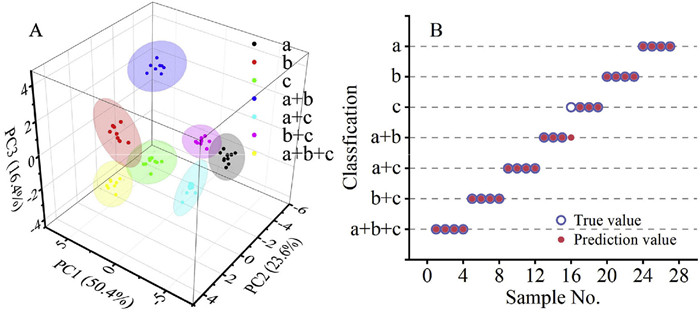
According to the method mentioned in Section S1.5 (Supporting information), the classification of compressed data for training set was achieved by PCA. The results demonstrated a significant difference between groups and a consistency of samples within groups (Fig. 4A). The samples were all classified into their groups without any overlap. The data in the hierarchical cluster analysis plot (Fig. S13 in Supporting information) showed that seven categories could be clearly distinguished without any confusion and misclassification. Furthermore, PC1, PC2 and PC3 explained approximately 90.4% of the information, thereby facilitating a more precise representation of the sample measurements [31]. These can provide substantial support for obtaining superior classification results. Finally, the model was evaluated using the validation set after the test set tuning and achieved an accuracy of 96.3% (Fig. 4B). Thus, the superior ability of the developed sensor array in distinguishing NNIs was well demonstrated.
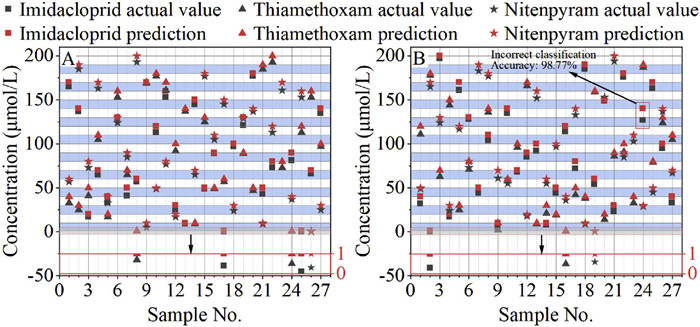
Analogously, we implemented the simultaneous determination of three NNIs using the ANN model discussed in Section S1.5. First of all, the impact of the number of double hidden layer neurons on root mean square error (RMSE), mean absolute percentage error (MAPE), and R-squared was investigated (Fig. S14 in Supporting information). RMSE was used to evaluate the degree of deviation between predicted and true values, and MAPE represented the relative error between predicted and true values. The smaller the value of both indicated the smaller the prediction error of the model [32]. When the number of neurons in the first hidden layer was 128 and the number of neurons in the second hidden layer was 64, RMSE and MAPE were minimized while R-squared was maximized, indicating that 128 and 64 were the optimal numbers of hidden layer neurons. Subsequently, the model performance was evaluated using the accuracy and loss metrics [33]. Fig. S15 (Supporting information) illustrated that as the training cycle progresses, the loss value declined, indicating that the model was approaching convergence. Concurrently, the accuracy value rose, demonstrating that the training process was becoming more precise and approaching the anticipated value for model training. The aforementioned data suggested that the model was adequately trained, that neither overfitting nor under fitting occurred, and that the prediction results of the model were valid. Next, the predictive effects were evaluated using test set (Table S4 in Supporting information) and validation set (Table S5 in Supporting information). All samples in the test set were correctly classified (Fig. 5A), while imidacloprid was incorrectly predicted in the 24th group of samples in the validation set (Fig. 5B). The model's accuracy was 98.77%, validating the excellent individual quantification ability of the proposed method for NNIs mixtures.
Finally, to demonstrate the applicability of the MIPs-based sensor array, some spiked samples were analyzed. Tea purchased from a local supermarket were pre-treated and then divided into three portions, with three distinct concentrations of NNIs standard mixture added to each. Despite the complex composition of these samples, the observed and predicted values also reflected a notable concordance (Fig. S16A in Supporting information). A series of performance metrics for the array sensing system were evaluated using concentration group (33, 7, 65 µmol/L). Long-term stability tests showed that accurate predictive capability was maintained even after three weeks (Fig. S16B in Supporting information), indicating no significant degradation of the molecularly imprinted interface. The same sensor array achieved 100% correct classification in 10 consecutive repeated measurements (Fig. S16C in Supporting information), confirming its excellent anti-fouling capability and signal reproducibility. Five independently prepared sensor arrays yielded correct predictions under the same test conditions (Fig. S16D in Supporting information), verifying the reliability of the preparation process and the system's reproducibility across batches. These data fully demonstrate that the sensing system meets the stringent requirements for stability, reusability, and reproducibility in practical detection scenarios. In addition, the fabricated MIPs-based sensor displayed a wider detection range and a lower limit of detection (LOD) compared with electrochemical sensors based on different electrode modified materials in previous reports in Table S6 (Supporting information), indicating that the prepared sensor array had better sensing performance.
Compared to other cross-reaction solutions (Table S7 in Supporting information), a common feature is their adoption of the "feature extraction - dimensionality reduction - pattern recognition" paradigm. However, the present work demonstrates unique advantages in adapting to the needs of multicomponent pesticide detection with similar structures through the geometric compression of electrochemical signals and a multitasking hybrid framework pattern recognition approach.
In this study, an ML-assisted MIPs electrochemical sensor array was constructed to solve the problem of NNIs' structural homology causing cross-reactivity in hybrid detection. Accurate classification and quantification of NNIs in mixed systems were achieved. The performance of the array sensing system was verified using spiked samples. The classification accuracy of this method is >98%, but the quantitative accuracy under large concentration gradients needs to be improved. In the future, an adaptive hybrid model can be constructed on the algorithm to achieve accurate prediction in a wide dynamic range. Microfluidic dilution and digital twin calibration technology can be integrated in the system to dynamically compensate the error. Through technological innovation, a standardised intelligent testing platform complementary to the mature methods will be built.
The authors declare that they have no known competing financial interests or personal relationships that could have appeared to influence the work reported in this paper.
Dongshi Feng: Writing – review & editing, Writing – original draft, Software, Formal analysis, Data curation, Conceptualization. Jiangdong Dai: Writing – review & editing, Project administration, Methodology, Conceptualization. Zhi Zhu: Resources, Project administration, Formal analysis, Data curation. Pengwei Huo: Supervision, Resources, Funding acquisition, Conceptualization. Yongsheng Yan: Supervision, Project administration, Conceptualization. Chunxiang Li: Project administration, Methodology, Funding acquisition, Conceptualization.
This article was supported by the National Natural Science Foundation of China (No. 22008092).
Supplementary material associated with this article can be found, in the online version, at doi:
F. Wei, F. Cheng, H. Li, et al., Sci. Total Environ. 951 (2024) 175422. doi: 10.1016/j.scitotenv.2024.175422
Z.R. Guler, U. Yilmaz, K. Uzunosmanoglu, et al., Int. J. Toxicol. 42 (2023) 345–351. doi: 10.1177/10915818231154470
W. Liu, Z. Li, X. Cui, et al., Toxicol. Appl. Pharmacol. 446 (2022) 116065. doi: 10.1016/j.taap.2022.116065
H.K. Li, H.L. Ye, X.X. Zhao, et al., Chin. Chem. Lett. 32 (2021) 2851–2855. doi: 10.1016/j.cclet.2021.02.042
Z. Niu, P. Sun, K. Koh, et al., Chin. Chem. Lett. 36 (2025) 110844. doi: 10.1016/j.cclet.2025.110844
R. Wang, Z. Wang, H. Yang, et al., J. Sci. Food Agric. 92 (2012) 1253–1260. doi: 10.1002/jsfa.4691
S. Baskaran, R.S. Kookana, R. Naidu, J. Chromatogr. A 787 (1997) 271–275. doi: 10.1016/S0021-9673(97)00652-3
Y.Z. Yang, N.M. Peleato, R.L. Legge, et al., Environ. Sci. Water Res. Technol. 5 (2019) 315–324. doi: 10.1039/c8ew00821c
S.E. Chocron, B.M. Weisberger, H. Ben-Yoav, et al., PLoS One 10 (2015) e0116310. doi: 10.1371/journal.pone.0116310
V. Schroeder, E.D. Evans, Y.C.M. Wu, et al., ACS Sens. 4 (2019) 2101–2108. doi: 10.1021/acssensors.9b00825
A.V. Mueller, H.F. Hemond, Talanta 117 (2013) 112–118. doi: 10.1016/j.talanta.2013.08.045
J. Pan, W. Chen, Y. Ma, et al., Chem. Soc. Rev. 47 (2018) 5574–5587. doi: 10.1039/c7cs00854f
P. Huo, J. Li, Z. Ye, et al., Chin. Chem. Lett. 28 (2017) 2259–2262. doi: 10.1016/j.cclet.2017.09.067
Y. Sun, L. Xu, G.I.N. Waterhouse, et al., Sens. Actuators B: Chem. 281 (2019) 107–114. doi: 10.1016/j.snb.2018.10.055
Q. Qi, W. Shen, M. Cai, et al., ACS Appl. Nano Mater. 7 (2024) 24788–24797. doi: 10.1021/acsanm.4c04669
W. Shen, Q. Qi, B. Hu, et al., J. Ind. Eng. Chem. 145 (2025) 384–394. doi: 10.1016/j.jiec.2024.10.033
X. Zou, X. Huang, A. Goswami, et al., Angew. Chem. Int. Ed. 53 (2014) 4372–4376. doi: 10.1002/anie.201311111
Y. Zhang, Y. Liu, W. Guan, et al., Chin. Chem. Lett. 35 (2024) 108932. doi: 10.1016/j.cclet.2023.108932
M. Holmberg, F. Winquist, I. Lundström, et al., Sens. Actuators B: Chem. 36 (1996) 528–535. doi: 10.1016/S0925-4005(97)80124-4
G.F. Giordano, V.M.S. Freitas, G.R. Schleder, et al., ACS Appl. Mater. Interfaces 13 (2021) 35914–35923. doi: 10.1021/acsami.1c07874
S. Aiassa, I. Ny Hanitra, G. Sandri, et al., Biosens. Bioelectron. 171 (2021) 112666. doi: 10.1016/j.bios.2020.112666
J.S. Torrecilla, M.L. Mena, P. Yáñez-Sedeño, et al., J. Chemom. 22 (2008) 46–53. doi: 10.1002/cem.1100
T. Ouyang, Y. Ye, C. Wu, et al., Angew. Chem. Int. Ed. 58 (2019) 4923–4928. doi: 10.1002/anie.201814262
G. Dykstra, B. Reynolds, R. Smith, et al., ACS Appl. Mater. Interfaces 14 (2022) 25972–25983. doi: 10.1021/acsami.2c02474
L. Moreira Gonçalves, Curr. Opin. Electrochem. 25 (2021) 100640. doi: 10.1016/j.coelec.2020.09.007
M. Wang, X. Cetó, M. del Valle, ACS Sens. 7 (2022) 3318–3325. doi: 10.1021/acssensors.2c01260
Y. Li, X. Chen, H. Ren, et al., Talanta 237 (2022) 122909. doi: 10.1016/j.talanta.2021.122909
L. Wang, J. Hu, W. Wei, et al., Microchem. J. 207 (2024) 111809. doi: 10.1016/j.microc.2024.111809
H.F. El-Sharif, S. Patel, E.N. Ndunda, et al., Anal. Chim. Acta 1196 (2022) 339547. doi: 10.1016/j.aca.2022.339547
Z. Lu, Y. Li, T. Liu, et al., Chem. Eng. J. 389 (2020) 124417. doi: 10.1016/j.cej.2020.124417
M. Wang, X. Cetó, M. Del Valle, Biosens. Bioelectron. 198 (2022) 113807. doi: 10.1016/j.bios.2021.113807
D. Chicco, M.J. Warrens, G. Jurman, PeerJ Comput. Sci. 7 (2021) e623. doi: 10.7717/peerj-cs.623
V. Peiris, V. Roshchina, N. Sukhorukova, Adv. Comput. Math. 50 (2024) 31. doi: 10.1007/s10444-024-10124-9

Figure 1 TEM (A, B) and HR-TEM (C) images of Co/CNT. (D-G) Elemental mapping images. (H) XRD patterns of Co/CNT. High-resolution XPS spectra of (I) Co 2p, (J) C 1s and (K) N 1s.

Figure 2 DPV responses in the corresponding linear concentration range (A-C) and calibration curves (D-F) of MIPs-based sensors towards their respective templates: (A, D) MIP(imidacloprid) to imidacloprid, (B, E) MIP(thiamethoxam) to thiamethoxam, and (C, F) MIP(nitenpyram) to nitenpyram.

Figure 3 DPV curves of (A) MIP(imidacloprid), (B) MIP(thiamethoxam) and (C) MIP(nitenpyram) sensors to NNIs mixtures (increasing concentration (µmol/L) of the template molecule, constant concentration of the other two) and (D-F) corresponding concentration-current fitting curves (red line). For comparison, the black lines in figures (D-F) were the concentration-current fitting curves of each sensing unit to its template molecule extracted from Fig. S8.

Figure 4 (A) PCA Score plot for the MIPs-based sensor array toward seven different NNIs solutions (95% confidence limits for each of the clusters). (B) Classification results on validation set. In the figure, a, b and c stand for imidacloprid, thiamethoxam and nitenpyram, respectively.

 扫一扫看文章

扫一扫关注我们
 DownLoad:
 下载:
下载:

 下载:
下载: