Key Laboratory of Flexible Electronics (KLOFE) & Institute of Advanced Materials (IAM), Jiangsu National Synergetic Innovation, Center for Advanced Materials (SICAM), Nanjing Tech University, Nanjing 211816, China
b.
CAS Key Laboratory of Nanosystem and Hierarchical Fabrication, CAS Center for Excellence in Nanoscience, National Center for Nanoscience and Technology, Beijing 100190, China
c.
Department of Environmental Science and Engineering, School of Energy and Environmental Engineering, University of Science and Technology Beijing, Beijing Key Laboratory of Resource Treatment of Typical Industrial Pollutants, Beijing 100083, China
d.
College of New Energy and Materials, China University of Petroleum, Beijing 102249, China
e.
University of Chinese Academy of Sciences, Beijing 100049, China
f.
City University of Hong Kong (Dongguan), Dongguan 523808, China
Received Date:
14 March 2025 Accepted Date:
04 September 2025 Revised Date:
30 August 2025 Available Online:
15 January 2026
Abstract:
In the field of organic solar cells (OSCs), side-chain engineering is a key strategy for developing high-performance non-fullerene small molecule acceptors (SMAs), which could adjust the material solubility and modulate the intermolecular stacking properties, profoundly impacting the film morphology and thus acting on the final power conversion efficiency (PCE) of the materials. In this study, two asymmetric acceptor molecules, Qx-PhBr-BO and Qx-PhBr-X, were synthesized by migrating the branching site of the outer side chain from the β-site to the γ-site. The branching site located at the γ-site could reduce the steric-hindrance effect and enhance the molecular aggregation behavior, giving rise to redshifted absorption and tight π-π stacking. Morphology analysis shows that the Qx-PhBr-X-based devices have smoother surfaces and a phase-separated structure, which is more favorable for charge transport and extraction. The Qx-PhBr-X-based devices exhibit balanced hole-electron mobility, efficient exciton dissociation, and low charge recombination. As a result, Qx-PhBr-X with γ-site branching exhibits superior photovoltaic performance with a PCE of 17.16%, which is significantly higher than that of Qx-PhBr-BO at 16.28%. These results highlight the importance of side-chain modifications for optimizing OSC efficiency and provide an important reference for precise tuning of side-chain structures in future molecular design.
Organic solar cells (OSCs) have achieved remarkable progress in recent years, driven by the development of non-fullerene acceptors (NFAs) characterized by tunable optoelectronic properties and enhanced stability [1–10]. Among them, Y-series NFAs have emerged as frontrunners due to their fused-ring electron-deficient cores, enabling broad absorption and high charge mobility [11–14]. The integration of quinoxaline-based units into the central core of the Y-series NFAs has attracted significant attention owing to their electron-withdrawing nature and planar molecular geometry, which facilitates efficient intramolecular charge transfer, optimize molecular stacking behavior, and reduce energy loss [15–21]. For instance, asymmetric quinoxaline-core-based acceptors incorporating selenium heteroatoms demonstrated optimized molecular packing and improved crystallinity, achieving PCEs exceeding 18% [22–25]. Furthermore, quinoxaline derivatives like AQx-series acceptors effectively modulated dielectric constants and electrostatic potentials, enhancing exciton dissociation and charge transport [26–29]. These advancements underscore the pivotal role of quinoxaline-based molecular engineering in advancing OSC performance. The strong electron-withdrawing nature of the quinoxaline core in NFA molecules causes a blue shift in their absorption spectra and an upward shift in the lowest unoccupied molecular orbital (LUMO) level. While this can contribute to an improvement in the open-circuit voltage (VOC), it is detrimental to the short-circuit current density (JSC), thus limiting the overall performance of OSCs. Therefore, achieving a balance between the key factors influencing OSC performance is essential in the molecular design of NFA materials [30].
Strategic modulation of alkyl chain branching positions has emerged as a critical approach for enhancing charge transport in organic semiconductors [31–35]. Relocating the branching sites away from the conjugated backbone effectively reduces the steric hindrance between bulky alkyl groups and the π-conjugated framework, which can optimize molecular packing with enhanced π-π stacking interactions and intermolecular electronic coupling. Particularly in A-DA’D-A configured NFAs, this design principle demonstrates unique advantages-systematic branching position engineering significantly improves hole mobility while establishing continuous charge transport pathways [36,37]. Both L8-BO and L8-BO-X, synthesized through the strategy of alkyl chain branching and modification of branching positions, exhibit better structural ordering and optimized multi-length scale morphology, leading to higher power conversion efficiency (PCE) [38,39]. Despite the current reliance on linear or β-branched alkyl chains in state-of-the-art NFAs, advanced branching site manipulation opens new opportunities to overcome efficiency limitations through balanced optimization of crystallinity and domain size control.
Herein, we report two NFAs based on an asymmetric quinoxaline central core, Qx-PhBr-BO and Qx-PhBr-X, which are synthesized through modification of branching positions in outer alkyl chains attached to the bithiophene unit. Experimental characterization reveals that the Qx-PhBr-BO system with β-branched alkyl chains suffers from excessive blue-shifted absorption spectrum and overscaled phase separation, resulting in diminished JSC and fill factor (FF), ultimately limiting PCE to 16.28%. To address this, we rationally relocated the alkyl chain branching site from the β-position to the γ-position on the bithiophene moiety, synthesized Qx-PhBr-X. The optimized PM6:Qx-PhBr-X blend demonstrates enhanced performance with a PCE of 17.16%, featuring a high open-circuit voltage (VOC = 0.908 V), improved FF (78.01%), and an elevated JSC (24.19 mA/cm2). Our work finds that the device performance of OSCs can be significantly improved by adjusting the position of the side-chain branching sites.
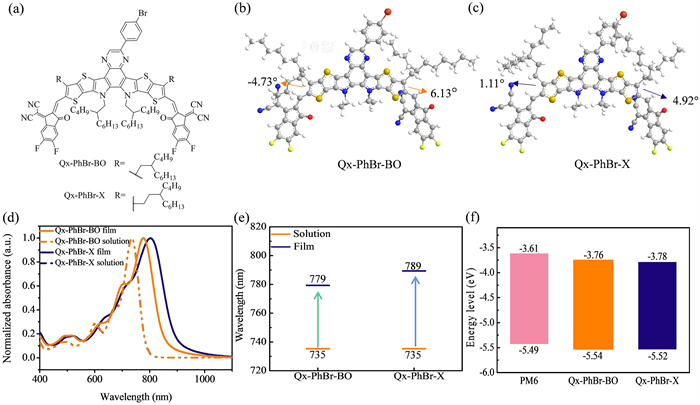
The chemical structures of the two acceptors are presented in Fig. 1a, respectively, while the synthetic details of Qx-PhBr-X and Qx-PhBr-BO are provided in Scheme S1 (Supporting information). The molecular structures of the two SMA molecules were confirmed by 1H and 13C nuclear magnetic resonance (NMR) spectroscopy and mass spectrometry data, as detailed in Figs. S1-S6 (Supporting information). To alleviate the blue-shifted absorption caused by the introduction of Qx groups, we extraverted the branches of side chains to reduce the steric hindrance, thereby improving molecular planarity and, thus, aggregation and assembly behaviors. From Qx-PhBr-BO to Qx-PhBr-X, the density functional theory (DFT) calculation shows that the planarity of their molecular skeletons is significantly improved, inferring from much reduced dihedral angles between end group and central core in Qx-PhBr-X (1.11° and 4.92°) than Qx-PhBr-BO (−4.73° and 6.13°), which is consistent with our design intention (Figs. 1b and c). The ultraviolet-visible (UV–vis) absorption spectra of Qx-PhBr-X and Qx-PhBr-BO in chloroform solutions and thin films are shown in Fig. 1d. As summarized in Table S1 (Supporting information), the similarity in the backbone structures of the two molecules results in nearly identical absorption in the solution state, both displaying a maximum absorption peak at 735 nm. In the film state, the absorption spectra of both acceptors are redshifted compared to the solution, which is indicative of better π-π stacking of both molecules in the film state. The maximum absorption wavelengths of Qx-PhBr-BO and Qx-PhBr-X in the film state are 779 and 789 nm, respectively. As listed in Fig. 1e, the more redshifted absorption from solution to film state for Qx-PhBr-X than Qx-PhBr-BO suggests a more ordered molecular stacking, benefiting from a more planar molecular conformation. Furthermore, the absorption intensity ratio between the 0–0 and 0–1 vibrational transition peaks (I0–0/I0–1) is 1.92 and 1.61 for Qx-PhBr-X and Qx-PhBr-BO, indicating a greater degree of J-aggregation in Qx-PhBr-X film [40,41]. The optical band gaps, calculated from the absorption edges (λedges) of the films, are 1.47 eV for Qx-PhBr-BO and 1.39 eV for Qx-PhBr-X, respectively. In summary, Qx-PhBr-X shows a broader absorption spectrum in the thin-film state, which helps capture more photons and improves light utilization.
Figure 1
Figure 1.
(a) Molecular structures of the two NFAs. DFT calculation of Qx-PhBr-BO (b) and Qx-PhBr-X (c). (d) Normalized solution and film absorption spectra. (e) Change of the maximum absorption peak positions from the solution to the film state of the two NFAs. (f) Energy levels of PM6, Qx-PhBr-BO, and Qx-PhBr-X.
The highest occupied molecular orbital (HOMO) and LUMO energy levels of the two small molecular acceptors were estimated through the electrochemical cyclic voltammetry (CV) measurements using the Fc/Fc+ pairing as an internal reference. The results, as shown in Fig. 1f and Fig. S7 (Supporting information), indicate that the ELUMO/EHOMO values are ‒3.76/‒5.54 eV for Qx-PhBr-BO and ‒3.78/‒5.52 eV for Qx-PhBr-X, respectively. It can be seen that fine-tuning the electrochemical properties by changing the branching sites of the side chains from the β-position to the γ-position allows efficient exciton dissociation and thus yields a higher Jsc [42]
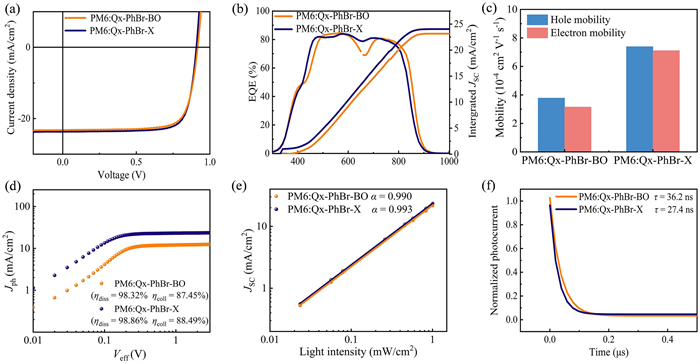
To investigate the effect of the branch point shift of the outward chain on device performance, conventional devices with the structure ITO/PEDOT:PSS/active layer/PNDIT-F3N/Ag were fabricated. Detailed device optimization data are provided in Tables S2 and S3 (Supporting information). The current density-voltage (J-V) characteristics of the optimized organic solar cells are presented in Fig. 2a, and the detailed photovoltaic performance parameters are summarized in Table 1. The optimized device based on PM6:Qx-PhBr-BO achieves a PCE of 16.28%, with a VOC of 0.917 V, a JSC of 23.20 mA/cm2, and an FF of 76.71%, while the PM6:Qx-PhBr-X device demonstrates a higher PCE of 17.16%, with a VOC of 0.908 V, a JSC of 24.19 mA/cm2, and an FF of 78.01%. The external quantum efficiency (EQE) curves of the two devices are displayed in Fig. 2b. It is evident that both devices exhibit strong EQE responses in the 400–800 nm wavelength range, and the calculated JSC values align with the experimentally obtained values within a 5% error margin. The increased EQE values in the 600–650 nm range can explain the superior JSC observed in the Qx-PhBr-X device.
Figure 2
Figure 2.
(a) J–V curves of the corresponding optimized OSCs. (b) EQE curves and the according integrated current density curves. (c) Histograms of hole and electron mobilities of two NFAs-based devices. (d) Jphversus Veff curves of the OSCs. (e) Light intensity dependence of JSC values of the corresponding optimized devices. (f) TPC measurements of the optimized device.
a Average parameters with standard deviations obtained from at least ten devices. b The Jcal. calculated from the EQE spectram.
These results suggest that the branching site has a remarkable effect on the photovoltaic performance, and when the site is γ-site, the higher JSC and FF enable Qx-PhBr-X to show excellent performance. In the following part, we explore the reasons for the increased FF and JSC induced by the branch site of side chains.
In order to evaluate the effect of the branch site of outer side chains on charge transport properties, the charge mobility of the blend films was determined using the space charge limited current (SCLC) method. The hole mobility (µh) and electron mobility (µe) were calculated from J0.5~V characteristics curves in Fig. S8 (Supporting information). As shown in Fig. 2c and Table S4 (Supporting information), the µh of PM6:Qx-PhBr-BO and PM6:Qx-PhBr-X is 3.78 × 10⁻⁴ cm2 V-1 s-1 and 7.39 × 10⁻⁴ cm2 V-1 s-1, respectively, while the corresponding µe is 3.15 × 10⁻⁴ cm2 V-1 s-1 and 7.11 × 10⁻⁴ cm2 V-1 s-1, respectively. The µh/µe ratio changes from 1.20 (Qx-PhBr-BO) to 1.04 (Qx-PhBr-X), becoming closer to 1. The higher and more balanced carrier mobilities in the PM6:Qx-PhBr-X blend film account for the significantly increased JSC and FF, enhancing the PCE of the corresponding devices. This significant increase in carrier mobilities may be primarily due to the gradually enhanced molecular stacking behavior.
Furthermore, we investigated the influence of the branch site on the exciton dissociation, recombination, and charge collection dynamics. We first plotted the curves of photocurrent density (Jph) versus the effective voltage (Veff) in Fig. 2d. The exciton dissociation probability (ηdiss) is quantified as the ratio of Jph and saturation current density (Jsat) under short-circuit conditions [43,44]. The ηdiss for PM6:Qx-PhBr-X-based devices is 98.86%, and charge-collection efficiency (ηcoll) is 88.49%, surpassing those of PM6:Qx-PhBr-BO devices (ηdiss = 98.32% and ηcoll = 87.45%), respectively. The downward LUMO energy level of Qx-PhBr-X provides a large driving force for exciton dissociation, resulting in a higher ηdiss of the PM6:Qx-PhBr-X-based device. Subsequently, the dependence of JSC and VOC on light intensity (Plight) is measured to investigate the charge recombination mechanism.
Generally, the relationship between JSC and Plight follows the formula: JSC ∝ (Plight)α, where α is the power law exponent. The α value closer to 1 indicates reduced bimolecular recombination [45]. As shown in Fig. 2e, α values are 0.990 and 0.993 for Qx-PhBr-BO and Qx-PhBr-X, respectively. The slightly higher α value demonstrates that bimolecular recombination is effectively suppressed in the PM6:Qx-PhBr-X-based device. The relationship between VOC and light intensity follows the formula: VOC ∝ (nkT/q) ln Plight. The smaller n value indicates a lower degree of single-molecule or trap-assisted recombination in the device [46]. As shown in Fig. S9 (Supporting information), the n values are 1.06 and 1.02 for Qx-PhBr-BO and Qx-PhBr-X, respectively, implying that the Qx-PhBr-X-based device exhibits the suppressed trap-assisted recombination. In summary, the improved exciton dissociation, reduced bimolecular recombination, and inhibited trap-assisted recombination enhance the JSC and FF of the Qx-PhBr-X-based devices, resulting in superior performance.
To gain insight into the charge extraction and recombination processes of the two acceptor-based devices, transient photocurrent (TPC) and transient photovoltage (TPV) decay curves are analyzed under short-circuit and open-circuit conditions, as shown in Fig. 2f and Fig. S10 (Supporting information), respectively. The charge extraction time (τext) and charge recombination lifetime (τrec) were determined from the TPC and TPV decay curves, respectively. The charge extraction time and charge recombination lifetime for the Qx-PhBr-X-based devices are 27.4 ns and 23.5 µs, respectively, while those for the Qx-PhBr-BO-based devices are 36.2 ns and 20.3 µs, respectively. The superior charge extraction capability and longer lifetime of Qx-PhBr-X could act on the enhanced JSC and FF. Overall, moving the branch site of the side chain from β-position to γ-position affords the target molecule more excellent charge transport properties, suppressed charge recombination, and enhanced charge collection, consistent with its more excellent JSC and FF [47].
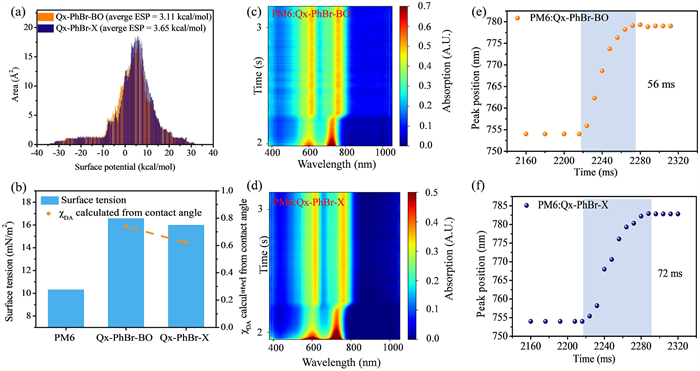
To investigate the origin of optimized charge properties in Qx-PhBr-X blends, the hetero-molecular interactions and molecular assembly during film formation were carefully studied. First, the surface electrostatic potential (ESP) distribution was calculated based on Qx-PhBr-BO and Qx-PhBr-X, and results were shown in Fig. 3a and Fig. S11 (Supporting information). The external branch point fine-tuned the ESP of NFAs, and the average ESP of Qx-PhBr-X was 3.65 kcal/mol, slightly higher than the 3.11 kcal/mol of Qx-PhBr-BO. Because the ESP of the donor is always lower than that of the acceptor [48], Qx-PhBr-X exhibits enhanced electrostatic interactions with PM6. The contact angles and the derived Flory–Huggins interaction parameters (χDA) further evaluate the influence of the branch site change on the hetero-molecular interactions (Fig. 3b). The contact angle test results and detailed data are presented in Fig. S12 and Table S5 (Supporting information). Due to the reduced surface tension from 16.58 mN/m2 in Qx-PhBr-BO to 16.00 mN/m2 in Qx-PhBr-X, the calculated χDA performs a lower value of 0.62 in Qx-PhBr-X than 0.74 in Qx-PhBr-BO with PM6, indicating better miscibility and stronger hetero-molecular interactions between Qx-PhBr-X and PM6, which is consistent with the ESP calculation. Hetero-molecular interaction made a measurable impact on the film formation process during spin coating. The in-situ UV–vis-NIR absorption of blend films during spin coating were shown in Figs. 3c and d, and Fig. S13 (Supporting information), and the time-dependent peak position of the 0−0 absorption peak for NFAs were selected to characterize the assembly process in Figs. 3e and f. Compared to PM6:Qx-PhBr-BO blends with a film formation time of 56 ms, PM6:Qx-PhBr-X performed a significantly prolonged time of 72 ms even with a more planar acceptor, which could be mainly attributed to the enhanced hetero-molecular interaction between Qx-PhBr-X and PM6. A longer film-forming time promoted the ordered molecule aggregation and the generation of fiber morphology, thereby optimizing the exciton dissociation and charge transport in the blend film.
Figure 3
Figure 3.
(a) Surface electrostatic potential distribution. (b) Surface energy and interaction parameters. The time evolution of the In-situ UV–vis absorption maps of PM6:Qx-PhBr-BO (c) and PM6:Qx-PhBr-X (d). Peak position evolution of the acceptor during film-formation of PM6:Qx-PhBr-BO (e) and PM6:Qx-PhBr-X (f).
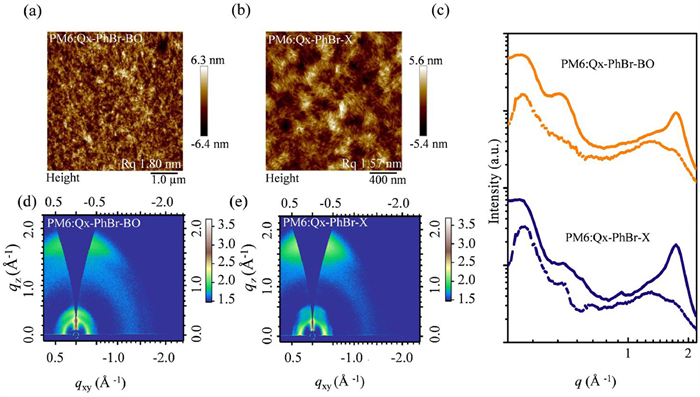
Transmission electron microscopy (TEM) and atomic force microscopy (AFM) measurements were further used to examine the phase separation scales and the nanoscale surface morphology of these two blend films. As shown in TEM images (Fig. S14 in Supporting information), the blend films of Qx-PhBr-BO show more pronounced bright and dark regions ascribed to its poor miscibility between Qx-PhBr-BO and PM6, which is not favorable for charge transport and may lead to carrier recombination. The values of RMS roughness from the AFM images (Figs. 4a and b) were determined to be 1.80 and 1.57 nm for the Qx-PhBr-BO and Qx-PhBr-X, respectively. The smaller RMS value indicates that PM6:Qx-PhBr-X blend films show a smoother and more homogeneous surface than that of PM6:Qx-PhBr-BO blend films, which is attributed to the enhanced intermolecular interactions and better donor-acceptor miscibility [49]. And PM6:Qx-PhBr-X blend films also performed an obvious fiber morphology originating from the optimized molecular assembly during film formation.
Figure 4
Figure 4.
(a, b) AFM images of PM6:Qx-PhBr-BO and PM6:Qx-PhBr-X blend films. (c) In-plane (solid lines) and out-of-plane (dashed lines) cuts. (d, e) Two-dimensional GIWAXS patterns.
The morphological differences resulting from the outward movement of the branches have profound effects on charge transport and exciton dissociation [50]. In particular, the smoother surface and finer phase separation in Qx-PhBr-X blend films promote more efficient charge extraction and reduce recombination, as evidenced by the higher JSC and FF values observed in the corresponding devices. Grazing incidence wide-angle X-ray scattering (GIWAXS) measurements were performed to investigate the effect of the branch site of side chains on the molecular stacking behavior and crystallization, and the corresponding data are summarized in Table S6 (Supporting information). 2D GIWAXS patterns of the neat films are presented in Fig. S15 (Supporting information). Qx-PhBr-BO and Qx-PhBr-X display an obvious (010) diffraction peak at 1.72 and 1.75 Å-1, respectively, in the out-of-plane (OOP) direction. The corresponding π-π stacking distances (dπ-π) for Qx-PhBr-BO and Qx-PhBr-X are estimated to be 3.65 and 3.59 Å, respectively. The tighter π-π stacking in Qx-PhBr-X film may be ascribed to the reduced steric hindrance with the branching sites away from the conjugated backbone, which is good for charge transport. As shown in Figs. 4d and e, the PM6:Qx-PhBr-BO and PM6:Qx-PhBr-X blend films exhibit clear and sharp (010) scattering peaks in the out-of-plane (OOP) direction located at about 1.73 and 1.72 Å-1, respectively, indicating that both of the blend films prefer face-on molecular orientation, which favors charge transport [51]. Specifically, the corresponding dπ-πs for these two copolymers are 3.63 and 3.67 Å, respectively. The changing trend of dπ-π in blend films is different from that in the pure acceptor films. After blending with PM6, the π-π stacking in Qx-PhBr-BO is enhanced, while the π-π stacking in Qx-PhBr-X is weakened. This is consistent with the results of molecular compatibility between the SMAs and PM6. Because of good molecular compatibility, the insertion of PM6 impedes Qx-PhBr-X aggregation during molecular stacking, resulting in an increased π-π stacking distance. The crystal coherence lengths (CCL) of the (010) diffraction peak calculated based on the Scherrer Equation are presented in Table S6 [52]. PM6:Qx-PhBr-X blend films showed smaller CCL values (28.71 Å) in blend films than that of PM6:Qx-PhBr-BO (34.54 Å). The smaller CCL value of PM6:Qx-PhBr-X blend films corresponds to their small domain size exhibited by the TEM images, thus avoiding the emergence of excessively large phase zones during the film formation process and thus facilitating charge transport.
In conclusion, two asymmetric acceptor molecules, Qx-PhBr-BO and Qx-PhBr-X, were designed and synthesized by changing the branching site of the outer side chain of bithiophene from the β-position to the γ-position in order to investigate the effect of the change of branching site on their photovoltaic properties and molecular aggregation. Moving the branching site to the γ-position could strengthen the molecular J-aggregation and redshift the absorption of the neat film. The device based on PM6:Qx-PhBr-BO only achieved a device efficiency of 16.28% because of the poor film morphology. The poor miscibility between PM6 and Qx-PhBr-BO resulted in excessive aggregation of Qx-PhBr-BO, which is not conducive to charge transport and extraction. In comparison, Qx-PhBr-X with the branching site located at the γ-site showed a more compatible match with the donor molecule, which is conducive to forming smoother surface morphology and moderate phase separation scale. Thus, the PM6:Qx-PhBr-X blend films exhibit better and more balanced carrier mobilities, suppressed charge recombination, and improved charge separation and collection. As a result, the Qx-PhBr-X-based device achieves a champion PCE of 17.16% with a VOC of 0.908 V, an increased JSC of 24.19 mA/cm2 and FF of 78.01%. This work establishes that outward shifting the side-chain branching point to γ-position is a powerful strategy to enhance photovoltaic performance by optimizing molecular stacking and film morphology.
Declaration of competing interest
The authors declare that they have no known competing financial interests or personal relationships that could have appeared to influence the work reported in this paper.
CRediT authorship contribution statement
Ruixiang Fang: Writing – original draft, Investigation, Data curation. Yilan Zhai: Investigation, Data curation. Huijuan Bi: Methodology, Data curation. Caixuan Wang: Methodology, Data curation. Ailing Tang: Writing – review & editing, Supervision, Methodology. Shiming Zhang: Writing – review & editing, Supervision, Investigation, Data curation. Zhixiang Wei: Supervision, Funding acquisition. Kun Lu: Writing – review & editing, Supervision, Investigation, Funding acquisition.
Acknowledgments
The authors acknowledge the financial support by the Beijing Natural Science Foundation (No. Z230018) and the Strategic Priority Research Program of the Chinese Academy of Sciences (No. XDB0520102), CAS Project for Young Scientists in Basic Research (No. YSBR-102).
Supplementary materials
Supplementary material associated with this article can be found, in the online version, at doi:10.1016/j.cclet.2025.111787.
[1]
W. Song, Q. Ye, Z. Chen, et al., Adv. Mater. 36 (2024) 2311170. doi: 10.1002/adma.202311170
[2]
X. Duan, W. Song, J. Qiao, et al., Energy Environ. Sci. 15 (2022) 1563–1572. doi: 10.1039/d1ee03989j
[3]
D. Wang, Y. Li, G. Zhou, et al., Energy Environ. Sci. 15 (2022) 2629–2637. doi: 10.1039/d2ee00977c
[4]
S. Guan, Y. Li, C. Xu, et al., Adv. Mater. 36 (2024) 2400342. doi: 10.1002/adma.202400342
[5]
Z. Wang, Y. Bo, P. Bai, et al., Science (1979) 382 (2023) 1291–1296. doi: 10.1126/science.adj3654
Figure 1
(a) Molecular structures of the two NFAs. DFT calculation of Qx-PhBr-BO (b) and Qx-PhBr-X (c). (d) Normalized solution and film absorption spectra. (e) Change of the maximum absorption peak positions from the solution to the film state of the two NFAs. (f) Energy levels of PM6, Qx-PhBr-BO, and Qx-PhBr-X.
Figure 2
(a) J–V curves of the corresponding optimized OSCs. (b) EQE curves and the according integrated current density curves. (c) Histograms of hole and electron mobilities of two NFAs-based devices. (d) Jphversus Veff curves of the OSCs. (e) Light intensity dependence of JSC values of the corresponding optimized devices. (f) TPC measurements of the optimized device.
Figure 3
(a) Surface electrostatic potential distribution. (b) Surface energy and interaction parameters. The time evolution of the In-situ UV–vis absorption maps of PM6:Qx-PhBr-BO (c) and PM6:Qx-PhBr-X (d). Peak position evolution of the acceptor during film-formation of PM6:Qx-PhBr-BO (e) and PM6:Qx-PhBr-X (f).

 DownLoad:

 下载:
下载:


 下载:
下载:
