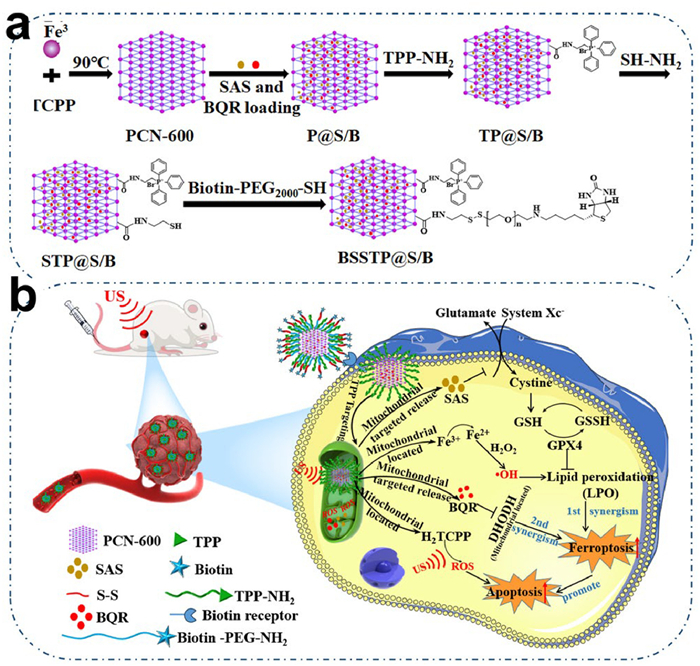
Scheme 1.
(a) Schematic diagram of the preparation and (b) dual synergism of ferroptosis with apoptosis of BSSTP@S/B for anti-tumor of SDT.

Glutathione-activated mitochondria-targeting nanosystem overcoming ferroptosis defence for dual synergism with apoptosis to enhance anti-tumor efficacy of sonodynamic therapy
Yirou Wang , Futing Yang , Jun Wang , Xinghua Liao , Chun Song , Michał Nowicki , Roman Szewczyk , Na Peng


According to the World Health Organization 2019 estimates, cancer is the first or second leading cause of human death [1]. Radiotherapy, surgery and chemotherapy are the commonly treatments for anti-tumor, but these methods exhibit disadvantages of high toxic side effects and lack of selectivity [2–4]. Therefore, researchers focus on the development of new methods with high selectivity, low toxicity, and minimal invasion to treat cancers. Sonodynamic therapy (SDT), a non-invasive approach, combines sonosensitizers, ultrasound (US) and oxygen (O2) to generate reactive oxygen species (ROS) for killing cancer cells [5]. SDT breaks through the barrier of low tissue penetration depth of photodynamic therapy and displays the advantages of being minimally invasive, radiation-free and low-cost [6]. Hematoporphyrin and its derivatives are currently the most widely used sonosensitizers due to the good biocompatibility, but show poor water solubility, non-specificity and low bioavailability [7,8]. Various nanocarriers such as liposomes, amphiphilic polymers, porous silica, have been developed for delivery of hematoporphyrin. However, the high concentration of hematoporphyrin encapsulated in nanocarriers is prone to self-quenching by π-π stacking, which leads to decrease in ROS and low efficacy of SDT [9].
With the development of nanotechnology, a series of nanometal organic frameworks (NMOFs) become one of the most extensive fields in SDT [10]. For instance, 5,10,15,20-tetrakis(4-carboxyphenyl)porphyrin (TCPP) is desirably applied to construct NMOFs, and the long-range ordered porphyrin structure in the crystals significantly advances the capability to produce ROS, which can act as an excellent sonosensitizer [11]. SDT is mainly resulted from ROS accumulation and cavitation to cause cell apoptosis, which is usually blocked to limit therapeutic efficacy due to the mutation of cancer cells [12,13]. Therefore, the utilization of non-apoptotic cell death would open up new therapeutic avenues for eradicating the survival of apoptosis-resistant cells [14–16]. Ferroptosis is an iron-dependent, non-apoptotic form of cell death that caused by the inhibition of cystine-glutamate reverse transporter (system Xc−) expression in the cell membrane, which reduces intracellular cystine uptake, depletes intracellular glutathione (GSH), eventually leads to glutathione peroxidase 4 (GPX4) inactivation and lipid peroxidation accumulation [17–19], for example, sulfasalazine (SAS), could inhibit cysteine uptake to cause ferroptosis [20]. It is demonstrated that induction of targeted ferroptosis is one of the most effective ways to reshape and promote cell apoptosis [21]. However, at least three cellular protective systems suppress ferroptosis, including cytoplasmic/mitochondrial GPX4, plasmatic ferroptosis suppressor protein 1 (FSP1) and mitochondrial dihydroorotate dehydrogenase (DHODH). Especially, DHODH inhibits ferroptosis in the mitochondrial inner membrane by reducing ubiquinone to ubiquinol (CoQH2) [22]. Inactivation of DHODH in mitochondria induce extensive mitochondrial lipid peroxidation and ferroptosis in low GPX4-expressed cancer cells, which could synergize with ferroptosis inducers (e.g., SAS) to cause such effects in high GPX4-expressed cancer cells [23]. Brequinar (BQR), a DHODH inhibitor that interferes with DNA and RNA synthesis, has been tested in large-scale clinical trials for the treatments of advanced melanoma, gastrointestinal cancers, and head squamous cell carcinoma. Whereas, high doses of BQR may cause bone marrow suppression, nausea, vomiting, diarrhea and other toxic side effects due to off-target therapies. Therefore, the selective accumulation of BQR and SAS in mitochondria will inactivate DHODH and rescue anti-ferroptosis [24].
Furthermore, according to the tumor microenvironment, the introduction of targeted moieties into NMOFs for delivery of acoustic sensitizers can improve their concentrations at specific sites [25]. Especially, mitochondria, are a main source of ROS and also play a vital role in the occurrence of cell apoptosis [26,27]. Targeting delivery of sonosensitizer-contained NMOFs, SAS and BQR into the mitochondria of cancer cells for SDT is expected to restore anti-ferroptosis and promote cell apoptosis for killing cancer cells more directly and effectively than other subcellular organelles. Lipid cations are often adopted as mitochondria-targeting groups, such as triphenylphosphine (TPP), but the strong positive electricity makes them easy to bind with proteins and quickly cleared in the blood circulation [28–30]. Recently, a series of strategies were developed to shield the positive charge of mitochondria-targeting groups in the process of blood circulation, for example, charge reversal. Wu et al. have integrated a novel dual-functional liposome system possessing both extracellular charge reversal and mitochondrial targeting properties to enhance drug accumulation in mitochondria and trigger apoptosis of cancer cells [31].
Herein, TCPP as the acoustically sensitive bridging ligand and biocompatible Fe ions as the linkage were used to construct PCN-600, for loading ferroptosis inducer SAS and DHODH inhibitor BQR via the hollow structures, and finally, surface-modified with long and short chains that separately consisted tumor and mitochondria targeting elements of biotin and TPP (BSSTP@S/B). The long chain contained disulfide (S-S) bonds that is stable in normal cells, but cleavable by GSH in cancer cells to re-expose TPP (Scheme 1a), because the concentration of GSH (2–10 mmol/L) in cancer cells is 4 times higher than that in normal cells, especially in drug-resistant tumor cells, GSH is even 10 times higher [32]. BSSTP@S/B could successfully accumulate in mitochondria of cancer cells, generate ROS from PCN-600 by US activation, release SAS to inhibit the expression of system Xc− on the cancer cell-membrane, leading to the cystine uptake pathway interrupted and inducing ferroptosis with reduced GPX4 expression, and simultaneously the released BQR inhibited DHODH to overcome ferroptosis resistance for inducing greater ferroptosis which dual-synergism with apoptosis to enhance damage to cancer cells (Scheme 1b). The physicochemical properties, cytotoxicity, in vivo anti-tumor efficacy and mechanism of BSSTP@S/B were comprehensively characterized by transmission electron microscopy (TEM), dynamic light scattering (DLS), ultraviolet-visible spectroscopy (UV–vis) spectrophotometer, MTT assay, Western blot (WB), confocal laser scanning microscope (CLSM), flow cytometry (FCM), and hematoxylin-eosin (H&E) staining.
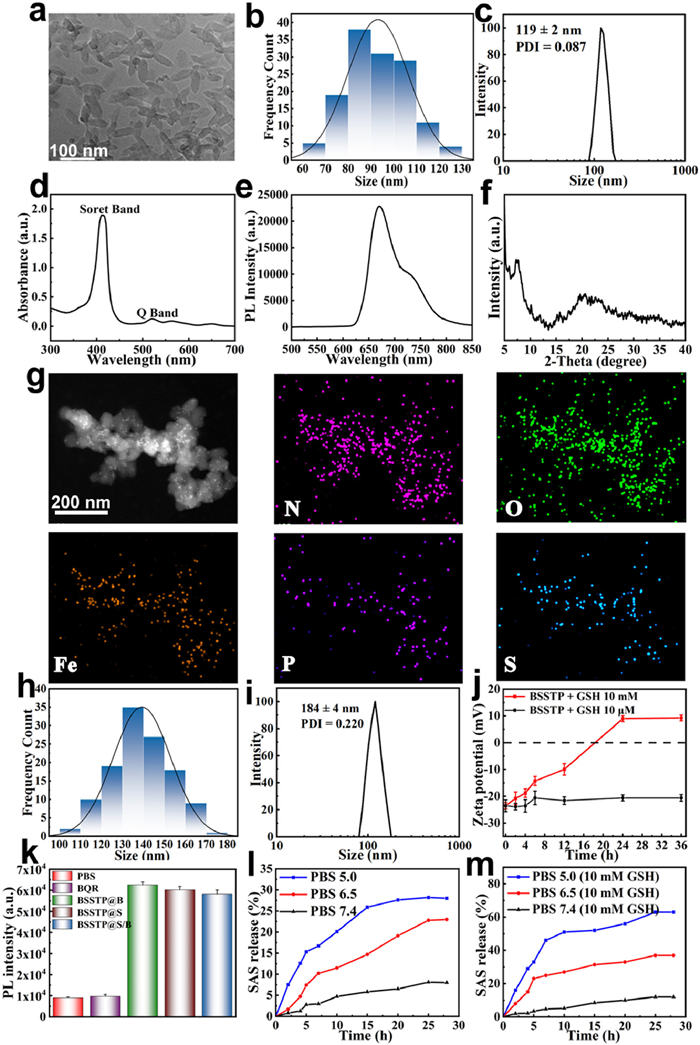
PCN-600 was synthesized by coordination of Fe3+ and TCPP by solvothermal method [33]. As shown in Fig. 1a, the synthesized PCN-600 had a fusiform structure via observation by TEM, and then, the quantitative statistics of PCN-600 in the TEM diagram were carried out to obtain a particle size histogram (Fig. 1b), from which most of the particle size of PCN-600 was distributed in 80–90 nm. However, the hydrated particle size of PCN-600 measured by DLS was 119 nm (Fig. 1c), which was larger than that measured by TEM. The UV–vis spectroscopic analysis of PCN-600 showed a strong absorption peak at around 425 nm (Soret band) and four weak absorption peaks (Q bands) between 500 nm and 700 nm (Fig. 1d), which were attributed to the absorption of TCPP in PCN-600 between 500 nm and 700 nm [34]. As shown in Fig. 1e, under the excitation of 420 nm, the fluorescence spectrum of PCN-600 showed a strong absorption peak at about 680 nm, which was caused by the strong fluorescence performance of TCPP. Powder X-ray diffraction (PXRD) pattern of the synthesized PCN-600 showed the two most intensive peaks around at 2θ of 5.4° and 8.1° (Fig. 1f), which was well consisted with the reported structure of PCN-600 [35]. The synthesis process and 1H NMR spectrum of TPP-NH2 were shown in Fig. S1 (Supporting information). The chemical shifts of peak a at 7.73–7.94 ppm were the aromatic peaks of TPP, the chemical shifts of peaks b and c at 4.0 and 3.2 ppm were assigned to the characteristic peaks of -CH2 connected with P, and -CH2 connected with -NH2, respectively, and the chemical shifts of peak d at 2.32 ppm was belonged to the characteristic peak of -NH2, which revealed that TPP-NH2 was successfully synthesized.
Due to the high porosity and large specific surface area of NMOFs, we used the cavity structure of PCN-600 to load SAS and BQR. The hydrated particle size of P@S/B measured by DLS was about 138 nm with the zeta potential of −28 mV, which showed that after loading SAS and BQR, the average size and zeta potential of P@S/B increased and decreased slightly, respectively (Table S1 in Supporting information). To endow P@S/B with the ability for targeting to the mitochondria of cancer cells, a short chain contained TPP and a long chain contained biotin connected by S-S bonds were modified. Subsequently, the modification at each step was examined by inductively coupled plasma mass spectrometry (ICP-MS) and zeta potential detection. Since the S element of SAS in BSSTP@S/B affects the characterization of long chains of biotin connected by S-S bonds on the surface of PCN-600, BSSTP without loading SAS and BQR is selected to demonstrate the feasibility of surface modification. After the introduction of TPP groups on the surface of PCN-600 (marked as TP) by amidation reaction, the content of P element in TP nanoparticles measured by ICP-MS was 689.54 µg (Table S2 in Supporting information), and the zeta potential increased from −22 mV to 23 mV (Table S1). The significantly inverted zeta potential of PCN-600 further indicated that TPP groups were successfully modified onto the surfaces of PCN-600. On this basis, 2-aminoethanethiol contained sulfhydryl groups at one end was modified onto the surfaces of TP by amidation reaction to obtain STP, and the content of S in STP was 8032.59 µg. DLS results illustrated that the modification of sulfhydryl groups increased the zeta potential of STP (37 mV). Finally, STP were linked with long chains of biotin contained sulfhydryl groups at one end by sulfhydryl crosslinking reaction to obtain BSSTP. The content of S element in BSSTP was 16,754.15 µg, and the obvious increase in S content indicated that the long chains contained biotin were further successfully introduced onto STP by forming S-S bonds. Moreover, after modification with long-chain biotin by sulfhydryl crosslinking, the zeta potential of BSSTP decreased to −18 mV (Table S1). Changes in P, S content and zeta potential after surface modifications of PCN-600 together illustrated the successful introduction of short chain contained TPP and long chain contained biotin groups connected by S-S bonds. In addition, the control samples of mSSTP@S, BTP@S and BSSP@S encapsulated SAS were without biotin, S-S bonds and TPP, respectively (Fig. S2 in Supporting information), and the average particle size and zeta potential of mSSTP@S, BTP@S, BSSP@S, BSSTP@S, BSSTP@B and BSSTP@S/B were 115, 147, 171, 176, 122, 184, and −15, −18, −17, −15, −33, −34 mV, respectively (Table 1). Moreover, the standard curves of SAS and BQR in DMF was shown in Figs. S3a and b (Supporting information). The loading of SAS and BQR in BSSTP@S/B was 18.20% and 14.13%, respectively.

 DownLoad:
CSV
DownLoad:
CSV
| Sample | Size (nm) | PDI | Zeta (mV) | DLC (%) (SAS) | DLC (%) (BQR) |
| mSSTP@S | 115 ± 4 | 0.165 | −15 | 18.17 | 14.30 |
| BTP@S | 147 ± 2 | 0.144 | −18 | 18.52 | 15.31 |
| BSSP@S | 171 ± 3 | 0.139 | −17 | 17.66 | 14.53 |
| BSSTP@S | 176 ± 2 | 0.163 | −15 | 32.33 | – |
| BSSTP@B | 122 ± 4 | 0.182 | −33 | – | 30.45 |
| BSSTP@S/B | 184 ± 4 | 0.220 | −34 | 18.20 | 14.13 |
As shown in Fig. 1g, the morphology of BSSTP@S/B was observed by TEM. Compared to that of PCN-600, after modified with the short chain contained TPP and the long chain contained biotin connected by S-S bonds, the particle size of BSSTP@S/B increased significantly, and the morphologies changed from the spindle shapes of PCN-600 to the spherical shapes of BSSTP@S/B. TEM element scanning analysis displayed the distribution of N, O, Fe, P and S elements in the mapping plot of BSSTP@S/B, which further demonstrated the successful preparation of BSSTP@S/B. The quantitative statistics of BSSTP@S/B in the TEM diagram were carried out to obtain a particle size histogram (Fig. 1h), from which most of the particle size of BSSTP@S/B was distributed at 130–140 nm. Whereas, the hydrated particle size of BSSTP@S/B measured by DLS was about 184 nm (Fig. 1i). The stability of BSSTP@S/B in phosphate buffered saline (PBS7.4) and RPMI 1640 contained 10% fetal bovine serum (FBS) within 7 days was further examined by DLS. The average particle size of BSSTP@S/B in PBS7.4 was around 170 nm within 7 days, and the zeta potential was about −16 mV which did not fluctuate much (Fig. S4a in Supporting information). The mean size of BSSTP@S/B in RPMI 1640 contained 10% FBS (199 nm) was a little larger than that in PBS7.4, which may be due to the slight agglomeration of BSSTP@S/B in the high viscosity serum. No significant changes in the average particle size and zeta potential of BSSTP@S/B incubated in PBS7.4 and RPMI 1640 contained 10% FBS within 7 days, indicating that BSSTP@S/B had good stability in PBS7.4 and RPMI 1640 contained 10% FBS (Figs. S4b and c in Supporting information).
To further illustrate our supposition of the charge reversal of BSSTP for the mitochondria-targeting ability within cancer cells, the effect of GSH concentration on the surface charges was examined. As shown in Fig. 1j, when GSH concentration was low as 10 µmol/L, the zeta potential of BSSTP did not change significantly, while when GSH concentration reached 10 mmol/L, the zeta potential increased evidently within 24 h, which indicated that the S-S bonds on the surface of BSSTP nanoparticles were cleaved to re-expose TPP groups. The results exhibited that the prepared BSSTP would not reverse in charge in normal cells (with low GSH concentration), however, when BSSTP entered cancer cells, the high concentration of GSH caused the surface charge of BSSTP reversed to positive charge with exposure of TPP groups, which leading to better mitochondria-targeting performance.
Firstly, we examined the ROS production of PCN-600 under different conditions to select the optimal US power and time, so the ROS production of PCN-600 at the same concentration under different ultrasonic powers and ultrasonic times was explored. When the concentration of PCN-600 was constant (50 µg/mL), the fluorescence intensity of PCN-600 increased with the increase of US power, among which, PCN-600 displayed the highest fluorescence intensity at the US power of 1.15 W/cm2, indicating the maximum ROS were produced (Fig. S5a in Supporting information). At an ultrasonic power of 1.15 W/cm2, the ROS produced by PCN-600 did not keep increase with the extension of ultrasonic time, and the amount of ROS produced reached the highest value after 4 min of US irradiation (Fig. S5b in Supporting information).
Subsequently, the ROS production of SAS, PCN-600, P@S, mSSTP@S, HMR@S, BSSTP, BTP@S, BSSP@S, BSSTP@S (1:2), BSSTP@S (1:1), and BSSTP@S (1:0.5) with US treatments was firstly evaluated. As shown in Fig. 1k and Fig. S6a (Supporting information), SAS and BQR did not produce ROS, and PCN-600 produced about 6 times more ROS after US irradiation than that of PBS group, indicating that PCN-600 had a strong ability in ROS generation under US irradiation. ROS generation capacity of P@S was slightly weaker than that of PCN-600, possibly because the loading of SAS occupies the cavity of PCN-600, making it difficult to release ROS inside the cavity and resulting in weakened ROS yield. The mSSTP@S, BSSTP, BTP@S, BSSP@S, BSSTP@S (1:2), BSSTP@S (1:1) and BSSTP@S (1:0.5) groups produced slightly weaker ROS than that of PCN-600, possibly because the short and long chains modified on the surface of P@S impeded the release of a small portion of ROS, which resulted in the fluorescence intensity being slightly weaker than that of PCN-600. On the basis of the above results, we further together evaluated the ROS production of BQR, BSSTP@B, BSSTP@S and BSSTP@S/B with US treatments. As shown in Fig. 1k, all BSSTP@B, BSSTP@S and BSSTP@S/B groups showed strong abilities in ROS production, and the BSSTP@S/B group exhibited slightly weaker ROS than that of BSSTP@B and BSSTP@S, possibly owed to the co-loading of SAS and BQR occupied more cavity of PCN-600 leading to slow exposure of ROS. We chose to test the release of SAS to evaluate the release behaviors of BSSTP@S/B. As shown in Fig. 1l, the release rate of SAS from BSSTP@S/B at different pH was determined, and in PBS at pH7.4, pH6.5 and pH5.0, the cumulative release rates of SAS within 28 h were 9%, 23% and 28%, respectively. There was no large amount of SAS released over time, possibly because the surface of BSSTP@S/B modified with the protective long chains, which reduced the release of SAS. Furthermore, the release rate of SAS at different pH contained 10 mmol/L GSH was examined. As shown in Fig. 1m, the cumulative release rates of SAS after 28 h incubation in PBS7.4, PBS6.5, and PBS5.0 were 12%, 37%, and 65%, respectively, which showed that the S-S bonds of BSSTP@S/R were broken in the presence of high concentrations of GSH and quicken the release of SAS.
The cytotoxicity of the samples on 4T1 cells was evaluated by MTT method. As shown in Fig. 2a, the cytotoxicity of all groups increased with raising concentrations of PCN-600 under US irradiation. Additionally, the half maximal inhibitory concentration (IC50) values of SAS, PCN-600, P@S, mSSTP@S, HMR@S, BSSTP, BTP@S, BSSP@S, BSSTP@S (1:2), BSSTP@S (1:1) and BSSTP@S (1:0.5) were 71.77, 36.53, 8.37, 6.00, 7.19, 4.44, 3.41, 2.29, 1.11, 1.89 and 2.47 µg/mL. Among them, BSSTP@S (1:2) group displayed the greatest cytotoxicity, and the survival rate at the maximum concentration of 25 µg/mL PCN-600 was as low as 13.5%, which was attributed to the surface modification of tumor-targeted biotin and mitochondria-targeted TPP groups of BSSTP@S enhanced the enrichment in mitochondria of cancer cells and thus caused a greater cell-killing effect. The combination index (CI) value of HMR@S, BSSTP and BSSTP@S (1:2) was 0.225 (CI < 1), which demonstrated that the loading of ferroptosis inducer SAS of BSSTP@S showed the first-leveled synergistic anti-tumor efficacy with BSSTP.
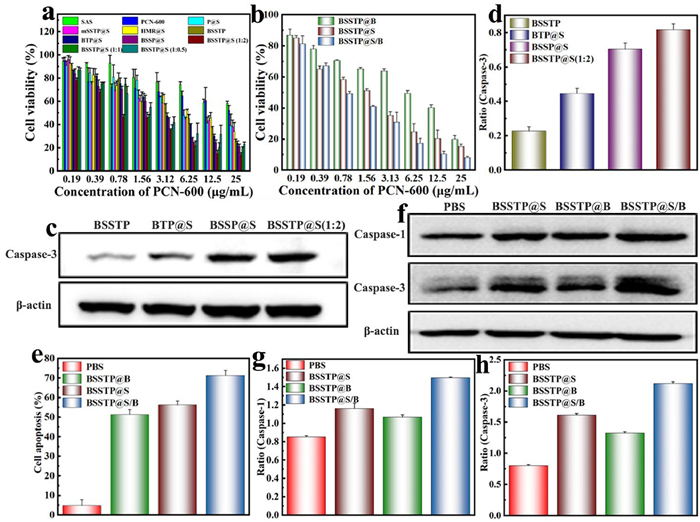
As known the presence of DHODH in mitochondria will inhibit ferroptosis. Therefore, to avoid anti-ferroptosis and induce improved apoptosis, the DHODH inhibitor BQR was co-loaded into BSSTP@S to explore the cytotoxicity on 4T1 cells with BSSTP@B and BSSTP@S (1:2) (simplified as BSSTP@S) which showed the best cytotoxicity compared with BSSTP@S (1:1) and BSSTP@S (1:0.5). As shown in Fig. 2b, the BSSTP@S/B group displayed the greatest cytotoxicity, and at the maximum concentration of 25 µg/mL PCN-600, the survival rate was as low as 8.15%. In the GPX4low environment, BQR can evoke the anti-ferroptosis of cancer cells via inhibited the expression of DHODH and produced more ROS, led to greater damage on 4T1 cells, so BSSTP@S/B displayed stronger cytotoxicity on 4T1 cells than that of BSSTP@S and BSSTP@B. Moreover, the IC50 values of BSSTP@B, BSSTP@S and BSSTP@S/B were 4.46, 1.11 and 0.78 µg/mL, the CI value of BSSTP@B, BSSTP@S and BSSTP@S/B was 0.75 (CI < 1), which demonstrated the second-leveled synergistic anti-tumor efficacy of BSSTP@S and BSSTP@B for BSSTP@S/B.
To further investigate the capability of BSSTP@S/B for targeting to the mitochondria of cancer cells, we applied CLSM to examine the subcellular distributions of PCN-600 in 4T1 cells, and ROS generation under US irradiation (0.87 W/cm2, 30 s). The mitochondria of 4T1 cells after treatments with mSSTP@S, BTP@S, BSSP@S and BSSTP@S/B for 6 h were stained by Mito-Tracker Green, and cell nuclei were marked as blue fluorescence. TCPP shows red fluoresce at around 660 nm under excitation at 560 nm. As shown in Fig. S7a(I) (Supporting information), only a small amount of red fluorescence was observed in 4T1 cells after incubated with mSSTP@S, and the colocalization coefficient of fluorescence between mSSTP@S and mitochondria was 0.24. Almost the same phenomenon of red fluorescence was observed within 4T1 cells after treated with BTP@S and BSSP@S, suggesting that the absence of tumor-targeted biotin groups may result in low cellular uptake. Moreover, after BTP@S entered the cells, the long chain contained biotin but without S-S bonds cannot be cleaved, and kept shielding TPP groups, thus showed weak mitochondria-targeting performance. The colocalization coefficients of BTP@S were similar to that of BSSP@S without TPP groups, which were 0.43 and 0.46, respectively. The results illustrated that without the GSH-responsive S-S bonds, the short chain contained TPP groups would be shielded to weak the mitochondria-targeting ability. Strong red fluorescence could be observed in cells co-cultured with BSSTP@S and the colocalization coefficient of BSSTP@S with the mitochondria reached 0.79 (Fig. S7b in Supporting information), which originated from the first targeting to cancer cells, and the cleaved S-S bonds by consuming the excessive intracellular GSH leading to the sequential targeting to the mitochondria of cancer cells. In addition, CLSM observation was further conducted for BSSTP@S/B in normal cells of 3T3 cells. As shown in Fig. S8 (Supporting information), the intracellular fluorescence was relatively weak, and the co-localization coefficient indicated significantly poorer mitochondrial targeting in 3T3 cells (0.15) of BSSTP@S/B compared to that in 4T1 cells (0.79), providing further evidence for the GSH-activated mitochondrial targeting capability of BSSTP@S/B in cancerous cells.
Intracellular generated ROS was labeled by non-fluorescent 2′,7′-dichlorodihydrofluorescein diacetate (DCFH-DA) that converted to DCF via oxidized by ROS and showed as visible green dots. As shown in Fig. S7a(Ⅱ), the generation of intracellular ROS was observed after treatments with mSSTP@S, BTP@S, BSSP@S and BSSTP@S/B for 6 h under US irradiation (0.87 W/cm2, 30 s). Weak green fluorescence was observed in mSSTP@S, BTP@S and BSSP@S-treated cells. In contrast, 4T1 cells co-incubated with BSSTP@S/B displayed significant green fluorescence, indicating that BSSTP@S/B entered the cells and re-exposed TPP to target to mitochondria for directly producing ROS under US activation. The ROS generated in 4T1 cells after different treatments were also quantitatively detected by FCM. The ROS generated by PBS, SAS, PCN-600, P@S, mSSTP@S, HMR@S, BSSTP, BTP@S, BSSP@S, BSSTP@S (1:2), BSSTP@S (1:1) and BSSTP@S (1:0.5) groups were 1.28 × 10⁵, 1.77 × 10⁵, 5.71 × 10⁵, 7.29 × 10⁵, 9.82 × 10⁵, 9.97 × 10⁵, 1.05 × 10⁶, 1.15 × 10⁶, 1.45 × 10⁶, 1.84 × 10⁶, 1.69 × 10⁶ and 1.28 × 10⁶, respectively (Figs. S6b and c in Supporting information). The quantitative results of intracellular ROS were in accordance with that by CLSM observation, which further demonstrated the actions of successful targeting to mitochondria of cancer cells, the first-leveled synergistic efficacy of loaded SAS and PCN-600 of BSSTP@S (1:2) enhanced the ability to produce ROS. Therefore, we chosen the best ROS-production group of BSSTP@S (1:2) to further compared with that of BSSTP@B and BSSTP@S/B. As shown in Fig. S7c (Supporting information), the ROS generated by PBS, BSSTP@S, BSSTP@B and BSSTP@S/B groups were 1.37 × 10⁵, 1.80 × 10⁶, 1.67 × 10⁶ and 3.06 × 10⁶, respectively. The quantitative results of intracellular ROS clearly showed that BSSTP@S/B was significantly higher than that of BSSTP@S and BSSTP@B, which demonstrated that the mitochondria-targeted delivery of BQR maybe devast ferroptosis defense, and further activated anti-apoptosis system to generate more ROS which causes serious damage to cancer cells.
Apoptotic pathways include exogenous pathways mediated by death receptors and endogenous pathways mediated by mitochondria. Under the stimulation of apoptosis signaling, the changes in mitochondrial membrane permeability and mitochondrial membrane potential lead to the release of cytochrome C, thus cause the activation of caspase-9, which in turn activates caspase-3. Therefore, the activation of caspase-3 is considered as an important marker of mitochondria-mediated apoptosis. To first verify the effects of targeting to mitochondria of cancer cells and the loading of ferroptosis inducer SAS on improved apoptosis of BSSTP@S, the expression of caspase-3 in 4T1 cells after different treatments under US irradiation was examined by WB. As shown in Fig. 2c, the expression of caspase-3 in BSSTP-treated 4T1 cells was relatively weak. 4T1 cells treated with BTP@S and BSSP@S showed stronger expression of caspase-3 than that of BSSTP, which may be attributed to the synergistic effect of encapsulated PCN-600 and SAS of BTP@S and BSSP@S that promoted cell apoptosis. BSSTP@S (1:2) group showed the strongest expression of caspase-3, which may result from not only the first-leveled synergistic efficacy, but also the successful mitochondria-targeting of cancer cells. As shown in Fig. 2d, the quantitative analysis of caspase-3 ratios in 4T1 cells co-incubated with BSSTP, BTP@S, BSSP@S and BSSTP@S (1:2) were 0.228, 0.446, 0.703 and 0.817, respectively, which further demonstrated the death mechanism of 4T1 cells treated by BSSTP@S (1:2) was related to mitochondria-dependent apoptotic pathways.
To further verify the second-leveled synergistic efficacy of loading ferroptosis inducer SAS and DHODH inhibitor BQR of BSSTP@S/B on cell apoptosis, apoptosis of 4T1 cells after treatments of BSSTP@S, BSSTP@B and BSSTP@S/B was quantitatively detected via Annexin V-FITC/PI double staining by FCM. As shown in Fig. 2e and Fig. S9 (Supporting information), the PBS, BSSTP@S, BSSTP@B and BSSTP@S/B groups after US treatments exhibited the total apoptosis rates of early and late apoptosis at 4.9%, 51.4%, 56.2% and 71.3%, respectively. Compared with BSSTP@S and BSSTP@B groups, the apoptosis rate of BSSTP@S/B clearly increased which may be ascribed to the released SAS in mitochondria of 4T1 cells could induce ferroptosis to promote cell apoptosis of SDT and concurrently the released BQR in mitochondria of 4T1 cells further overcome ferroptosis resistance for dual-synergism with apoptosis to enhance the anti-tumor efficacy of SDT. In addition, 4T1 cells treated with BSSTP@S/B showed stronger expression of caspase-1 and caspase-3 than that of BSSTP@S and BSSTP@B (Fig. 2f), which is attributed to the dual-synergism of encapsulated SAS and BQR of BSSTP@S/B that devastated anti-ferroptosis that initiated by inducing ferroptosis to further activate ferroptosis and simultaneously enhanced cell apoptosis. The quantitative analysis of caspase-1 and caspase-3 ratios (Figs. 2g and h) in 4T1 cells also indicated that BSSTP@S/B group induced the strongest apoptosis.
GSH depletion, glutathione peroxidase 4 (GPX4) inactivation, and intracellular lipid peroxidation are important indicators of ferroptosis in cells. To verify the actions of encapsulated SAS, and mitochondria-targeting of BSSTP@S to cancer cells on ferroptosis. Firstly, we detected the depletion of intracellular GSH after PBS, BSSTP, BTP@S, BSSP@S, and BSSTP@S (1:2) treatments with US (0.87 W/cm2, 30 s). As shown in Fig. 3a, it was found that BSSTP without loading SAS had a relatively weak ability to consume GSH, mainly through the breakage of S-S bonds and the reduction of Fe3+ to Fe2+. Whereas, 4T1 cells co-incubated with BTP@S, BSSP@S, and BSSTP@S (1:2) demonstrated strong GSH consumption capability. Among them, the lowest level of GSH in 4T1 cells co-incubated with BSSTP@S (1:2) was displayed, demonstrating that the loaded SAS inhibited the function of System Xc- and depleted GSH to induce ferroptosis after BSSTP@S (1:2) targeted to mitochondria of cancer cells. Secondly, the level of lipid peroxidation of 4T1 cell membranes and the degree of damage to cell membranes were reflected by detecting the levels of intracellular MDA in PBS, BSSTP, BTP@S, BSSP@S, and BSSTP@S (1:2) groups with US (0.87 W/cm2, 30 s). As shown in Fig. 3b, BSSTP-treated cells produced the least amount of MDA, indicating weak level of lipid peroxidation. However, the highest amount of MDA was produced in 4T1 cells co-incubated with BSSTP@S (1:2), which may be ascribed to the cleaved S-S in BSSTP caused further exposure of the TPP groups to enable SAS localized efficiently in mitochondria and triggered more severe ferroptosis. Therefore, BSSTP@S (1:2) treatment can cause significant changes in intracellular lipid peroxidation, which in turn caused serious damage to cell membranes. The results of lipid peroxidation were consistent with that of the depletion of intracellular GSH. Since SAS can inhibit the expression of system Xc− on cancer cell membranes, possibly due to the disruption of cystine uptake pathway and induce ferroptosis. xCT is a functional subunit of system Xc−, which can regulate the exchange of intracellular glutamate and extracellular cystine, so the expression of xCT can be used to reflect the expression level of system Xc−. We determined the expression of system xCT and downstream of GPX4 that may be affected by GSH depletion via WB. As shown in Fig. 3c, the system xCT and GPX4 levels in 4T1 cells were significantly downregulated after BSSTP@S (1:2) treatment, which demonstrated the system xCT pathway was involved in BSSTP@S (1:2)-induced ferroptosis. As shown in Figs. 3d and e, the quantitative analysis of xCT and GPX4 ratios in 4T1 cells co-incubated with BSSTP, BTP@S, BSSP@S and BSSTP@S (1:2) were1.035, 0.963, 0.688, 0.394 and 1.057, 0.809, 0.430, 0.195, respectively, which also demonstrated the death mechanism of 4T1 cells treated by BSSTP@S (1:2) was related to ferroptosis pathways.
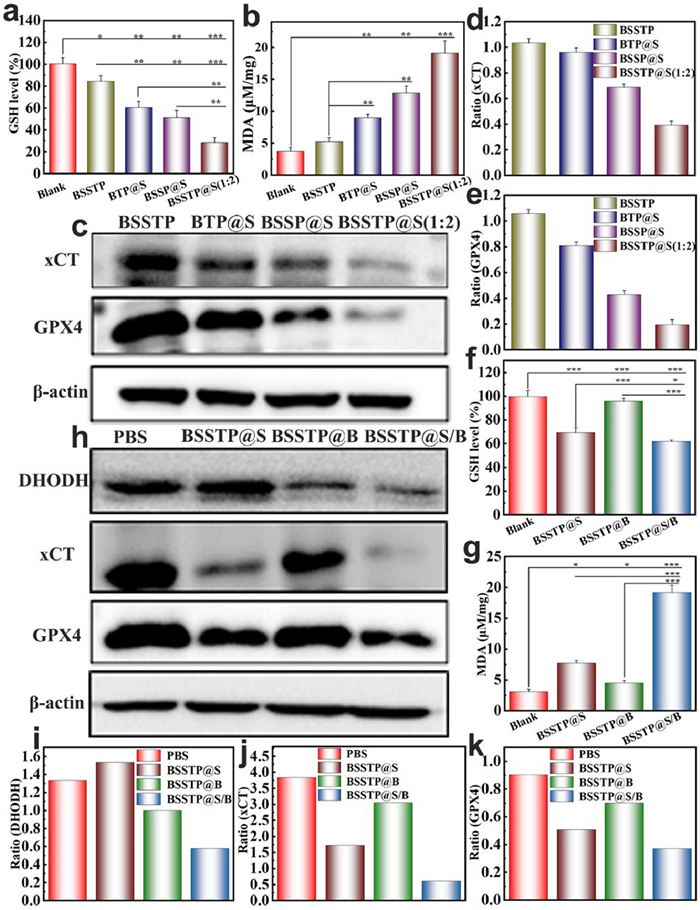
Whereas, DHODH inhibits ferroptosis in mitochondria by regulating the production of CoQH2 in the mitochondrial inner membrane. The inactivation of DHODH in mitochondria will induce widespread lipid peroxidation and enhanced ferroptosis. Therefore, BQR was loaded together with SAS into BSSTP for devastating anti-ferroptosis. Firstly, we detected the depletion of intracellular GSH and the levels of intracellular MDA after BSSTP@S, BSSTP@B and BSSTP@S/B treatments with US (0.87 W/cm2, 30 s). As shown in Figs. 3f and g, the lowest level of GSH and the highest amount of MDA were examined in 4T1 cells treated by BSSTP@S/B. Collectively, it was found that targeting delivery of SAS and BQR into mitochondria of 4T1 cells by BSSTP@S/B could efficiently trigger the ferroptosis with increase of MDA and decrease of GSH. The expression of DHODH, xCT and GPX4 was conducted simultaneously with that of caspase-1 and caspase-3 (Fig. 2f) with the same internal reference of β-actin. As shown in Fig. 3h, the expression of DHODH is high in the case of BSSTP@S, which originated from the activated anti-ferroptosis system. However, the expression of DHODH obviously reduced in BSSTP@S/B group, and the system xCT and GPX4 levels of 4T1 cells was also significantly downregulated after BSSTP@S/B treatment, which indicated that the further loading of BQR could devastate mitochondrial ferroptosis defense and evoke robust ferroptosis via the DHODH—CoQH2 system. As shown in Figs. 3i–k, the quantitative analysis of DHODH, xCT and GPX4 ratios in 4T1 cells also indicated BSSTP@S/B group showed the strongest ferroptosis.
The in vivo biodistribution of mSSTP@S, BTP@S, BSSP@S and BSSTP@S/B nanoparticles at different time points was detected using a real-time fluorescence imaging system. As shown in Fig. S10 (Supporting information), the fluorescence signal of PCN-600 was observed at the tumor sites after 12 h of tail vein injection of different nanoparticles, and due to the presence of tumor-targeting biotin in BTP@S, BSSP@S and BSSTP@S/B groups, they showed preferential accumulation at the tumor sites when compared to that of mSSTP@S, and displayed the peak fluorescence intensity at 24 h after injection. The fluorescence intensity in the tumor of BSSTP@S/B-treated mouse was the strongest, which originated from the successful mitochondria-targeting to cancer cells and the re-exposed positive charge of TPP groups favored more accumulation of BSSTP@S/B. Subsequently, the fluorescence of BSSTP@S/B gradually disappeared over the next 24 h. After 48 h, the nanoparticles were basically metabolized completely, indicating that BSSTP@S/B displayed good biocompatibility. By exploring the in vivo distribution of nanoparticles in mice, it was beneficial for accurately and timely US treatment of the mice injected with different nanoparticles in the following experiments.
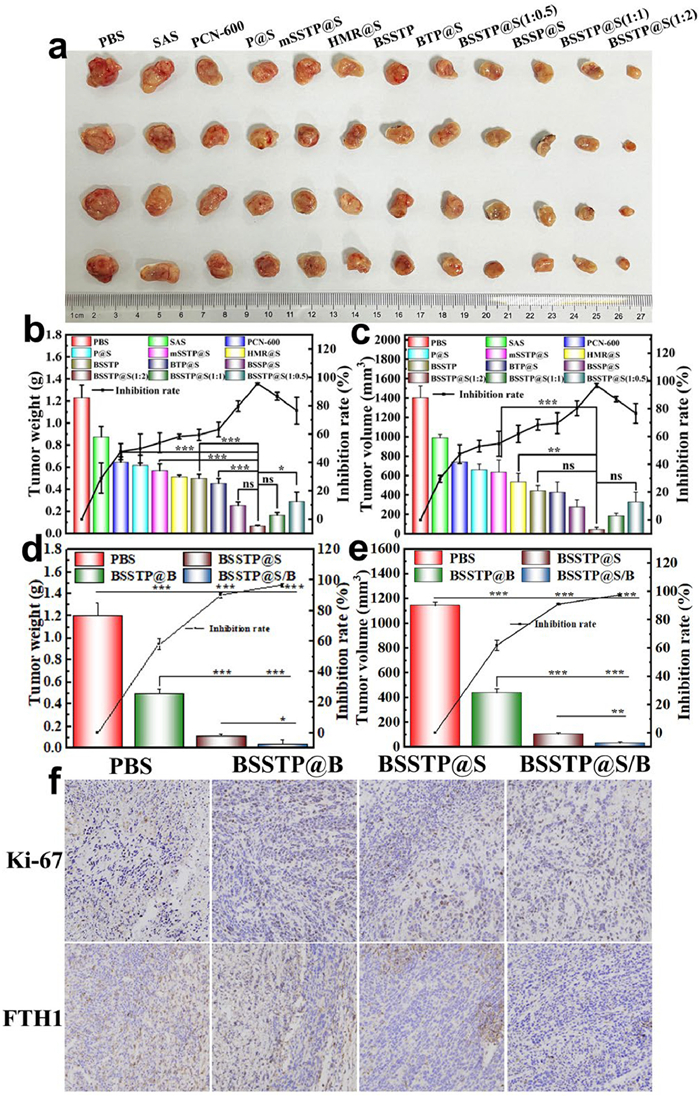
The anti-tumor efficacy of SAS, PCN-600, P@S, mSSTP@S, HMR@S, BSSTP, BTP@S, BSSP@S, BSSTP@S (1:2), BSSTP@S (1:1) and BSSTP@S (1:0.5) was firstly evaluated by 4T1 cell-bearing BALB/c mice at concentration of 5 mg/kg PCN-600. All animal experiments were approved by the Laboratory Animal Center of Wuhan University of Science and Technology (No. 2021232). When the tumors grew to the volume of around 100 mm3, 48 mice were divided into 12 groups randomly, and numbered after intravenously injected with different samples with or without US. All mice were kept for 14 days under observation of subcutaneous tumor volumes and body weights, and the images of the mice before dissection was shown in Fig. S11 (Supporting information). The representative photograph of excised tumors of all the mice after different treatments was shown in Fig. 4a, all the groups showed better suppression on the growth of tumors when compared to that of PBS group. As shown in Fig. 4b, the tumor weights treated with PBS, SAS, PCN-600, P@S, mSSTP@S, HMR@S, BSSTP, BTP@S, BSSP@S, BSSTP@S (1:2), BSSTP@S (1:1) and BSSTP@S (1:0.5) were 1.23, 0.87, 0.64, 0.62, 0.57, 0.51, 0.50, 0.45, 0.25, 0.06, 0.16 and 0.29 g, respectively. The tumor volumes treated by PBS, SAS, PCN-600, P@S, mSSTP@S, HMR@S, BSSTP, BTP@S, BSSP@S, and BSSTP@S (1:2) were decreased gradually (Fig. 4c). Firstly, compared to PCN-600, BSSTP demonstrated better therapeutic efficacy, attributed to its short/long-chain modifications that enhanced tumor-mitochondrial accumulation of PCN-600. Moreover, while individual treatments with either PCN-600 or SAS demonstrated modest therapeutic activity, their combined administration of P@S exhibited significantly enhanced efficacy, suggesting a potent synergistic interaction. What is more, compared to the mSSTP@S, BTP@S and BSSP@S groups, BSSTP@S (1:2) showed the best inhibition effect on tumor growth, which was due to the cleaved S-S of BSSTP@S (1:2) in intracellular high GSH concentration allowed BSSTP@S (1:2) to achieve mitochondria-specific targeting in tumor tissues and thus the first-leveled synergistic anti-tumor efficacy of encapsulated PCN-600 and SAS induced ferroptosis to promote cell apoptosis. As shown in Fig. S12 (Supporting information), the changes in subcutaneous tumor volumes of the mice after treatments were consistent with the results of resected tumor weights and volumes (Fig. S12a). These results demonstrated that BSSTP@S (1:2) had the highest SDT efficacy under US irradiation, because the introduction of tumoral and mitochondrial targeting moieties led to the efficient mitochondria-located anti-tumor treatment for directly generating ROS and releasing SAS to induce ferroptosis and improved apoptosis, thereby achieving the first-leveled synergism of anti-tumor efficacy. The body weight is a vital index to evaluate the side effect of the treatments. As shown in Fig. S12b, the body weights of all treated mice did not fluctuate much, which meant that the treatments did not cause obvious side effects to the mice.
In addition, H&E staining was applied to investigate the anti-tumor efficacy of BSSTP@S (1:2). Histological sections of subcutaneous 4T1 tumors and the related tissues were taken out from the mice after treated with PBS, SAS, PCN-600, P@S, mSSTP@S, HMR@S, BSSTP, BTP@S, BSSP@S, BSSTP@S (1:2), BSSTP@S (1:1) and BSSTP@S (1:0.5). As shown in Fig. S12c, for PBS and SAS groups, 4T1 cells in the tumors accumulated orderly without obvious damage. After the other treatments, tumor cells showed different degrees of necrotic areas. Among them, BSSTP@S (1:2) group showed the most serious necrotic area of tumor cells, and the largest degree of damage to tumor cells, which proved that the first-leveled synergism of PCN-600 and encapsulated SAS, and the mitochondria-located therapy of BSSTP@S (1:2) can achieve the best anti-tumor efficacy.
The expression of apoptosis and ferroptosis-related proteins in tumors of mice treated with PBS, SAS, PCN-600, P@S, mSSTP@S, HMR@S, BSSTP, BTP@S, BSSP@S, BSSTP@S (1:2), BSSTP@S (1:1), and BSSTP@S (1:0.5) was detected by WB. As shown in Fig. S12d, BSSTP@S (1:2) exhibited the lowest expressions of xCT and GPX4. The minimal ratios of GPX4/β-actin and xCT/β-actin in tumors of BSSTP@S (1:2)-treated mice were examined (Figs. S12e and f). It was illustrated that the loaded SAS of BSSTP@S (1:2) inhibited system Xc- expression on the cell membrane and reduced intracellular cystine uptake, leading to intracellular GSH depletion and ultimately GPX4 inactivation. As shown in Fig. S12g, the expression of caspase-3 was highest in BSSTP@S (1:2) group, indicating that the synergistic therapeutic modalities and effective mitochondria-targeting were more conducive to elevate caspase-3 expression. The ratio of caspase-3/β-actin also indicated BSSTP@S (1:2) group showed the highest caspase-3/β-actin ratio (Fig. S12h). These results demonstrated that the mechanism of death in tumor cells treated by BSSTP@S (1:2) was primarily related to mitochondria-dependent apoptosis and ferroptosis pathways.
As reported that the efficiency of tumorous ferroptosis was seriously restricted by intracellular ferroptosis defense systems of the GPX4 and CoQH2 systems. Encouraged by under GPX4low environment, DHODH inhibitor can further induce ferroptosis in cancer cells, resulting in greater ferroptosis damage to cancer cells. Inspired by the in vitro and in vivo anti-tumor efficacy of BSSTP@S (1:2), we further loaded DHODH inhibitor BQR together with the ferroptosis initiator SAS to evaluated the in vivo anti-tumor activity of BSSTP@S/B in breast orthotopic tumor models with intravenous injection of 4T1 cells. The anti-tumor efficacy of BSSTP@B, BSSTP@S and BSSTP@S/B was evaluated by 4T1 cell-bearing BALB/c mice at the same concentration of 5 mg/kg PCN-600. When the tumors grown to a volume of about 100 mm3, 16 mice were randomly divided into four groups and numbered after different samples were injected intravenously. All mice were fed for 14 days with subcutaneous tumor volume and body weight observation. As shown in Figs. S13 and S14 (Supporting information), Fig. S13 shows the photos of mice before dissection, and Fig. S14a shows representative photographs of all mice treated with different samples for tumor resection, with all groups displaying better inhibition of tumor growth compared to the PBS group. As shown in Figs. 4d and e, the tumor weight and volume of the mice treated with BSSTP@S/B declined evidently when compared to the other groups. The tumor volumes of mice treated with PBS, BSSTP@B, BSSTP@S and BSSTP@S/B were 1142.48, 436.2, 102.9 and 29.9 mm3, respectively (Fig. 4e). Moreover, the rate of tumor growth inhibition based on tumor volume of PBS group were 61.8%, 91.0% and 97.4% for BSSTP@B, BSSTP@S and BSSTP@S/B, respectively. Among them, BSSTP@S/B has the best inhibition effect on tumor growth. Because ferroptosis was induced by SAS of BSSTP@S/B that inactivated GPX4 expression in cancer cells, and simultaneously initiated ferroptosis defense via the DHODH—CoQH2 system. In the context of GPX4low, the loaded DHODH inhibitor BQR evokes the robust ferroptosis and further induced ferroptosis in cancer cells. The synergistic effect of the two drugs of BSSTP@S/B in mitochondria led the cancer cells more severely damaged by ferroptosis and apoptosis, further enhancing the anti-tumor effect of SDT. As shown in Fig. S14b, the changes in the subcutaneous tumor volumes of the mice after treatments were consistent with the results of the weights and volumes of the removed tumors. These results indicated that BSSTP@S/B has the best SDT efficacy under US irradiation, because SAS and BQR released in mitochondria can enhance the ferroptosis of cancer cells. Moreover, the weights of all the treated mice did not fluctuate much, meaning that the treatments did not cause significant side effects in the mice (Fig. S14c).
Histological sections of subcutaneous 4T1 tumors treated with PBS, BSSTP@B, BSSTP@S, and BSSTP@S/B were shown in Fig. S14d. No tissue damage was displayed in PBS group, while pathological features of damage in cancer cells were found for all the other treatments, especially severe tumor necrosis in BSSTP@S/B group. Moreover, we performed immunohistochemical (IHC) analysis of Ki-67 and FTH1 proteins in tumor tissues after different treatments. Compared to the other control groups, the positive rate of Ki67 and FTH1 in BSSTP@S/B group was the lowest, indicating that the least proliferating tumor cells and the most serious ferroptosis after treatments with BSSTP@S/B (Fig. 4f). The H&E staining and IHC analysis results proved that the synergistic therapies of SAS and BQR released in mitochondria of cancer cells could achieve the best anti-tumor efficacy. Finally, the expression of apoptosis and ferroptosis-related proteins in tumors of mice treated with PBS, BSSTP@B, BSSTP@S, and BSSTP@S/B was detected by WB. As shown in Fig. S15 (Supporting information), the down-regulated DHODH, xCT and GPX4 expression were detected (Fig. S15a) and the minimal ratios of DHODH/β-actin, GPX4/β-actin and xCT/β-actin were examined (Figs. S15b–d) after intravenous injection of BSSTP@S/B, meaning ferroptosis' defense mechanism was compromised and vigorous ferroptosis induction. Besides, the expression of caspase-3 was the highest in BSSTP@S/B group (Figs. S15a and e), indicating that the co-loading of SAS and BQR greatly promoted cellular apoptosis. These results demonstrated the mechanism of death in tumor cells treated by BSSTP@S/B was related to mitochondria-dependent apoptosis and ferroptosis pathways. Moreover, we further examined in vivo apoptosis of the excised tumor tissues by colorimetric terminal deoxynucleotidyl transferase mediated dUTP Nick-End labeling (TUNEL). The apoptotic cells could activate endonuclease enzymes that cut genomic DNA between nucleosomes, and the exposed 3′-OH of the cut genomic DNA is applied to reveal apoptotic cells by 3,3′-diaminobenzidine for color development. Thus, the apoptotic cells can be detected as yellowish-brown by ordinary light microscopy. As shown in Fig. S15f, it is clearly that the BSSTP@S/B group had the maximum yellowish-brown-positive cells, which indicated the most severely apoptosis in the tumor tissue compared to the other treatments. The most serious apoptosis of the BSSTP@S/B group further demonstrated the successful mitochondria-located release of SAS and BQR in 4T1 cells caused amounts of ROS under US activation and overcame ferroptosis defence to enhance apoptosis for SDT.
In summary, a novel GSH-activated mitochondria-targeting nanosystem was developed, by applying the hollow structure of PCN-600 for loading the ferroptosis inducer SAS and DHODH inhibitor BQR, and followed by surface modification with a short mitochondria-targeting chain contained TPP groups and a long tumor-targeting chain, among which, the long chain consisted of S-S bonds that connected with biotin groups lead to tumor-targeting firstly and can be cleaved by GSH to re-expose TPP for the following mitochondria-targeting. BSSTP@S/B produced amounts of ROS in mitochondria of cancer cells under US irradiation and displayed the highest cytotoxicity to 4T1 cells. In vitro and in vivo experiments demonstrated that the death mechanism of 4T1 cells treated with BSSTP@S/B was related to the mitochondria-dependent apoptosis and ferroptosis pathways, which exhibited the dual synergism of SAS and BQR released in mitochondria to enhance the anti-tumor efficacy of SDT. The GSH-activated mitochondrial targeting nanosystem for interfering anti-ferroptosis system provided a new strategy for enhancing the anti-tumor efficacy of SDT.
The authors declare that they have no known competing financial interests or personal relationships that could have appeared to influence the work reported in this paper.
Yirou Wang: Writing – original draft, Resources, Methodology, Investigation, Formal analysis, Data curation, Conceptualization. Futing Yang: Writing – original draft, Resources, Methodology, Investigation, Formal analysis, Data curation, Conceptualization. Jun Wang: Methodology, Investigation, Data curation, Conceptualization. Xinghua Liao: Methodology, Formal analysis, Data curation, Conceptualization. Chun Song: Investigation, Formal analysis, Data curation, Conceptualization. Michał Nowicki: Writing – review & editing, Funding acquisition. Roman Szewczyk: Writing – review & editing, Funding acquisition. Na Peng: Writing – review & editing, Supervision, Project administration, Methodology, Funding acquisition, Data curation, Conceptualization.
This work was financially supported by the National Natural Science Foundation of China (No. 51703174), Startup Foundation of Chutian Scholars by Wuhan University of Science and Technology (Nos. 040288, 040291) and the Opening Project of Belt and Road Joint Laboratory (No. MCT202402).
Supplementary material associated with this article can be found, in the online version, at doi:
H. Sung, J. Ferlay, R.L. Siegel, et al., CA Cancer J. Clin. 71 (2021) 209–249. doi: 10.3322/caac.21660
L. Wang, C. Lynch, S. Pitroda, et al., J. Exp. Med. 221 (2024) e20232101. doi: 10.1084/jem.20232101
M. Singh, V.K. Morris, I.N. Bandey, et al., Trends Cancer 10 (2024) 598–609. doi: 10.1016/j.trecan.2024.05.001
M. Ling, R. Sun, W. Ma, et al., Nano Res. 15 (2022) 6288–6296. doi: 10.1007/s12274-022-4239-0
K. Song, G. Chen, Z. He, et al., Acta Biomater. 158 (2023) 637–648. doi: 10.1016/j.actbio.2022.12.065
Z. Xiao, Q. Chen, Y. Yang, et al., Chem. Eng. J. 449 (2022) 137889. doi: 10.1016/j.cej.2022.137889
H. Xu, N. Yu, J. Zhang, et al., Biomaterials 257 (2020) 120239. doi: 10.1016/j.biomaterials.2020.120239
M. Yuan, S. Liang, Y. Zhou, et al., Nano Lett. 21 (2021) 6042–6050. doi: 10.1021/acs.nanolett.1c01220
X. Deng, Z. Shao, Y. Zhao, Adv. Sci. 8 (2021) 2002504. doi: 10.1002/advs.202002504
Z. Zhu, Y. Liu, C. Song, et al., ACS Nano 16 (2021) 1346–1357. doi: 10.1007/s11427-020-1842-7
Y. Cao, S. Zhang, Z. Lv, et al., Adv. Funct. Mater. 32 (2022) 2209227. doi: 10.1002/adfm.202209227
L. Zhou, C. Dong, L. Ding, et al., Nano Today 39 (2021) 101212. doi: 10.1016/j.nantod.2021.101212
M. Zhan, F. Wang, Y. Liu, et al., Adv. Sci. 10 (2023) e2207200. doi: 10.1002/advs.202207200
Q. Wang, F. Shaik, X. Lu, et al., Acta Biomater. 155 (2023) 575–587. doi: 10.1016/j.actbio.2022.10.048
Y. Li, Y. Duan, Y. Li, et al., Exploration 5 (2024) 20230117.
B. Hassannia, P. Vandenabeele, T.V. Berghe, Cancer Cell 35 (2019) 830–849. doi: 10.1016/j.ccell.2019.04.002
F. Cao, Y. Sang, C. Liu, et al., ACS Nano 16 (2022) 855–868. doi: 10.1021/acsnano.1c08464
H. Yu, J. Yan, Z. Li, et al., Nanoscale Adv. 5 (2023) 1271–1290. doi: 10.1039/d2na00719c
X. Bai, J. Kang, S. Wei, et al., Exploration 5 (2024) 20240002.
N. Montesdeoca, L. Johannknecht, E. Efanova, et al., Angew. Chem. Int. Ed. 63 (2024) e202412585. doi: 10.1002/anie.202412585
Q. Jiang, K. Wang, X. Zhang, et al., Small 16 (2020) 2001704. doi: 10.1002/smll.202001704
E. Mishima, T. Nakamura, J. Zheng, et al., Nature 619 (2023) 9–18. doi: 10.1038/d41586-023-02208-1
C. Mao, X. Liu, Y. Zhang, et al., Nature 593 (2021) 586–590. doi: 10.1038/s41586-021-03539-7
P. Xue, H. Zhuang, S. Shao, et al., ACS Nano 18 (2024) 25795–25812. doi: 10.1021/acsnano.4c08574
C. Yin, Y. Li, Z. Liao, et al., Acta Biomater. 155 (2023) 491–506. doi: 10.1016/j.actbio.2022.11.037
X. Han, Z. Song, Y. Zhou, et al., Biomater. Adv. 124 (2021) 112054.
F. Qu, P. Wang, K. Zhang, et al., Autophagy 16 (2020) 1413–1435. doi: 10.1080/15548627.2019.1687210
B. Kalyanaraman, G. Cheng, M. Hardy, et al., Interface Focus 7 (2017) 20160109. doi: 10.1098/rsfs.2016.0109
L. Zhang, Y. Jia, H. Hao, et al., Micropor. Mesopor. Mater. 344 (2022) 112198. doi: 10.1016/j.micromeso.2022.112198
S. Zhang, Q. Fu, Y. Zhang, et al., Acta Pharmacol. Sin. 42 (2021) 1040–1054. doi: 10.1038/s41401-020-00606-z
Y. Feng, G. Qin, S. Chang, et al., Int. J. Nanomed. 16 (2021) 3073–3089. doi: 10.2147/ijn.s297716
M. He, Z. Zhang, Z. Jiao, et al., Chin. Chem. Lett. 34 (2023) 107574. doi: 10.1016/j.cclet.2022.05.088
F. Yang, W. Yu, Q. Yu, et al., Small 19 (2023) e2206124. doi: 10.1002/smll.202206124
J. Wang, Y. Fan, Y. Tan, et al., ACS Appl. Mater. Interfaces 10 (2018) 36615–36621. doi: 10.1021/acsami.8b15452
Z.S. Moghaddam, M. Kaykhaii, M. Khajeh, et al., Anal. Methods 12 (2020) 651–656. doi: 10.1039/C9AY01769K

Scheme 1 (a) Schematic diagram of the preparation and (b) dual synergism of ferroptosis with apoptosis of BSSTP@S/B for anti-tumor of SDT.

Figure 1 (a) TEM image, (b) statistical particle size, (c) hydrodynamic diameter, (d) UV–vis, (e) fluorescence spectrum (λex = 420 nm), and (f) PXRD spectrum of PCN-600. (g) TEM and mapping images, (h) statistical particle size and (i) hydrodynamic diameter of BSSTP@S/B. (j) Zeta potential variations of BSSTP incubated in PBS7.4 contained 10 µmol/L and 10 mmol/L GSH. (k) In vitro ROS generation of BQR, BSSTP@B, BSSTP@S and BSSTP@S/B under US treatments (1.15 W/cm2, 4 min). (l) The release curves of SAS from BSSTP@S at different pH and (m) at different pH contained 10 mmol/L GSH. Data are presented as mean ± SD (n = 3). mM = mmol/L; µM = µmol/L.

Figure 2 (a) Cytotoxicity of 4T1 cells incubated with SAS, PCN-600, P@S, mSSTP@S, HMR@S, BSSTP, BTP@S, BSSP@S, BSSTP@S (1:2), BSSTP@S (1:1) BSSTP@S (1:0.5), and (b) BSSTP@B, BSSTP@S, BSSTP@S/B with US treatments. (c) WB detection of protein expression of caspase-3 and (d) activity ratios in 4T1 cells after treated with BSSTP, BTP@S, BSSP@S and BSSTP@S (1:2) under US irradiation. (e) 4T1 cells stained with fluorescein-Annexin V-FITC/PI after different treatments under US irradiation. (f) WB detection of protein expression of caspase-1 and caspase-3 and (g, h) activity ratios in 4T1 cells after treated with PBS, BSSTP@S, BSSTP@B and BSSTP@S/B under US irradiation. Data are presented as mean ± SD (n = 3).

Figure 3 (a, f) GSH levels, (b, g) intracellular MDA and (c, h) WB detection of protein expression of xCT, GPX4 and DHODH in 4T1 cells after incubation with different samples under US irradiation (0.87 W/cm2, 30 s). (d) xCT and (e) GPX4 activity ratios of Fig. 3c. (i) DHODH, (j) xCT and (k) GPX4 activity ratios of Fig. 3h. Data are presented as mean ± SD (n = 3). P < 0.05, **P < 0.01, ***P < 0.001.

Figure 4 (a) Representative photographs of excised 4T1 tumors. (b) Tumor weights and (c) volumes from the 4T1-bearing mice treated with PBS, SAS, PCN-600, P@S, mSSTP@S, HMR@S, BSSTP, BTP@S, BSSP@S, BSSTP@S (1:2), BSSTP@S (1:1) and BSSTP@S (1:0.5) under US irradiation (1.15 W/cm2, 1 min). (d) The tumor weights, (e) tumor volumes, and (f) IHC analyses of Ki-67 and FTH1 for tumor tissues treated with PBS, BSSTP@B, BSSTP@S and BSSTP@S/B under US irradiation (1.15 W/cm2, 1 min). 200× magnification. Data are presented as mean ± SD (n = 4). P < 0.05, **P < 0.01, ***P < 0.001.
Table 1. Particle size, PDI, zeta potential and DLC of the nanoparticles.
| Sample | Size (nm) | PDI | Zeta (mV) | DLC (%) (SAS) | DLC (%) (BQR) |
| mSSTP@S | 115 ± 4 | 0.165 | −15 | 18.17 | 14.30 |
| BTP@S | 147 ± 2 | 0.144 | −18 | 18.52 | 15.31 |
| BSSP@S | 171 ± 3 | 0.139 | −17 | 17.66 | 14.53 |
| BSSTP@S | 176 ± 2 | 0.163 | −15 | 32.33 | – |
| BSSTP@B | 122 ± 4 | 0.182 | −33 | – | 30.45 |
| BSSTP@S/B | 184 ± 4 | 0.220 | −34 | 18.20 | 14.13 |
 下载: 导出CSV

 扫一扫看文章


扫一扫关注我们
 下载:
下载: