Key Laboratory of Smart Manufacturing in Energy Chemical Process Ministry of Education, East China University of Science and Technology, Shanghai 200237, China
b.
Optogenetics & Synthetic Biology Interdisciplinary Research Center, Shanghai Frontiers Science Center of Optogenetic Techniques for Cell Metabolism, State Key Laboratory of Bioreactor Engineering, East China University of Science and Technology, Shanghai 200237, China
Received Date:
22 April 2025 Accepted Date:
25 August 2025 Revised Date:
22 August 2025 Available Online:
15 August 2026
Abstract:
Genetically encoded fluorescence (FL) sensors play vital roles in monitoring cell metabolism dynamics, gene transcription, DNA repair, apoptosis, and nutrient sensing. In genetically encoded FL sensors study, microscope acquires multimodal images that contain bright-field (BF) and FL images. BF and FL images can provide different information on cell phenotypes and gray level. Here, we developed an artificial intelligence (AI)-driven system “AI-cell metabolism dynamic analyzer (AI-CMDA)” for high-throughput automatically cell division metabolism dynamics processing by fusing multimodal information. The system consists of a deep learning model based on multimodal images dedicated to division nodes extraction and an adaptive correlation filter tracker for associating cell sequences. The division extraction method enables fast filtering of dividing cells without manual selection, and the adaptive correlation filter can achieve robust, accurate tracking during cell transforms with time. We apply the system with 3 genetically encoded FL sensors for nicotinamide adenine dinucleotides (NAD+/NADH) ratio, reduced nicotinamide adenine dinucleotide phosphate (NADPH) and H2O2, respectively, to monitor the redox metabolism within cell division sequences. The results show that this system can reduce the processing time to seconds compared with several hours’ manual labeling and can achieve accuracy and fastness.
Single-cell metabolism dynamic attracts more and more interests in the field of cell biology, as it provides new insights into the dynamic process of metabolism and regulation of signaling networks in living cells [1,2]. Genetically encoded fluorescence (FL) sensors have considerable advantages including lower toxicity, less invasive [3], and adapting to metabolism dynamic analysis [4,5]. Recent studies have demonstrated the capacity of the biosensor in a wide range of cellular processes, such as metabolic control, gene transcription, DNA repair, apoptosis, and nutrient sensing. There are many probes for pyridine dinucleotides (NAD(P)(H)) [6,7] study, such as LigA-cpVenus [8], FiNad [9] for NAD+; Frex [10] for the NADH; Peredox [11], RexYFP [12], SoNar [13,14] for nicotinamide adenine dinucleotides (NAD+/NADH) ratio; Apollo-NADP+ [15], NADPsor [16] for NADP+; iNap1 [17,18] for NADPH; NAPstar family [19] for NADPH/NADP+. For H2O2, there are HyPer family [20], HyPer7 [21], HyPerion [22]. And there are probes for monitor pH [23]. ZnT72R is a novel fluorescence resonance energy transfer (FRET)-based zinc sensor [24]. The development of genetically encoded voltage indicators (GEVIs) has greatly facilitated the optical recording of membrane potential dynamics in living cells [25]. Recent advances in site-specific protein labeling have enabled the precise attachment of genetically encoded FL sensors to target proteins in living cells, providing minimally invasive and highly specific tools for real-time monitoring of protein localization, conformation, and dynamics in biological systems [26].
Live-cell imaging serves as a pivotal technique for investigating cellular metabolism, as it enables high-resolution spatial and temporal mapping of metabolites changes at the single-cell level [27,28]. Optical biomarkers obtained from cell imaging can serve as a valuable tool for mapping metabolic changes [29]. Tracing hydrides into lipid droplets (THILD) is a imaging strategy for NADPH generation in live cells [30]. Multi-isotope imaging mass spectrometry (MIMS) helps image stable isotope labels with submicrometre resolution for cell division and metabolism [31]. Recent advances in optical microscopy and electromechanical control technologies have made it feasible to implement multimodal cell image acquisition protocols within a single microscopic platform, enabling the simultaneous capture of both bright-field (BF) and FL images for comprehensive metabolic phenotype characterization [18,32].
A wide range of AI-based methods have been increasingly applied in cellular analysis, offering novel solutions for image segmentation, phenotype classification, and quantitative feature extraction. FMDet [33] is a deep-learning based software, which transforms the mitosis detection task into a semantic segmentation task by using an attention mechanism to extract multi-scale features. CellX [34] is developed for cell segmentation which also enables frame-by-frame tracking of cells based on region fingerprints [35]. CellProfiler [36] is a comprehensive cell analysis platform, which enables classify complex or subtle phenotypes using deep-learning. Although the existing artificial intelligence (AI)-driven systems have highly enhanced the performance and generalization ability for cellular analysis, most studies are focused on processing with single modal images. For example, extracting features of cell morphology in BF images; semantic segmentation of cells based on FL images. Few studies have focused on processing multimodal images, which contains both the morphological phenotypes and metabolic features.
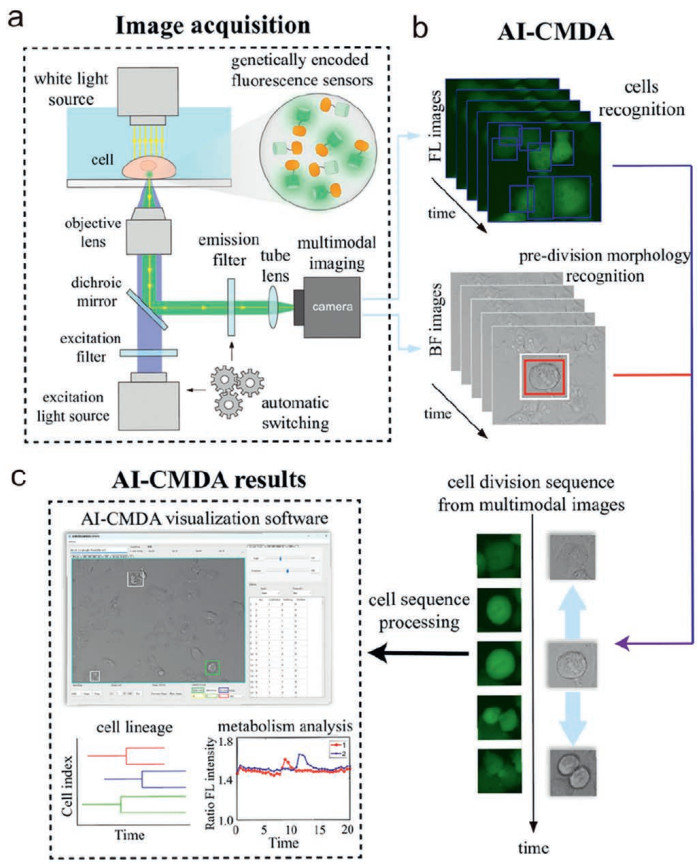
In this study, we developed an AI-driven system for analyzing cell division metabolic dynamics by integrating multimodal imaging data. Firstly, multimodal cell images are acquired using the FL and BF imaging system (Fig. 1a). Then the AI-cell metabolism dynamic analyzer (AI-CMDA) is applied for cell division metabolism analysis. A deep-learning method is used for recognition, and key division events are extracted by joint judgment of both BF and FL images information. To generate long-time cell division sequences, a small-scale adaptive tracking model is combined to the deep-learning method. Therefore, the system can enable high-throughput screening and capture of cell division sequences (Fig. 1b). Subsequently, AI-CMDA can analyze the metabolic dynamics of dividing cells, enabling the extraction of both cell lineage and metabolic dynamics information. A custom-designed visualization software is developed for observation and screening of metabolic analysis progress or results from AI-CMDA (Fig. 1c). The data generated during the AI-CMDA processing can also be visualized and examined using external software such as MATLAB, Labelme. We validated the system’s performance and efficiency using five distinct probes, demonstrating its ability to rapidly assess intracellular metabolic changes throughout cell division.
Figure 1
Figure 1.
Overview of multimodal images acquisition, processing with AI-CMDA and results visualization. From left to right, in sequence: (a) A brief introduction for genetically encoded FL sensors and BF images acquisition; (b) AI-CMDA for multimodal images based metabolism dynamic processing; (c) The results obtained from AI-CMDA and a visualization software.
To build the dataset and examine the performance of AI-CMDA. H1299 cells were selected as modal cell. Cells were cultured in RPMI 1640 medium supplemented with 10% fetal bovine serum. All cells were incubated at 37 ℃ in a humidified atmosphere containing 95% air and 5% CO2. To generate the stable cell lines, pLVX lentiviral plasmids encoding SoNar, iNap1, iNapc, HyPerion, HyPerion-C sensors, and the red fluorescent protein mCherry were constructed. Lentiviral supernatants were collected 48 and 72 h after transfection. H1299 cells in 6-well tissue culture plates were infected in media containing 8 µg/mL polybrene. After infection, the virus was removed, and cells were selected with 0.2–1 µg/mL puromycin for one week.
H1299 cells stably expressing sensors or red fluorescent protein were seeded in 96-well glass-bottom plates at densities of 20%, 40%, and 80%, respectively. Cells were incubated at 37 ℃ in a humidified CO2 incubator for 12–24 h. Images were acquired using a Lionheart FX automated microscope system equipped with an Olympus Plan Fluorite 20 × 0.45 NA objective. For cells expressing genetically encoded fluorescent probes, images were captured using 405 and 465 nm light-emitting diode (LED) sources with 400 BP 40 nm or 469 BP 35 nm bandpass (BP) excitation filters and 550 BP 49 nm or 525 BP 39 nm emission filters at 30-min intervals over 27 h. For cells expressing mCherry, images were captured using 590 nm LED light source with 586 BP 15 nm excitation filter and 647 BP 57 nm emission filter every 10 min for 12 h. Each FL image was captured alongside the corresponding BF image. The capture duration for each region was 27 h, with an interval of 0.5 h, resulting in a total of 55 time points. For each time point, three types of images were captured: BF, F469 nm (GFP), and F400 nm (CFP-YFP FRET V2) (two FL images). There are 5 (probe types) × 3 (field-of-view regions) × 2 (cell densities) × 55 (time points) images totally. The captured image dimensions are 1224 × 904 pixels, with an actual field of vision of 394 μm × 291 μm.
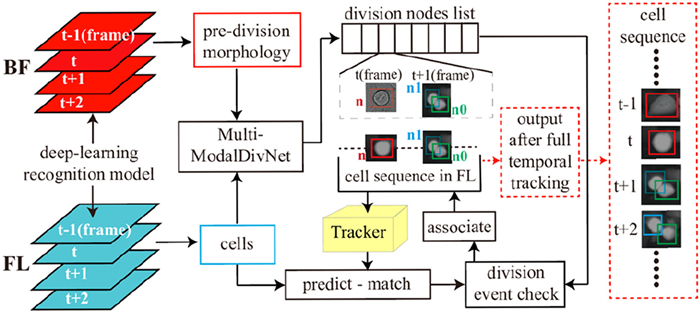
AI-CMDA generates complete temporal sequences of dividing cells based on multimodal imaging (Fig. 2). Multimodal images contain BF and FL images. Due to the different information presented by cells in BF and FL images, integrating multimodal imaging data can better aid in assessing cellular states, such as cell division events. Multimodal cell images are fed into a deep-learning model, where BF images are used to identify pre-division morphological features, and FL images are utilized for global cell recognition. The model training and evaluation were performed on a workstation with an Intel i5–14600K CPU, a single NVIDIA RTX 3070 GPU (8 GB VRAM), and 32 GB RAM, running Windows11. The YOLOv11s architecture was utilized as the backbone detection network for training the cell segmentation/classification model in this study. Division nodes are extracted with MultiModalDivNet, a geometry-driven framework that fuses both BF and FL imaging data. By jointly analyzing mother-daughter (M-D) and daughter-daughter (D-D) regions of interest (ROIs) relationships across these modalities, MultiModalDivNet enables precise division node identification through multi-image information integration. Following division node extraction, each node serves as a starting point for adaptive filter-based cell tracking, which is performed bidirectionally (forward and backward) across the FL image sequence. A CSRT (Discriminative Correlation Filter with Channel and Spatial Reliability) model is employed as the tracker due to its strong robustness against object deformation and scale variation, making it suitable for cell sequence tracking in microscopy images. Throughout the tracking process, each cell is continuously monitored for additional division events. When further division is identified, the corresponding division node is incorporated into the cell’s trajectory, ensuring accurate lineage reconstruction. This automated workflow enables robust and accurate reconstruction of complete cell division lineages from multimodal imaging data.
Figure 2
Figure 2.
Workflow of generating cell sequence from multimodal images by AI-CMDA.
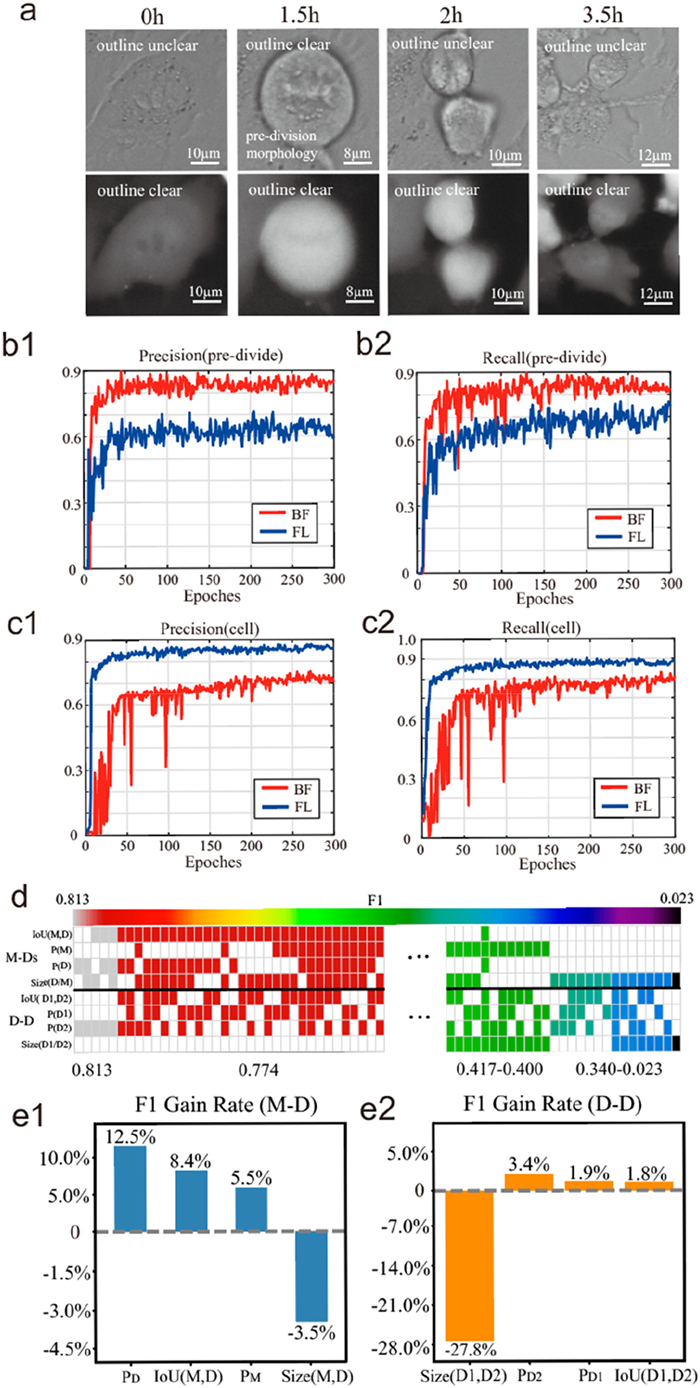
In BF images, cells in the pre-division stage exhibit clear outline as pre-division morphology and a roughly circular shape. However, in other stages, the cell outline is unclear (Fig. 3a). The clear-division morphology, characterized by a well-defined cell outline and an approximately round morphology, is used as a defining feature of prior to division. Cells presenting pre-division morphology were manually annotated in the BF images, serving as target objects for training the deep-learning model. Given the multimodal nature of the imaging data, cells exhibiting this morphology were annotated in the BF images, and the same annotations were used to train deep-learning models separately on both the BF and FL images. Comparing the training results between BF and FL images, it shows that the detection of cells with pre-division morphology achieved significantly higher precision and recall in BF images than in FL images (Figs. 3b1 and b2). These findings indicate that annotating cells with pre-division morphology in the BF images provides a more reliable basis for accurately identifying cells about to division. Mother cell candidates are filtered from the detection results in the BF images.
Figure 3
Figure 3.
Fusion of multimodal images for cell division node selection. (a) The different states of cells presented in BF and FL images. In BF images, the cell morphology is unclear before division but becomes clear and nearly round as it approaches division. After division, the morphology becomes irregular and unclear. In contrast, cells in the FL images can be continuously observed. (b) Cells labeled with pre-division morphology. b1 shows the precision by the training, with red for BF and blue for FL, while b2 shows the recall. (c) Cells labeled in the FL channel, with c1 showing the precision for FL (blue) and BF (red) training, and c2 showing the recall for FL (blue) and BF (red) training. (d) Ablation heatmap of parameter combinations for division node extraction. (e) Sensitivity analysis of parameter selection during F1 score acquisition for division nodes using MultiModalDivNet.
From the mother cell candidates, the associated daughter cells need to be identified in order to find the division nodes. Daughter cells in BF images often exhibit unclear outlines and irregular morphologies. However, probe-labeled cells can be observed across different states in FL images (Fig. 3a). Therefore, cells in the FL images were annotated using LabelImg, and the labeled data was subsequently used to train deep-learning models for both the FL and BF images. The precision and recall plots reveal that cell recognition performance is superior in FL images (Figs. 3c1 and c2), for in FL the precision and recall both show better results than BF. As a result, FL images were used for large-scale cell recognition and for screening the corresponding daughter cells of the mother cells in candidates.
Following the deep learning-based cell detection and label prediction, division node extraction was performed using MultiModalDivNet. MultiModalDivNet is a multi-modality framework for division node extraction, leveraging the integration of BF and FL imaging. This is a geometry-guided framework for division node extraction that analyzes the spatial relationships between mother and daughter cell ROIs (M-D relationships) across both BF and FL image modalities. The analysis of M-Ds relationships is divided into two components: the M-D relationship and the D-D relationship. In the context of the M-D relationship, the evaluation metrics include IoU(M,D), PM, PD and Size(D/M) based on the ROIs of the cells. IoU(M,D) represents the intersection over union (IoU) between the mother cell and one daughter cell ROIs; PM, and PD denote the proportion of the intersection area within the mother cell ROI (M-ROI) and daughter cell ROI (D-ROI) respectively; Size(D/M) refers to the size ratio of the daughter cell ROI to the mother cell ROI. In the context of the D-D relationship, the evaluation metrics include IoU(D1,D2), PD1, PD2 and Size(D1/D2). D1 denotes the ROI of the smaller daughter cell, and D2 denotes the ROI of the larger daughter cel. IoU(D1,D2), PD1, PD2 and Size(D1/D2) are calculated by the same methods as that used for the M-D relationship.
By manually annotating mother cells and daughter cells’ ROIs as ground-truth, we quantified IoU, P, Size each for the M-D relationship and the D-D relationship, yielding a total of 8 parameters. The statistical results are presented in Table 1. Subsequently, the division node extraction process, which relies on the geometric characteristics of the mother and daughter cells’ ROIs, is performed in two stages: (1) Identify candidate daughter cells based on M-D relationship thresholds; (2) Determine daughter cells by applying D-D relationship thresholds to these candidates.
Table 1
Table 1.
ROI relationship parameters ranges for M-D and D-D cell pairs.
To determine the most effective parameters for division node extraction, we conducted comprehensive ablation experiments involving all 8 parameters. The F1 score was employed as the final evaluation metric. First, YOLO models were used to detect cells in both BF and FL images, and the resulting ROIs were utilized as inputs for division node extraction by the MultiModalDivNet framework. The detected division node ROIs were then matched with the ground truth (GT) annotations to calculate precision and recall, from which the final F1 score was computed. In the heatmap (Fig. 3d), enabled parameters are highlighted by color, with each parameter used as a threshold in the division node extraction workflow. Parameter selection was based on combinations achieving the highest F1 scores. Results demonstrate that activating key M-D parameters, such as IoU(M,D) and Size(D/M), consistently led to higher F1 scores, with sensitivity analysis (Fig. 3e1) showing that IoU(M,D) and Size(D/M) produced the most significant improvements. For D-D relationships, the parameter PD2 provided moderate sensitivity (Fig. 3e2), contributing to further refinement in the confirmation phase and enhancing the precision of final division node selection. A total of 25 division nodes were manually annotated; the recall rate for mother cells achieved by the model was 76%, while the recall for daughter cells reached 100%. Under optimal parameter settings, the F1 score for division node extraction reached 0.813. These findings provide empirical guidance for parameter configuration and algorithmic optimization of the extraction process. The absence of division nodes is attributed to the differences between cell ROIs defined by GT annotation and those predicted by the YOLO model. This discrepancy may result in the parameter range derived from GT statistics failing to accurately cover the intercellular parameters of the ROIs predicted by YOLO.
The optimal parameter combination yielded the highest F1 score, highlighting the critical role of rational parameter selection for division node identification. This robust foundation ensures more reliable cell lineage tracking and downstream dynamic analysis.
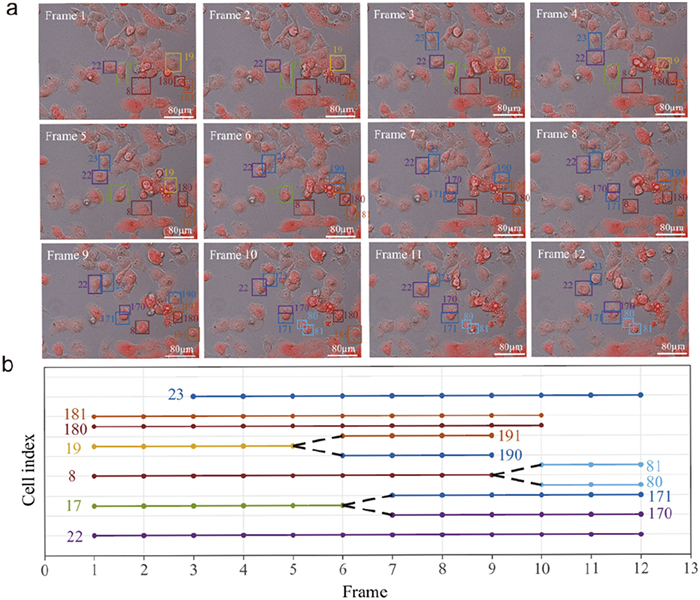
To distinguish different cell sequences and label cell lineages, the “0–1” encoding method is proposed to mark a division sequence. The initial generation of the cell is recorded as “n”, while “0” and “1” are used for cell lineage. At the cell division node, one of the daughter cells is labeled by appending “0” after “n” as “n0”, and “1” is used for the other as “n1”. If the cells continue to divide, this method will be applied recursively (Fig. 4).
Figure 4
Figure 4.
Schematic illustration of cell division lineage labeled with the “0–1″ naming convention. (a) Cell division ROIs marked on fused images. (b) The “0–1” cell lineage naming method.
After division node screening, cell division sequences were generated using an adaptive filtering tracker. The filtering tracker predicts the target ROIpre in the next frame based on the input labels and images, and matches it with cell ROIcell detected by the deep-learning model in the subsequent frame. If the IoU between ROIcell and any ROIpre exceeds 0.5, ROIcell is associated with the target from the previous frame. If no ROIpre meets this criterion, ROIpre is instead associated with the target from the preceding frame. In this manner, cell division sequences are constructed. During association, mother cell detection is performed on the relevant labels; if cell division is observed, the division node is linked to the corresponding cell sequence. Through the above “predict-match” process for tracking and association, cell division sequences can be generated in formats compatible with annotation tools such as Labelme, facilitating observation, screening, and correction.
To demonstrate the practicality of AI-CMDA, we obtained cell division sequences from five genetic encoding probes. Among them, iNapc, iNap1, and SoNar form one group, while HyPerion and HyPerion-C form another group.
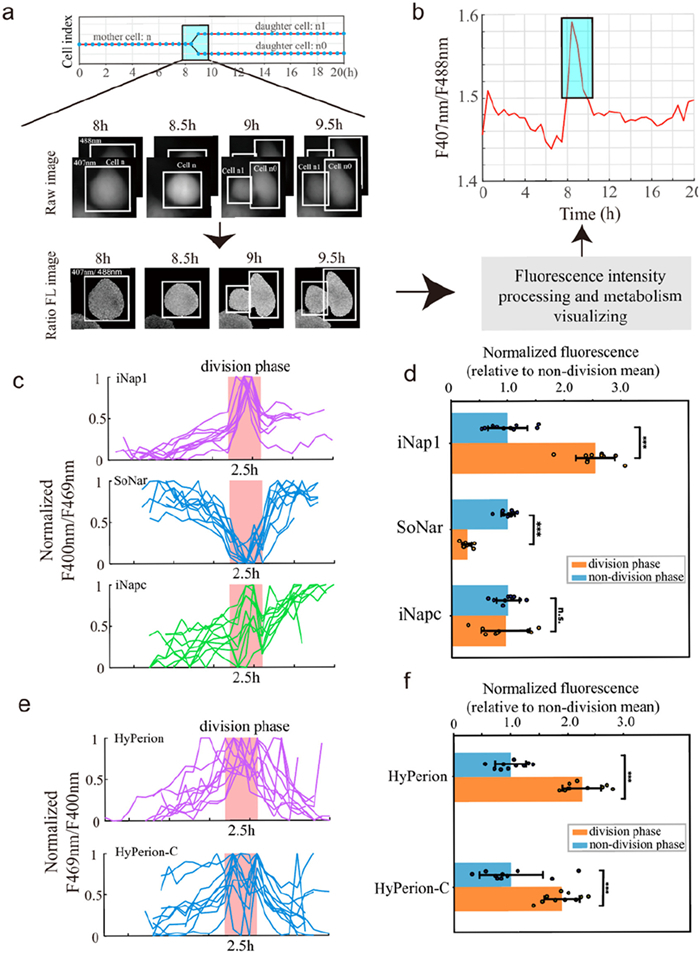
The cell sequences record the ROIs of the cells at each time point. After this, AI-CMDA will compute the ratio FL image of the dual-modal FL images, enabling the automated analysis of metabolic dynamics for dividing cells. The algorithm proceeds in 2 steps: First, the ratio FL image of the dual-modal FL images is calculated based on the cell ROIs from the cell sequence, aiming to eliminate noise effects. Then, the mean ratio FL intensity of the cell regions in the ratio FL image is computed as the metabolic characterization value at that time point (Figs. 5a and b).
Figure 5
Figure 5.
Single-cells division metabolism analysis results of 5 genetically encoded FL sensors. (a) Multimodal images processing generates FL ratio images for metabolites. (b) The average ratio FL intensity values in the cell sequence are calculated and plotted as a curve, where the shaded regions represent the division phase, and the unshaded regions indicate non-division phase. (c) FL intensity change curves during cell division using three probes: iNap1, SoNar, iNapc. (d) Statistical comparison of normalized FL intensities of iNap1, SoNar, and iNapc in dividing and non-dividing phases. Normalized FL (each cell’s ratiometric probe signal divided by the mean value of the non-division phase) is shown for iNap1, SoNar, and iNapc. Data are presented as mean ± SD for each group (n = 10 cells per group). Statistical significance between division and non-division groups was determined using two-sided unpaired Student’s t-test. ***P < 0.001. n.s., not significant. (e) FL intensity change curves during cell division using two probes: HyPerion, HyPerion-C. (f) Statistical comparison of normalized FL intensities of HyPerion, HyPerion-C in dividing and non-dividing phases.
To validate the accuracy of the automagical analysis algorithm, the metabolic calculation was tested on existing iNap1 data. As shown in Fig. 5b, the ratio of iNap1 increased during cell division, which is consistent with previous reports [18].
The normalized ratios of SoNar, iNap1 with iNapc, and HyPerion with HyPerion-C are calculated (Figs. 5c and e) to set the maximum value to 1 and the minimum value to 0 to eliminate baseline differences between probes. Different probes exhibit varying metabolic changes during cell division. Therefore, a method is designed to calculate the metabolic changes during both cell division and non-cell division periods. The cell-division phase is defined as 5 frames, including 2 frames at the division node along with the 2 frames before and 1 frame after it, while other timepoints are the non-division phase.
To investigate whether the five probes respond to changes in metabolite concentrations during cell division, normalized FL was calculated. For each probe, ten cells were analyzed. The ratiometric FL images of each cell were normalized to unify the baseline (Figs. 5c and e). For each cell, F(division) and F(non-division) were determined, where F(division) represents the mean normalized ratiometric FL intensity during the division period, and F(non-division) corresponds to the mean normalized intensity during the non-division period. The mean value of F(non-division) across the 10 cells was calculated and denoted as Fmean. For each probe, F(division)/Fmean and F(non-division)/Fmean were computed for all cells, yielding the normalized FL parameters FN(division) and FN(non-division), respectively. Statistical significance analysis was then performed between FN(division) and FN(non-division). Statistical significance was determined using a two-sided Student’s t-test.
During the division phase, iNap1 exhibited a highly significant increase (P < 0.001), indicating a marked elevation of cellular NADPH levels. In contrast, SoNar showed a highly significant decrease (P < 0.001), suggesting reduction in the NADH/NAD+ ratio. iNapc did not display significant changes between division and non-division phases (P > 0.05) (Fig. 5d). Both HyPerion and HyPerion-C showed a highly significant increase (P < 0.001) (Fig. 5f). Taken the error range into consideration, these two similar readouts are possibly due to environmental disturbances affecting the analyzed cells, while indicating no significant changes in celluar H2O2 levels. For long-term imaging, factors such as medium acidification and change in medium volume can have impacts on cells.
The NADPH pulse during mitotic phase is probably derived from the elevation of in pentose phosphate pathway activities, which provides both building blocks and reducing forces for nucleotide and lipid biosynthesis required for cell doubling [37,38]. The decrease in NADH/NAD+ ratio mainly due to two reasons. Under the same nutritional supply conditions, glucose tend to divert to the pentose phosphate pathway, which matches to raises in NADPH level. On the other hand, additional energy consumption occurs during the dividing process compared to the resting state. In addition, iNapc FL ratio gradually increased during whole culture duration, indicating the acidification of culture medium. They may result from the high glycolytic activity of H1299 tumor cells, leading to the accumulation of lactate.
In summary, the proposed AI-CMDA effectively supports data processing for metabolic dynamic studies of genetically encoded FL sensors. The source code is open to the public (https://github.com/adcwillcarry/AI-CMDA_tracker). By integrating multimodal imaging information, the system can rapidly identify cell division nodes for cell division events. The tracking model can achieve robust cell tracking and automatically associate cells into cell sequences. The software platform also provides valuable insights into the analysis of cellular morphology and metabolic changes. Most importantly, the time required for this study is reduced from hours or even days to just a few seconds.
Since metabolism plays fundamentally important role in almost all kingdoms of life, it is high valuable to integrate the metabolic analysis with that on cellular morphology. Here, we meet the challenge through multi-modal imaging and deep-learning methods. By utilizing the genetically encoded FL sensors as metabolic reporter, we can integrate metabolic dynamics information with the morphogen features, enabling the lineage tracking during cell division and the understanding of metabolic rewiring mechanism. In the future, this method can be applied to analysis various processes, such as the epithetical-mesenchymal transition, tumor cell invasion, phagocytosis of macrophage, and intrastation/extravasation of lymphocytes.
Declaration of competing interest
The authors declare that they have no known competing financial interests or personal relationships that could have appeared to influence the work reported in this paper.
This work was supported in part by the National Key R&D Program of China (No. 2023YFA1802002) and the National Natural Science Foundation of China (No. 62103148).
Figure 1
Overview of multimodal images acquisition, processing with AI-CMDA and results visualization. From left to right, in sequence: (a) A brief introduction for genetically encoded FL sensors and BF images acquisition; (b) AI-CMDA for multimodal images based metabolism dynamic processing; (c) The results obtained from AI-CMDA and a visualization software.
Figure 3
Fusion of multimodal images for cell division node selection. (a) The different states of cells presented in BF and FL images. In BF images, the cell morphology is unclear before division but becomes clear and nearly round as it approaches division. After division, the morphology becomes irregular and unclear. In contrast, cells in the FL images can be continuously observed. (b) Cells labeled with pre-division morphology. b1 shows the precision by the training, with red for BF and blue for FL, while b2 shows the recall. (c) Cells labeled in the FL channel, with c1 showing the precision for FL (blue) and BF (red) training, and c2 showing the recall for FL (blue) and BF (red) training. (d) Ablation heatmap of parameter combinations for division node extraction. (e) Sensitivity analysis of parameter selection during F1 score acquisition for division nodes using MultiModalDivNet.
Figure 5
Single-cells division metabolism analysis results of 5 genetically encoded FL sensors. (a) Multimodal images processing generates FL ratio images for metabolites. (b) The average ratio FL intensity values in the cell sequence are calculated and plotted as a curve, where the shaded regions represent the division phase, and the unshaded regions indicate non-division phase. (c) FL intensity change curves during cell division using three probes: iNap1, SoNar, iNapc. (d) Statistical comparison of normalized FL intensities of iNap1, SoNar, and iNapc in dividing and non-dividing phases. Normalized FL (each cell’s ratiometric probe signal divided by the mean value of the non-division phase) is shown for iNap1, SoNar, and iNapc. Data are presented as mean ± SD for each group (n = 10 cells per group). Statistical significance between division and non-division groups was determined using two-sided unpaired Student’s t-test. ***P < 0.001. n.s., not significant. (e) FL intensity change curves during cell division using two probes: HyPerion, HyPerion-C. (f) Statistical comparison of normalized FL intensities of HyPerion, HyPerion-C in dividing and non-dividing phases.


 DownLoad:


 下载:
下载:


 下载:
下载:

