Scheme 1.
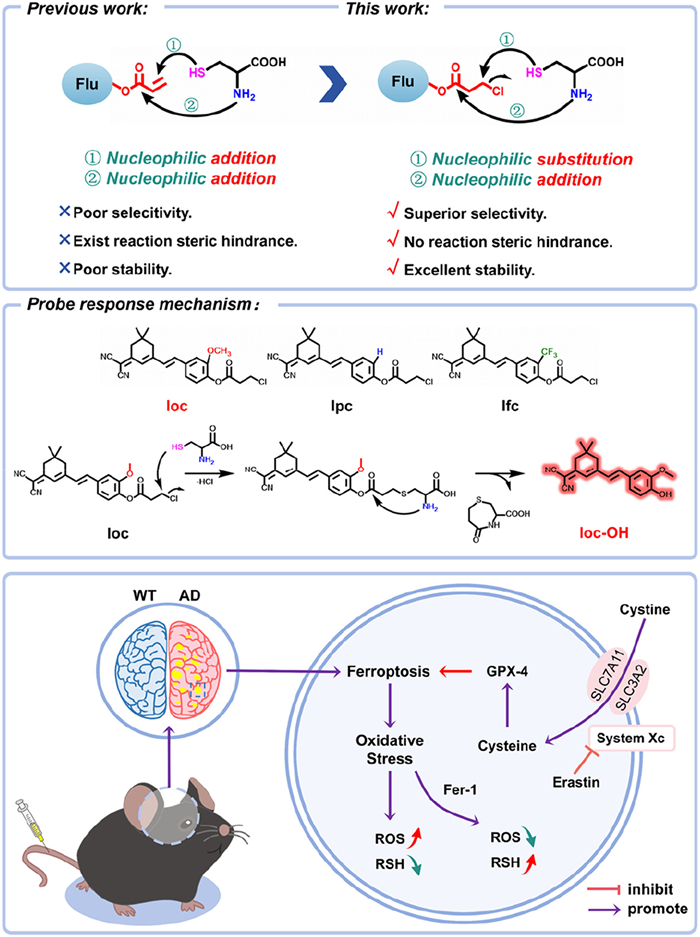
Schematic representation of probe site modification, response mechanism, and ferroptosis-mediated AD pathway.

AD typically refers to Alzheimer’s disease [1], a common neurodegenerative disorder characterized by memory loss, cognitive decline, and behavioral disturbances. In recent years, significant progress has been made in Alzheimer’s research, with genetic technologies and brain imaging techniques playing crucial roles in early diagnosis and providing new perspectives for understanding the disease’s mechanisms. However, the exact pathogenesis of Alzheimer’s remains unclear, and how to effectively prevent and treat it remains a challenge for scientists to explore.
There is a close relationship between AD and oxidative stress [2]. Oxidative stress is considered a key component in the pathogenesis of AD. In Alzheimer’s, oxidative stress is regarded as a critical factor in neuronal damage and death [3].
Cysteine (Cys), as a key precursor of glutathione (GSH) and an essential component of the thiol antioxidant system, plays a dual role in the pathological progression of AD: it participates in antioxidant defense while potentially exacerbating neural damage through metabolic abnormalities. In AD patients, on one hand, Cys metabolic disorders lead to significantly reduced GSH levels [4], cellular redox imbalance [5,6], and oxidative damage to neurons; on the other hand, it worsens Aβ [7] deposition and Tau protein hyperphosphorylation. Furthermore, the expression or function of System Xc⁻ is downregulated or impaired in the brains of AD patients, resulting in insufficient Cys supply. Cys deficiency leads to GSH depletion, inactivation of glutathione peroxidase 4 (GPX4) [8], uncontrolled lipid peroxidation, and ultimately triggers ferroptosis (an iron-dependent programmed cell death) [9,10], accelerating neuronal loss [11,12]. Therefore, marking the dynamic changes in Cys levels within the ferroptosis pathway during AD [13,14] onset can further elucidate the mechanisms of oxidative stress in AD, potentially providing new directions for the prevention and treatment of AD through interventions targeting oxidative stress.
Our research group has long been engaged in the design of biothiol fluorescent probes and their applications in bioimaging. We have developed a series of biothiol probes [15–18] and achieved discriminative detection of three biothiols through pH regulation of the acryloyl group [19]. However, during the preparation and separation of these probes with acryloyl group, these compounds exhibited poor stability and were prone to hydrolysis, and their specificity for a particular biothiol was insufficient. Therefore, based on our previous work, we introduced a chlorine atom into the probe. On one hand, this modification changes the nucleophilic addition to an SN2 substitution [20,21], and on the other hand, it alters the conjugation effect between the formyl group and the double bond at the third position. As a result, the probe demonstrates improved stability, rapid and specific response to Cys [22], and, importantly, the introduction of the chlorine atom enhances the probe’s lipophilicity, enabling it to cross the blood-brain barrier (BBB) and label Cys in situ in the living brain [23]. Through in situ imaging in AD models, we revealed a decrease in Cys levels during AD onset. Based on Cys being a core molecule in ferroptosis regulation, we found that ferroptosis can mediate the downregulation of Cys levels in AD using ferroptosis inducers and inhibitors. This study not only aims to uncover the core pathological mechanisms of AD but also provides theoretical foundations and technical support for early diagnosis, targeted therapy, and personalized medicine (Scheme 1).
To address the issues of poor stability and specificity of the acryloyl group, we innovatively introduced a chlorine atom into the recognition group, achieving dual modification of the reaction site: on one hand, modulating the conjugation effect between the formyl group and the double bond at the third position, and on the other hand, transforming the nucleophilic addition mechanism into a faster SN2 substitution reaction. In selecting the fluorophore backbone, we chose isoflurone for its photochemical advantages (large Stokes shift, long wavelength) and linked it with a chloropropionyl group. Additionally, by introducing electron-withdrawing and electron-donating groups at the ortho positions of the site, we adjusted the nucleophilicity of the site to fine-tune the reactivity and selectivity of the reaction site, resulting in a series of probes: lpc, lfc and loc. We then used nuclear magnetic resonance (NMR) with high resolution mass spectrometry (HR-MS) to characterise the series of probes. All synthesis steps with characterisation results, as well as all materials, animals and instrumentation utilized in this paper, are provided in Supporting information.
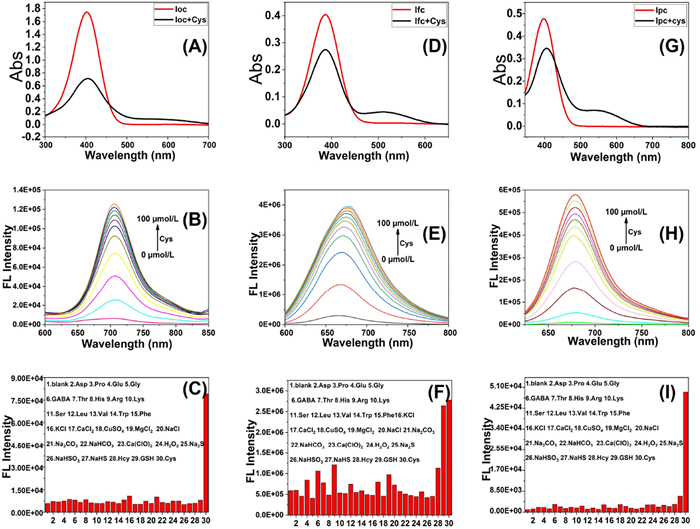
Optical testing of probes: Firstly, optical UV absorption tests were carried out on the series of probes reacting with Cys and the spectra showed that the highest UV absorption peaks of loc, lfc and lpc probes were at 569, 569 and 550 nm, respectively. Then we tested Cys fluorescence titration spectra for the series of probes, and the fluorescence emission of the probes loc, lfc, and lpc were 710, 675, and 665 nm, respectively. Finally, we studied the selectivity of the series of probes for biothiols. Among them, the lfc is obviously different from the other two probes. It can be interpreted as that trifluoromethyl has a certain electron pulling ability, leading to a significant nucleophilicity increase in the acyl site compared to the others, this makes it less selective to biothiols, Because of loc’s long fluorescence emission, it was selected for subsequent experiments (Fig. 1). We again obtained a detection limit of 0.706 µmol/L and a logP of 1.4756 for the probe.
The loc was then subjected to kinetic assay and pH test. In the kinetic test, the fluorescence of the probe loc after adding Cys (200 µmol/L) reaches a plateau at around 600 s (Fig. S11A in Supporting information). At the same time, we added GSH (2 mmol/L) or Hcy (15 µmol/L) for the kinetic test, respectively. Combined with dynamic testing, we further confirm the selection performance of the probe for Cys we found that the has a better selectivity of probe loc for Cys. In pH tests, the probe loc itself demonstrated excellent stability in the pH (4–10) range, but with the addition of Cys, loc showed a large increase in fluorescence intensity at physiological pH 7.0. We also investigated the probe and Cys response at higher pH. The results showed that the stronger alkalinity, the stronger fluorescence intensity after the reaction between probe and Cys. It can be interpreted that reaction product R-OH was changed to R-O- under alkaline conditions, electron delocalization enhancement was enhanced, and the ICT effect of the dye was strengthened, so the fluorescence intensity of the probe was enhanced substantially (Fig. S11B in Supporting information). However, the probe showed a specific response to Cys even under alkaline conditions (Fig. S12 in Supporting information).
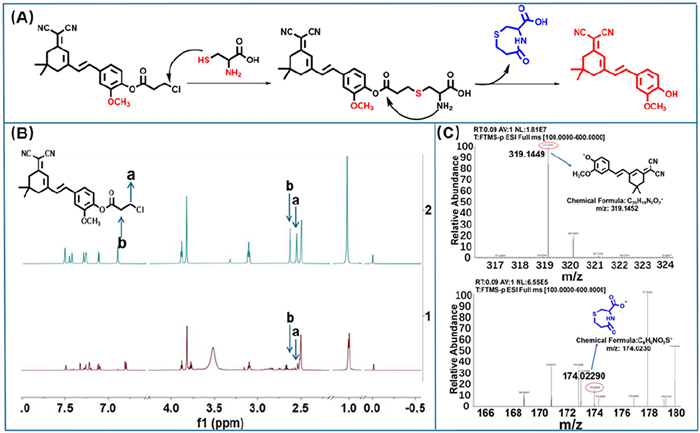
Synthesis and characterisation of probes (Fig. 2A): On the one hand, the intramolecular charge transfer (ICT) effect of the fluorophor framework can be enhanced by the introduction of –OCH3 at the adjacent position of the reaction site, and the fluorescence emission of the probe can be redshifted (35 nm) by its electron pushing ability. On the other hand, the nucleophilic activation ability of chloropropionyl ester can be moderately weakened, and the selectivity of probe loc to Cys with high nucleophilic activity can be significantly improved. The structural changes of probe loc and Cys were characterized by NMR and HR-MS. The nuclear magnetic hydrogen spectrum (Fig. 2B) showed that with the addition of Cys, the characteristic peak areas of a and b of the loc probe gradually decreased, indicating that the chloropropionyl group was gradually dissociated. In high-resolution mass spectrometry, 174.02290 was the reaction product 5-oxo-1,4-thiazepane-3-carboxylic acid, which further confirmed the nucleophilic substitution-cyclization mechanism between the probe and Cys (Fig. 2C). This is why the probe can respond quickly to Cys.
We first evaluated the ability of the probe to label Cys at the cellular level. We selected two types of cells that are not easily differentiated, namely HeLa cells and PC-12 cells. First, the probe with different concentrations (0–30 µmol/L) was incubated with the two kinds of cells for 24 h, and the probe toxicity was detected by cell counting kit-8 (CCK-8). It was found that even with loc probe concentrations as high as 30 µmol/L, the survival rate of the cells remained above 90%, indicating that the probe had very low toxicity (Fig. S13 in Supporting information). We then tested the loc probe’s ability to image exogenous and endogenous Cys in two types of living cells. We incubated the loc probe with the two kinds of cells for 10 min and found that both kinds of cells showed bright red fluorescence. In addition, we incubated N-acetyl-L-cysteine (NAC) (exogenous Cys supplement) with the cells for 30 min, then added loc probe and incubated for 10 min, and found that the red fluorescence of the cells was brighter. In addition, we also incubated N-ethylmaleimide (NEM) (biological mercaptan scavenger) with the cells for 20 min, and then incubated with loc probe for 10 min, and found that the red fluorescence of the cells disappeared. Finally, we incubated the above NEM-incubated cells with NAC for 20 min, and then incubated the loc probe with the cells for 10 min, and the cells recovered bright red fluorescence. (Fig. S14 in Supporting information) The results show that loc has good cellular permeability and can respond sensitively to Cys levels in cells.
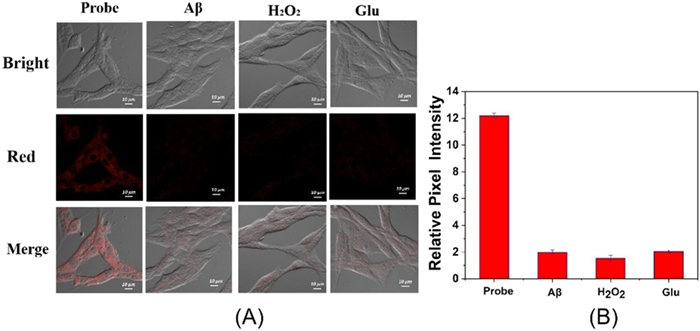
This study mainly aims to reveal the correlation between AD and Cys concentration, so we establish AD models at the cellular level. The AD model was established with Aβ, H2O2 and glutamate inducers (Section 9 in Supporting information). The above models were incubated with loc, and compared with the blank experiment, it was found that the fluorescence intensity of the three groups of cells was significantly reduced. This indicates that the level of Cys in AD is decreased. These results indicated that AD model caused oxidative damage to cells (Fig. 3).
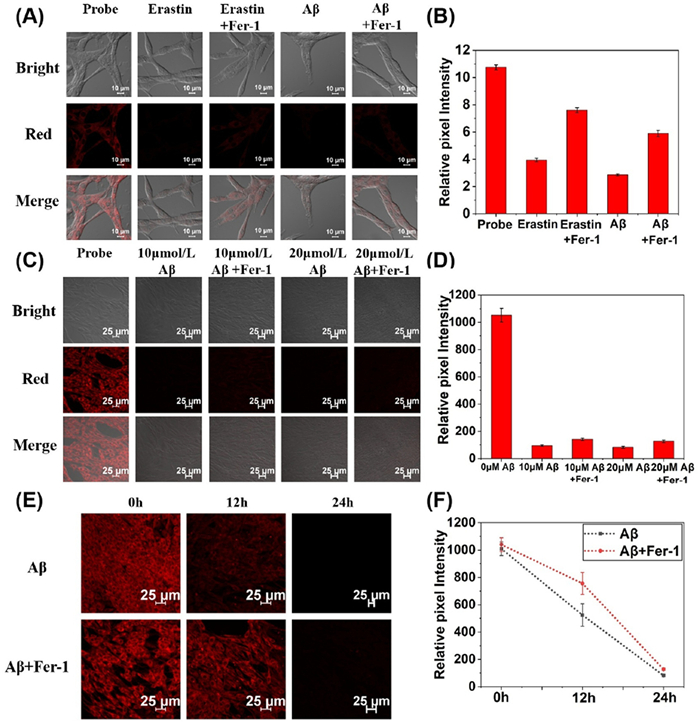
We know that ferroptosis, an iron-dependent programmed cell death, accelerates neuron loss. Cys plays a key role in the regulation of iron death by maintaining GSH synthesis and GPX4 activity. Therefore, the level dynamic changes of Cys in the ferroptosis pathway when AD is labeled can further elucidate the regulatory mechanism of Cys in AD. Cells were incubated with ferroptosis inducer erastin for 24 h, and then loc was added for 10 min, and it was found that the fluorescence intensity of cells was weakened compared with the blank experiment. In the other group, cells were incubated with ferroptosis inducer and inhibitor for 24 h, and loc was added for 10 min, and the fluorescence intensity of cells was found to rise. It indicated that the level of Cys was down during the process of ferroptosis. AD model was established by Aβ. One group was incubated with Aβ only for 24 h as a control group, and the other group was incubated with Aβ and Fer-1 (ferroptosis inhibitor) for 24 h. It was found that the addition of Fer-1 increased the fluorescence intensity of the cells (Figs. 4A and B). At the same time, we carried out a comparison experiment between the fluorescence intensity of the cells under different concentrations of Aβ (0, 10, 20 µmol/L) and the fluorescence intensity of the cells co-incubated with Fer-1, and found that the fluorescence intensity of the cells added with Fer-1 had a correction (Figs. 4C and D). Then, time series monitoring was performed on AD group and inhibition group (co-incubated with Aβ and Fer-1), and fluorescence intensity was measured at three time points of 0, 12, 24 h. The results showed that the fluorescence intensity of the inhibition group recovered to a certain extent compared with the AD model at 12 and 24 h (Figs. 4E and F). These results suggest that oxidative damage in AD cell models leads to downregulation of Cys levels, which are restored to a certain extent by co-incubation with Fer-1. This suggests that oxidative stress induced by AD can be alleviated by inhibiting the ferroptosis pathway, and further verifies the biological correlation between AD and ferroptosis pathway.
All the animal experiments were performed by following the protocols approved by the Radiation Protection Institute of Drug Safety Evaluation Center in China (production license: SYXK (Jin) 2025–0002) and the Animal Ethics and Use Committee. C57BL/6 type mice and C57BL/6 of AD model type mice (6–8 weeks, male) were purchased from Beijing Sibeifu Biotechnology Co. LTD. They were housed under a 12-h light/dark cycle and were allowed free access to food and water.
Next, in order to study the ability of the probe to label Cys at the level of AD mice in vivo, we need to confirm the success of AD modeling. First, we characterized the behavior of AD mice (Fig. S15A in Supporting information): We used open field experiment to place three AD mice and three wild-type (WT) mice in a four-way open field, observe their exercise time, rest time, and other relevant kinematic data within 10 min, and repeated the experiment (Fig. S15B in Supporting information). After the open field experiment, we conducted a new object recognition experiment, placing two identical objects in the open field, the objects were 15 cm away from the open field wall, and the objects were 25 cm away from each other, and then placing the mice from the midpoint of the non-object area to the position against the wall, allowing them to explore freely for 10 min. The mice were then removed and allowed to rest for 5 h. Then, one of the objects was replaced with a new one, made of the same material but with a different color and shape, and the mice were put back in the same position and allowed to explore freely for 10 min. An infrared camera placed above the mice recorded how long the mice explored the old and new objects and calculated the new object index (NOI). The NOI was calculated by recording how long the mice explored old and new objects. It was found that WT mice had a significantly higher new object index (a measure used to assess object recognition ability) than AD mice (Figs. S15C and D in Supporting information). All behavioral results showed that AD mice exhibited impaired brain function (Fig. S16 in Supporting information).
Then we performed coronal sections on the brains of AD and WT mice of the same age. HE staining was performed on the coronal sections first, and the results showed slight atrophy in the hippocampal sections of the AD mice compared to the WT mice (Figs. S17A and B in Supporting information). Next, we examined the mouse hippocampus by immunofluorescence assay, staining the hippocampus with 4′,6-diamidino-2-phenylindole (DAPI) (blue) and labeling Aβ with red fluorescence. The results showed that Aβ deposition (red) was evident in the hippocampal sections of AD mice (Fig. S17C in Supporting information). At the same time, we also performed silver plating staining on the sections, and the results showed that the hippocampal sections of AD mice showed obvious neurofibrillary tangles (Figs. S17D and E in Supporting information). The above section results characterized AD from a pathological point of view. In conclusion, the results of behavioral and pathological characterization demonstrated the successful establishment of a mouse model of AD.
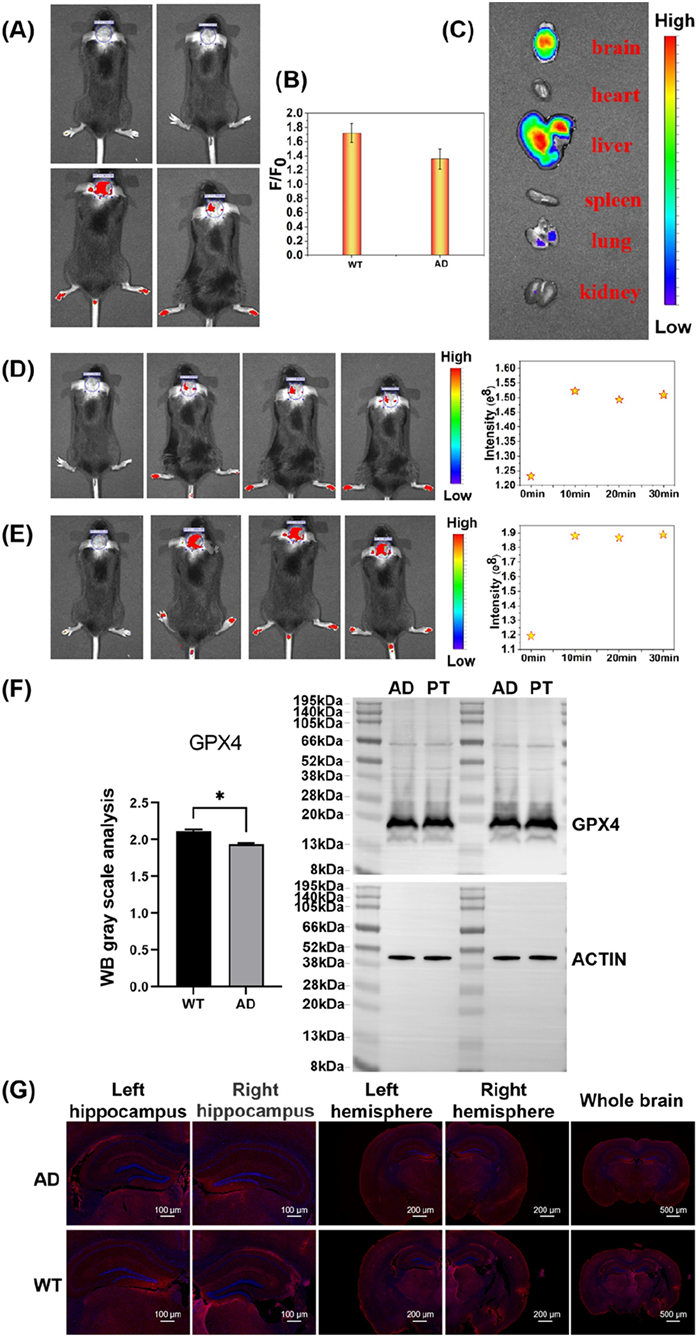
Before studying the AD model (Section 11 in Supporting information), we evaluated the ability of the probe to cross the BBB. loc was injected into WT mice and AD mice by tail vein injection respectively. After 10 min, through in vivo imaging, we found that the brain of mice was lit up with red fluorescence, and the results showed that loc reacted with Cys in the brain and released fluorescence signals. Moreover, it was found that the fluorescence of the WT mice group was significantly higher than that of the AD mice group (Figs. 5A–C). Therefore, the probe can mark Cys in situ in the brain. We further monitored the stability of loc probes in the brains of WT and AD mice (30 min) (Figs. 5D and E), and the probes showed good stability. Subsequently, Western blot (WB) experiments were performed on the brain tissues of AD and WT mice to analyze the levels of GPX-4 (ferroptosis) protein in AD mice (Fig. 5F). The results showed that GPX-4 levels in AD mice were significantly lower than those in WT mice. At the same time, we dissected the brain of AD mice and stained different brain regions. The red fluorescence of AD brain region was significantly lower than that of WT brain region (loc red, DAPI blue), indicating that the level of Cys was down-regulated in AD (Fig. 5G). These results revealed that in AD, the level of Cys was down-regulated and iron death occurred. It was further confirmed that AD was closely related to oxidative stress injury.
In summary, in order to solve the problem of instability of chloropropionyl fluorescent compounds and poor selectivity to biothiols, site modification was carried out in this study. By modifying acrylyl group to chloropropionyl group, the stability of the compound was ensured, and the reaction mechanism with Cys was changed from nucleophilic addition to nucleophilic substitution, and the reaction rate was increased. At the same time, by introducing the electron pushing group methoxy, the reactivity of the chloropropionyl group was regulated to ensure the specific response of the probe to Cys. Interestingly, the introduction of chlorine atoms further improved the probe’s fat-solubility, allowing the probe to cross the BBB. Specific fluorescence imaging of Cys by probes at cellular and in vivo levels revealed that Cys can counteract AD induced oxidative injury through iron death pathway during AD.
The authors declare that they have no known competing financial interests or personal relationships that could have appeared to influence the work reported in this paper.
Yongchuang Li: Writing – original draft, Investigation. Haiyue Liu: Validation, Data curation. Caixia Yin: Project administration, Funding acquisition. Fangjun Huo: Writing – review & editing, Supervision.
We thank the National Natural Science Foundation of China (Nos. 22377071, U23A6009), Research Project Supported by Shanxi Scholarship Council of China (No. 2022–002), the Shanxi Province Science Foundation (No. 202203021221009), Shanxi Province science and technology activities for overseas people selected funding project (No. 2024001).
Supplementary material associated with this article can be found, in the online version, at doi:
Y. Sun, C. Yan, L. He, et al., Ageing Res. Rev. 87 (2023) 101899. doi: 10.1016/j.arr.2023.101899
N. Cherbuin, E.I. Walsh, L. Leach, et al., Alzheimers Dement. 19 (2023) e059828. doi: 10.1002/alz.059828
A. Ashraf, J. Jeandriens, H.G. Parkes, et al., Redox Biol. 32 (2020) 101494. doi: 10.1016/j.redox.2020.101494
Y. Li, Y. Du, Y. Zhou, et al., Cell Commun. Signal. 21 (2023) 327. doi: 10.1186/s12964-023-01267-1
M.A. Thorwald, J.A. Godoy-Lugo, H.J. Forman, et al., Alzheimers Dement. 19 (2023) e079300. doi: 10.1002/alz.079300
Z. Wang, Nat. Cell Biol. 25 (2023) 515. doi: 10.1038/s41556-023-01129-5
A.C.J. Wang, T.D. Boyd, N. Markham, et al., Alzheimers Dement. 18 (2022) e067298. doi: 10.1002/alz.067298
S.G. Kathman, B.F. Cravatt, Nat. Chem. Biol. 16 (2020) 482–483. doi: 10.1038/s41589-020-0511-3
K. Hadian, B.R. Stockwell, Cell 181 (2020) 1188. doi: 10.1016/j.cell.2020.04.039
G. Plascencia-Villa, G. Perry, Alzheimers Dement. 16 (2020) e043978. doi: 10.1002/alz.043978
J. Schaeverbeke, S.O. Tomé, A. Ronisz, et al., Alzheimers Dement. 19 (2022) 1440–1451.
H.Z. Yan, T. Zou, Q. Z. et al., Signal Transduct. Target. 6 (2021) 49. doi: 10.38068/kjcl.96.3
H.N. Bell, B.R. Stockwell, W. Zou, Immunity 57 (2024) 941–956.
Y. Liu, D. Zhao, F. Yang, et al., ACS Nano 18 (2024) 7890–7906. doi: 10.1021/acsnano.3c09286
Y. Wang, H. Yan, F. Huo, et al., Nano Today 57 (2024) 102401. doi: 10.1016/j.nantod.2024.102401
H. Yan, F. Huo, Y. Yue, et al., J. Am. Chem. Soc. 143 (2021) 318–325. doi: 10.1021/jacs.0c10840
Y. Yue, F. Huo, P. Ning, et al., J. Am. Chem. Soc. 139 (2017) 3181–3185. doi: 10.1021/jacs.6b12845
W. Zhang, F. Huo, F. Cheng, et al., J. Am. Chem. Soc. 142 (2020) 6324–6331. doi: 10.1021/jacs.0c00992
Y. Yue, F. Huo, P. Yue, et al., Anal. Chem. 90 (2018) 7018–7024. doi: 10.1021/acs.analchem.8b01406
G.C. Fu, ACS Cent. Sci. 3 (2017) 692–700. doi: 10.1021/acscentsci.7b00212
Y. Shi, A.H. Hoveyda, Angew. Chem. Int. Ed. 55 (2016) 3455–3458. doi: 10.1002/anie.201600309
P. Huang, W. Zhang, F. Huo, et al., Chin. Chem. Lett. 37 (2026) 111163. doi: 10.1016/j.cclet.2025.111163
J. Zeng, M. Liu, T. Yang, et al., Chin. Chem. Lett. 36 (2025) 110166. doi: 10.1016/j.cclet.2024.110166

Scheme 1 Schematic representation of probe site modification, response mechanism, and ferroptosis-mediated AD pathway.

Figure 1 UV–visible spectra before and after response of 10 µmol/L loc (A), lfc (D), lpc (G) each with 30 µmol/L Cys. Fluorescent titration of 10 µmol/L loc (B), lfc (E), lpc (H) each with Cys (0–100 µmol/L). Fluorescent selectivity tests of loc (C), lfc (F), lpc (I) each for different analytes (PBS/CH3CN = 1:1, slit width: 10 nm/10 nm).

Figure 2 (A) Schematic diagram of the response mechanism between loc and Cys. (B) NMR titration hydrogen spectrum of loc with Cys. (C) Mass spectrometry titration effect of loc with Cys.

Figure 3 (A) From left to right: Cys fluorescence imaging of loc with the blank group, Aβ amyloidase-induced AD model group, H2O2-induced AD model group, and glutamate (Glu)-induced AD model group. Scale bar: 10 µm. (B) Relative fluorescence intensity corresponding to (A). The data were shown as mean ± standard deviation (SD) (n = 3).

Figure 4 (A) From left to right: Fluorescence imaging of loc with the blank group, ferroptosis model group, ferroptosis inhibition group, AD group, and AD + Fer-1 group. (B) Relative fluorescence intensity corresponding to (A). (C) Fluorescence imaging of loc in the Aβ-induced AD model group and inhibition group (0–20 µmol/L). (D) Relative fluorescence intensity corresponding to (C). µM = µmol/L. (E) Fluorescence imaging of loc in the AD group and AD + Fer-1 group (0, 12, 24 h). (F) Relative fluorescence intensity corresponding to (E). Scale bar: (A) 10 µm, (C, E) 25 µm. The data were shown as mean ± SD (n = 3).

Figure 5 (A–C) Fluorescence imaging of the brain of WT and AD mice and relative fluorescence intensity. (D, E) Fluorescent imaging of WT and AD mouse brains within 30 min, respectively. (F) WB experiment of brain tissue from WT and AD mice. (G) Coronal sections of the brain from WT and AD mice showing probe fluorescence (red) and DAPI fluorescence (blue). The data were shown as mean ± SD (n = 3). *P < 0.05.

 扫一扫看文章

扫一扫关注我们
 DownLoad:
 下载:
下载:
 下载:
下载: