Engineering Research Center of Western Resource Innovation Medicine Green Manufacturing of the Ministry of Education, School of Chemical Engineering, Key Laboratory of Synthetic and Natural Functional Molecule of the Ministry of Education, College of Chemistry and Materials Science, Northwest University, Xi'an 710127, China
guoyuan@nwu.edu.cn (Y. Guo). 1 These authors contributed equally to this work.
Received Date:
16 June 2025 Accepted Date:
19 August 2025 Revised Date:
18 August 2025 Available Online:
15 July 2026
Abstract:
Nitric oxide (NO), a significant signaling molecule, plays essential roles in diverse physiological and pathological processes including cell senescence. Lysosomes are recognized as pivotal subcellular organelles of cellular senescence, whereas the influence of senescence on lysosomal NO homeostasis remains poorly understood. To explore the potential association between cellular senescence and alterations in lysosomal NO levels, herein, we developed FL-O1, a novel ratiometric fluorescent probe specifically designed for lysosomal NO detection. The probe selectively reacts with NO through the recognition unit of o-phenylenediamine, forming an extended conjugated system that generates a distinct ratiometric optical signal with exceptional sensitivity (detection limit = 95 nmol/L). FL-O1 exhibits versatile applications in both in vitro and in vivo contexts. It successfully visualizes exogenous and endogenous NO dynamics in live zebrafish models and enables specific monitoring of lysosomal NO levels in cellular systems. Importantly, the probe was utilized to quantitatively evaluate NO levels in senescent states of cancer and healthy cells. The results revealed two key insights: (1) Senescent cells consistently maintain higher NO concentrations compared to their non-senescent counterparts, and (2) senescent healthy cells exhibit elevated NO levels relative to senescent cancer cells. This innovative small-molecule probe represents a significant advancement in lysosomal NO imaging technology. Its unique design and capabilities provide a powerful tool for investigating the role of lysosomal NO in cellular senescence, potentially uncovering novel mechanistic insights and facilitating the development of targeted therapeutic strategies for senescence-related disorders.
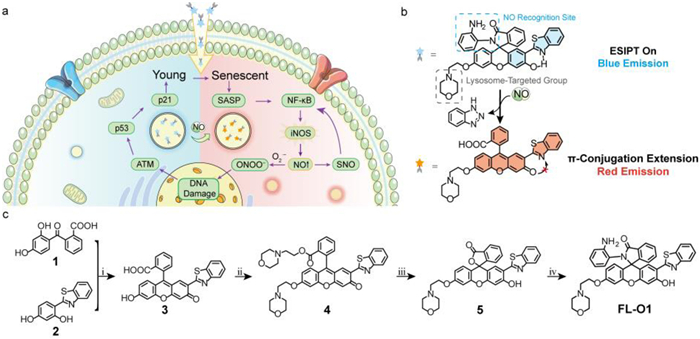
Nitric oxide (NO), an important signaling molecule, is produced by nitric oxide synthase including inducible nitric oxide synthase (iNOS), endothelial nitric oxide synthase (eNOS), and neuronal nitric oxide synthase (nNOS). It plays a significant role in various physiological processes, including signal transduction, vasodilation, and immune regulation [1–3]. However, imbalanced NO levels can lead to numerous pathologies such as, cancer [4,5], cardiovascular diseases [6,7] and neurodegenerative disorders [8–10]. Notably, cellular senescence, manifesting as a stable cell cycle arrest state induced by cellular stress or damage [11–14], which has been shown to be closely regulated by NO-mediated mechanisms [15–20]. As shown in Fig. 1a, when the cells enter in senescent state, the nuclear factor kappa-B (NF-κB) pathway is activated through secretion of senescence-associated secretory phenotype (SASP) factors [21], and subsequently induce iNOS expression and elevate NO production [22,23]. The amplified NO levels further modulate NF-κB signaling pathway through nitrosylation of thiols in proteins [24]. Furthermore, NO reacts with superoxide anion (O2•−) to generate highly toxic peroxynitrite (ONOO−), causing DNA damage that activates the ataxia telangiectasia mutated (ATM) pathway [25]. This cascade leads to p53 accumulation and transcriptional activation of p21, ultimately driving cell cycle arrest and senescence [26–28]. Therefore, detecting NO levels in organisms provides crucial evidence for understanding the mechanisms of senescence-related diseases and developing targeted interventions.
Figure 1
Figure 1.
(a) The pathway diagram of the relationship between nitric oxide and cellular senescence. (b) The design of probe FL-O1. (c) The synthesis route of FL-O1. Reagents and conditions: ⅰ. Conc. H2SO4, 170 ℃, 7 h; ⅱ. 4-(2-chloroethyl) morpholine hydrochloride, KOH, isopropyl alcohol, reflux, 12 h; ⅲ. LiOH, THF: water (1:1 v/v), r.t., 2 h; ⅳ. N,N-diisopropylethylamine, 2-(7-aza-1H-benzotriazole-1-yl)-1,1,3,3-tetramethyluroniumhexafluorophosphate, THF, OPD, r.t., 16 h.
Beyond the metabolic functions, lysosomes are increasingly recognized as pivotal players in cellular senescence [29,30]. However, the impact of senescence on lysosomal NO homeostasis remains elusive, primarily due to the lack of suitable detection tactics. It is worth noting that fluorescent probe-based methods have emerged as a powerful tool for NO detection, offering high sensitivity, excellent selectivity and real-time monitoring capabilities [31–35], while the ratiometric fluorescent probe has the ability of self-calibrating detection based on fluorescence intensity ratio, effectively avoiding signal deviations caused by factors such as light intensity fluctuations, fluorescence quenching, or background interference in single-wavelength fluorescence detection, which are common limitations in single-wavelength fluorescence detection [36–38]. Therefore, this method is particularly suitable for studying NO dynamics in lysosomes during senescence progression.
Herein, to investigate the potential correlation between cellular senescence process and changes in NO content in lysosomes, we developed the ratiometric fluorescent probe FL-O (Scheme S1 in Supporting information). Based on the structure of the previously reported rhodol-2-(2′-hydroxyphenyl) benzothiazole (HBT) skeleton [39], a phenolic hydroxyl group was introduced to replace the julolidine group, thereby increasing the modifiable sites and constructing a ratiometric structure based on the excited-state intramolecular proton transfer (ESIPT) effect. o-Phenylenediamine (OPD) [40] was selected as the recognition site for NO in fluorescent molecule FL-O due to its ability to specifically react with NO under mild conditions, forming triazole derivatives with high efficiency in biological samples. Additionally, to enhance the ratio optical properties of the probe and achieve lysosomal targeting, we introduced a morpholine group, resulting in the development of the ratiometric probe FL-O1 (Fig. 1b). Meanwhile, we further conducted quantitative assessments of NO level in the lysosomes of cancer cells and healthy cells at senescent status by using FL-O1, while the senescent groups exhibited noticeably higher NO levels compared to the young groups, consistent with theoretical predictions, providing a valuable visualization tool for further exploration of the underlying mechanisms.
The synthesis of the probe FL-O1 is briefly illustrated in Fig. 1c. Initially, compounds 1 and 2 were synthesized according to the methodologies outlined in the supporting information. Following this, compound 3 was obtained through the cyclization reaction between compound 1 and compound 2. Subsequently, compound 4 was generated via a nucleophilic substitution reaction involving compound 3 and 4-(2-chloroethyl) morpholine hydrochloride. The next step involved the transformation of compound 4 into compound 5 through ester hydrolysis. Finally, compound 5 underwent condensation with OPD, resulting in the formation of FL-O1. All compounds were characterized using 1H nuclear magnetic resonance (NMR), 13C NMR and high-resolution mass spectrometry (HRMS). These related spectra and experimental details are presented in the supporting information (Scheme S1, Figs. S7–S25 in Supporting information).
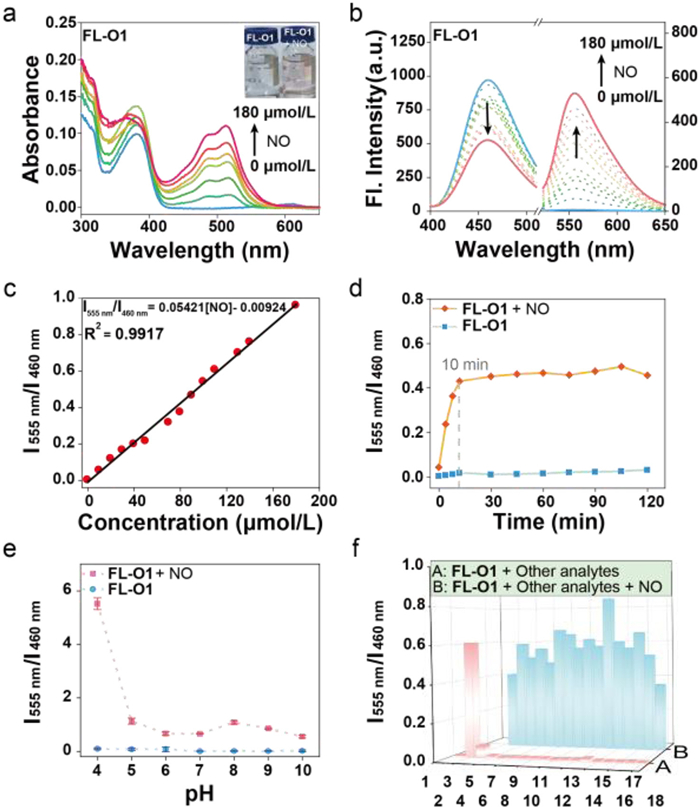
Initially, the responsiveness of FL-O1 to NO was investigated by absorption spectra monitoring. As depicted in Fig. 2a, FL-O1 solution gave a new absorption peak at 510 nm after reacting with NO, accompanied by a distinct color change of the solution from colorless to red. Next, fluorescence titration experiments were conducted to study the optical response of FL-O1 to NO. As the concentration of NO increased (0–180 µmol/L), the fluorescence intensity of FL-O1 at 460 nm gradually decreased, while the intensity at 555 nm increased. The ratio of fluorescence intensity (I555 nm/I460 nm) exhibited a significant enhancement with the addition of NO (Fig. 2b), with a strong linear relationship to NO concentration in the range of 0–180 µmol/L (R2 = 0.9917), with a calculated detection limit of 95 nmol/L (Fig. 2c). Furthermore, the ratio of fluorescence intensity (I555 nm/I460 nm) of FL-O1 increased by 160-fold. Similarly, the absorption and fluorescence spectra of FL-O presented resemble trends to those of FL-O1, as shown in Figs. S1a and b (Supporting information). These results suggest that the introduction of lysosomal localization group maintains ratiometric optical properties of the probe, enabling sensitive NO detection.
Figure 2
Figure 2.
(a) Absorption spectra of FL-O1 (10 µmol/L) in phosphate buffered saline (PBS) solution (10 mmol/L, pH 7.4, containing 20% DMSO) change as a function of DEA NONOate (at 0–180 µmol/L). (b) Fluorescence spectra of FL-O1 (10 µmol/L) change as a function of DEA NONOate (at 0–180 µmol/L). (c) Linearity of fluorescence intensity ratio I555 nm/I460 nm of FL-O1 versus the addition of concentrations of DEA NONOate (0–180 µmol/L). (d) Time-dependent fluorescence intensity ratio I555 nm/I460 nm of FL-O1 (10 µmol/L) in the presence of DEA NONOate (100 µmol/L). (e) The pH-dependent fluorescence intensity ratio I555 nm/I460 nm of FL-O1 (over the pH range 4.0–10.0). Data are presented as the mean ± S.D. (n = 3). (f) Selective response (A) and competing response (B) of FL-O1 to other species (100 µmol/L) in PBS solution (1. blank, 2. NO, 3. ONOO−, 4. NaNO3, 5. NaNO2, 6. HOCl, 7. H2O2, 8. TBO•, 9. •OH, 10. O2•−, 11. 1O2, 12. TBHP, 13. MgCl2, 14. CaCl2, 15. AlCl3, 16. NaCl, 17. Na2S, 18. Cys). λex1 = 385 nm, λex2 = 500 nm, slit: 2.5 nm/5 nm.
The reaction kinetics of FL-O1 (10 µmol/L) with NO (100 µmol/L) were further investigated. As shown in Fig. 2d, the fluorescence intensity ratio (I555 nm/I460 nm) of FL-O1 increased rapidly within 10 min and demonstrated excellent photostability over 2 h. Thus, a reaction time of 10 min was adopted for subsequent in solution experiments. Given that lysosomes are acidic organelles with a pH range of approximately 4.5–5.0, the FL-O1’s pH-dependent fluorescence response was evaluated. As illustrated in Fig. 2e, the probe FL-O1 exhibited stable fluorescence signals across a wide pH range of 4–10. Upon the addition of NO (100 µmol/L), FL-O1 showed a significant fluorescence intensity ratio (I555 nm/I460 nm) enhancement even under acidic conditions (pH 4–5), suggesting its applicability for NO detection in lysosomal environment. The pH-dependent fluorescence responses were also observed for the FL-O (Fig. S1c in Supporting information). To assess its specificity, the selective and anti-interference abilities of FL-O1 against reactive nitrogen species (RNS), reactive oxygen species (ROS) and common anions were evaluated. As shown in Fig. 2f, FL-O1 displayed a pronounced increase in the fluorescence intensity ratio (I555 nm/I460 nm) exclusively in the presence of NO, with no significant interference from competing analytes. Furthermore, the probe’s ability to recognize NO remained unaffected in competitive experiments, highlighting its robustness in complex cellular environments.
The design of FL-O1 takes full advantage of a spiroring switching mechanism combined with ESIPT effect (Fig. S2a in Supporting information). The fluorescein moiety is conjugated with a HBT unit, enhancing the electron withdrawing capacity and the π-conjugation extension of the fluorophore, thereby red-shifting the emission wavelength. In its native state, the probe exhibits blue fluorescence due to intramolecular hydrogen bonding between the 3′-phenolic hydroxyl group and the nitrogen atom in the HBT unit. Upon reacting with NO, the OPD moiety undergoes cyclization to form a benzotriazole derivative, triggering spiroring opening. This results in a conjugated structure characterized by a weakly electron-donating 6′–hydroxyl group and an electron-withdrawing 3′-ketone group, leading to a red fluorescence emission. To confirm the reaction mechanism, HRMS analysis was performed (Fig. S2b in Supporting information). After NO addition, a new peak at m/z 680.1953 appeared, corresponding to the triazole derivative intermediate formed during NO recognition (Fig. S2c in Supporting information). A subsequent peak at m/z 601.1332 was attributed to nucleophilic attack by water (Fig. S2d in Supporting information), consistent with the proposed mechanism. These results demonstrate that NO induces triazole formation, as supported by prior studies [41–43]. Parallel experiments with FL-O yielded analogous responses toward NO (Figs. S3 and S4 in Supporting information), confirming a shared sensing mechanism.
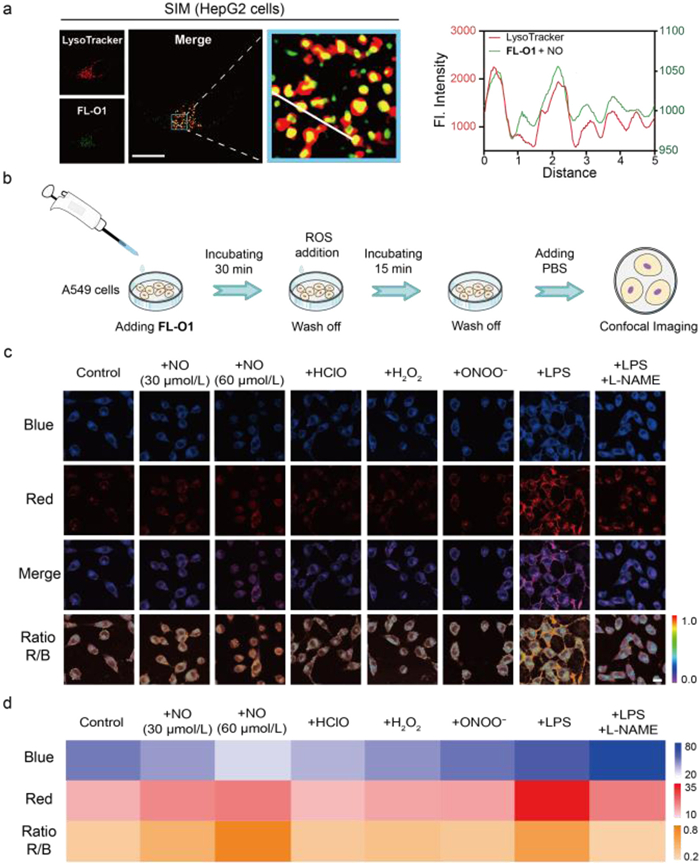
The cytotoxicity of FL-O and FL-O1 to the A549, HepG2 and NRK-52E cells were then evaluated by MTT assays. As shown in Fig. S5 (Supporting information), all treatment groups exhibited cell viability exceeding 85%, indicating high biocompatibility of FL-O and FL-O1 for live-cell experiments. Before focusing on the NO content within lysosomes, systematic colocalization analyses were conducted in A549 cells to evaluate the organelle-targeting specificity of FL-O1 and FL-O. Using multiplexed fluorescence imaging with commercial organelle trackers (MitoTracker Deep Red FM for mitochondria; LysoTracker Deep Red for lysosomes), distinct subcellular distribution patterns were observed (Fig. S6 in Supporting information). Upon NO activation, FL-O1 exhibited pronounced lysosomal colocalization evidenced by significant overlap (Pearson’s correlation coefficient (PCC) = 0.89) between its activated red-channel emission (λem = 595 ± 25 nm) and LysoTracker Deep Red’s signal (λem = 695 ± 35 nm), and minimal mitochondrial association (PCC = 0.54). In contrast, FL-O demonstrated substantially lower lysosomal targeting efficiency (PCC = 0.71), confirming FL-O1’s superior lysosomal specificity. To further validate this targeting capability, the structured illumination microscopy (SIM) super-resolution fluorescence imaging was performed for FL-O1 treated HepG2 cells. As shown in Fig. 3a, super-resolution imaging in HepG2 cells clearly demonstrated FL-O1’s precise accumulation within lysosomal compartments. Therefore, FL-O1 was selected for subsequent in situ lysosomal NO monitoring experiments.
Figure 3
Figure 3.
(a) Structured illumination microscopy (SIM) super-resolution images of HepG2 cells co-stained with FL-O1 and the LysoTracker Deep Red (70 nmol/L, λex = 640 nm, λem = 660–730 nm). Scale bar: 5 µm. Plots in the last column represent intensity of the linear region across the cell (white line in the previous column). (b) The processes of cell culture and imaging. (c) Representative confocal fluorescence imaging of A549 cells treated with FL-O1 (5 µmol/L, 30 min) and cells were respectively co-incubated with DEA NONOate (30 µmol/L, 60 µmol/L), HClO (60 µmol/L), H2O2 (60 µmol/L), ONOO− (60 µmol/L), pretreated with LPS (20 µg/mL), and pre-stimulated with LPS (20 µg/mL), L-NAME (10 µmol/L). Scale bar: 20 µm. (d) Thermal energy map of relative fluorescence intensity of FL-O1-stained A549 cells in the blue channel, red channel and the quantification of fluorescence intensity ratio IRed/IBlue (R/B) in each group. The blue channel: λex = 405 nm, λem = 420–470 nm. The red channel: λex = 488 nm, λem = 570–620 nm.
The process of cell imaging is shown in Fig. 3b, and we further investigated FL-O1’s capacity to image exogenous and endogenous NO in living cells. Upon treating of A549 cells containing FL-O1 with diethylamine nononate (DEA NONOate, 30, 60 µmol/L) [44], we observed progressive attenuation of blue-channel fluorescence emission accompanied by a corresponding enhancement in red-channel emission. The IRed/IBlue ratio demonstrated significant correlation with elevated NO levels, whereas negligible correlation with other ROS species (HClO, H2O2 and ONOO−), thereby validating FL-O1’s dual capabilities in quantitative NO detection and selective discrimination against interferents. As demonstrated in Figs. 3c and d, lipopolysaccharide (LPS)-stimulated cells, which activates the Toll-like receptor 4 (TLR4)/NF-κB pathway to upregulate iNOS expression and boost NO generation [45–47], showed 1.92-fold enhancement in IRed/IBlue ratio when incubated with FL-O1. Importantly, this enhanced response can be effectively reversed by the following N′-nitro-L-arginine-methyl ester hydrochloride (L-NAME) co-treatment, a specific NOS inhibitor [48], compared to the LPS group. These findings provide direct evidence supporting FL-O1’s dual-capability for real-time monitoring of both exogenous and endogenous NO dynamics in living cells.
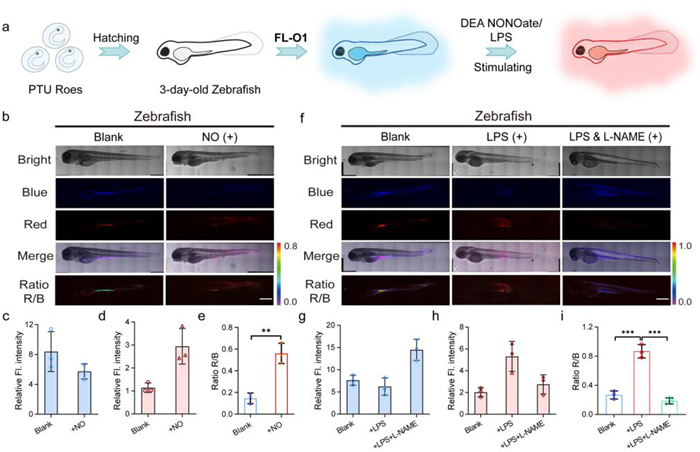
Building upon previous investigations, we established zebrafish model treated with propylthiouracil (PTU) to investigate FL-O1’s in vivo NO monitoring capabilities, as shown in Fig. 4a. Zebrafish treated exclusively with FL-O1 displayed intense blue fluorescence but minimal red signal (Figs. 4b–i). Both DEA NONOate-induced exogenous NO and LPS-triggered endogenous NO significantly enhanced the IRed/IBlue ratio, demonstrating FL-O1’s responsiveness in living organisms. Importantly, NOS inhibitor L-NAME effectively attenuated this response, confirming the specificity of FL-O1-mediated NO detection. Collectively, these in vivo results validate FL-O1’s dual capability for visualizing both exogenous and endogenous NO dynamics within live organisms.
Figure 4
Figure 4.
(a) The illustration of FL-O1-stained zebrafish imaging exogenous/endogenous NO. (b) Representative confocal fluorescence imaging of zebrafish treated with FL-O1 (10 µmol/L, 40 min) and cells were respectively co-incubated with DEA NONOate (60 µmol/L). (c–e) Relative fluorescence intensity of FL-O1-stained zebrafish imaging exogenous NO in the blue channel, red channel and the quantification of fluorescence intensity ratio R/B (IRed/IBlue) in each group. (f) Representative confocal fluorescence imaging of zebrafish pretreated with LPS (10 µg/mL), pretreated with LPS (10 µg/mL) and L-NAME (10 µmol/L). (g–i) Relative fluorescence intensity of FL-O1-stained zebrafish imaging endogenous NO in the blue channel, red channel and the quantification of fluorescence intensity ratio R/B (IRed/IBlue) in each group. The blue channel: λex = 405 nm, λem = 420–470 nm. The red channel: λex = 488 nm, λem = 570–620 nm. Scale bar: 400 µm. Data are presented as the mean ± S.D. (n = 3). **P < 0.01, ***P < 0.001.
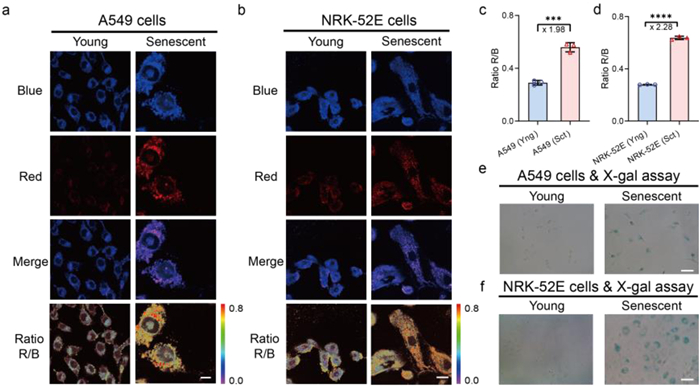
To systematically investigate the correlation between NO levels and cellular senescence, we constructed both NRK-52E and A549 cellular senescence models (Fig. 5). Cells were treated with mitomycin C for 48 h. Mitomycin C is a well-established DNA crosslinking agent known to induce DNA damage and subsequent cellular senescence [49], commonly used in our group [50]. Senescence status was confirmed through X-gal staining analysis (Figs. 5e and f), where characteristic blue precipitate accumulation was exclusively observed in MitoC-treated senescent cells, in contrast to their untreated young counterparts. Fluorescence imaging using FL-O1 revealed notable differences in NO dynamics between young and senescent states. As illustrated in Figs. 5a and c, the IRed/IBlue ratio in senescent A549 cells exhibited a marked increase (>1.98-fold) compared to young cells, indicating elevated NO levels during cellular senescence. Subsequent experiments with NRK-52E cells demonstrated an even more pronounced enhancement (>2.28-fold) in senescent cells, suggesting that normal cells may generate higher NO levels than cancer cells during the senescence process (Figs. 5b–d). These comprehensive results, obtained through comparative analysis of both normal and cancer cell lines, consistently demonstrate that cellular senescence is associated with significantly increased NO levels. This finding not only validates FL-O1’s capability for precise NO detection in diverse cellular contexts but also provides new insights into the complex relationship between NO dynamics and cellular aging processes.
Figure 5
Figure 5.
(a) Representative confocal fluorescence images for A549 cells and MitoC-induced senescent A549 cells treated with FL-O1 (5 µmol/L, 30 min). (b) Representative confocal fluorescence images for NRK-52E cells and MitoC-induced senescent NRK-52E cells treated with FL-O1 (5 µmol/L, 30 min). (c, d) Quantification of fluorescence intensity ratio R/B in each A549 cells group and quantification of fluorescence intensity ratio R/B (IRed/IBlue) in each NRK-52E group. Error bars represent S.D. (n = 3). ***P < 0.001, ****P < 0.0001. (e, f) Representative images for MitoC-induced senescent A549 cells and MitoC-induced senescent NRK-52E cells respectively incubated with X-gal. The blue channel: λex = 405 nm, λem = 420−470 nm. The red channel: λex = 488 nm, λem = 570−620 nm. Scale bars: 20 µm (a, b), 100 µm (e, f). Sct, senescent; Yng, young.
In conclusion, we have successfully developed a lysosome-targeted ratiometric fluorescent probe, FL-O1, for precise detection and visualization of NO. The probe achieves a remarkable optical signal response with a detection limit below 100 nmol/L (specifically, 95 nmol/L) through a synergistic combination of an excited-state intramolecular proton transfer mechanism and a spiral ring-switching process. FL-O1 also demonstrates superior ratiometric response with a high signal-to-noise ratio and remarkable selectivity against competing analytes. Through comprehensive biological evaluations, we validated FL-O1’s utility in real-time monitoring of lysosomal NO fluctuations in living cells and in vivo NO visualization in zebrafish models. The comparative analysis of NO levels between young and senescent cellular states revealed that senescent cells consistently maintain higher NO concentrations, with normal cells showing more pronounced NO elevation than cancer cells during senescence. This innovative probe provides a powerful molecular tool for investigating lysosomal NO dynamics, offering unique insights into cellular senescence mechanisms and potentially facilitating novel therapeutic strategies for senescence-related disorders.
Declaration of competing interest
The authors declare that they have no known competing financial interests or personal relationships that could have appeared to influence the work reported in this paper.
This work was supported by the National Natural Science Foundation of China (Nos. 22477101, 22277098, and 22037002), Shaanxi Fundamental Science Research Project for Chemistry & Biology (No. 22JHQ070), and Key Laboratory of Myocardial Ischemia, Ministry of Education (No. KF202311).
Supplementary materials
Supplementary material associated with this article can be found, in the online version, at doi:10.1016/j.cclet.2025.111745.
Figure 2
(a) Absorption spectra of FL-O1 (10 µmol/L) in phosphate buffered saline (PBS) solution (10 mmol/L, pH 7.4, containing 20% DMSO) change as a function of DEA NONOate (at 0–180 µmol/L). (b) Fluorescence spectra of FL-O1 (10 µmol/L) change as a function of DEA NONOate (at 0–180 µmol/L). (c) Linearity of fluorescence intensity ratio I555 nm/I460 nm of FL-O1 versus the addition of concentrations of DEA NONOate (0–180 µmol/L). (d) Time-dependent fluorescence intensity ratio I555 nm/I460 nm of FL-O1 (10 µmol/L) in the presence of DEA NONOate (100 µmol/L). (e) The pH-dependent fluorescence intensity ratio I555 nm/I460 nm of FL-O1 (over the pH range 4.0–10.0). Data are presented as the mean ± S.D. (n = 3). (f) Selective response (A) and competing response (B) of FL-O1 to other species (100 µmol/L) in PBS solution (1. blank, 2. NO, 3. ONOO−, 4. NaNO3, 5. NaNO2, 6. HOCl, 7. H2O2, 8. TBO•, 9. •OH, 10. O2•−, 11. 1O2, 12. TBHP, 13. MgCl2, 14. CaCl2, 15. AlCl3, 16. NaCl, 17. Na2S, 18. Cys). λex1 = 385 nm, λex2 = 500 nm, slit: 2.5 nm/5 nm.
Figure 3
(a) Structured illumination microscopy (SIM) super-resolution images of HepG2 cells co-stained with FL-O1 and the LysoTracker Deep Red (70 nmol/L, λex = 640 nm, λem = 660–730 nm). Scale bar: 5 µm. Plots in the last column represent intensity of the linear region across the cell (white line in the previous column). (b) The processes of cell culture and imaging. (c) Representative confocal fluorescence imaging of A549 cells treated with FL-O1 (5 µmol/L, 30 min) and cells were respectively co-incubated with DEA NONOate (30 µmol/L, 60 µmol/L), HClO (60 µmol/L), H2O2 (60 µmol/L), ONOO− (60 µmol/L), pretreated with LPS (20 µg/mL), and pre-stimulated with LPS (20 µg/mL), L-NAME (10 µmol/L). Scale bar: 20 µm. (d) Thermal energy map of relative fluorescence intensity of FL-O1-stained A549 cells in the blue channel, red channel and the quantification of fluorescence intensity ratio IRed/IBlue (R/B) in each group. The blue channel: λex = 405 nm, λem = 420–470 nm. The red channel: λex = 488 nm, λem = 570–620 nm.
Figure 4
(a) The illustration of FL-O1-stained zebrafish imaging exogenous/endogenous NO. (b) Representative confocal fluorescence imaging of zebrafish treated with FL-O1 (10 µmol/L, 40 min) and cells were respectively co-incubated with DEA NONOate (60 µmol/L). (c–e) Relative fluorescence intensity of FL-O1-stained zebrafish imaging exogenous NO in the blue channel, red channel and the quantification of fluorescence intensity ratio R/B (IRed/IBlue) in each group. (f) Representative confocal fluorescence imaging of zebrafish pretreated with LPS (10 µg/mL), pretreated with LPS (10 µg/mL) and L-NAME (10 µmol/L). (g–i) Relative fluorescence intensity of FL-O1-stained zebrafish imaging endogenous NO in the blue channel, red channel and the quantification of fluorescence intensity ratio R/B (IRed/IBlue) in each group. The blue channel: λex = 405 nm, λem = 420–470 nm. The red channel: λex = 488 nm, λem = 570–620 nm. Scale bar: 400 µm. Data are presented as the mean ± S.D. (n = 3). **P < 0.01, ***P < 0.001.

 DownLoad:

 下载:
下载:


 下载:
下载:
