Figure 1.
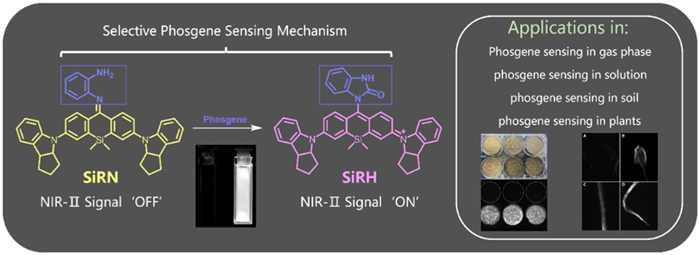
Proposed mechanism of SiRN for the selective detection of phosgene, and its applications.
High selective NIR-Ⅱ fluorescent probe for sensing phosgene in plants
Shuairu Wang , Dongsheng Lian , Chuyang Sun , Minghao Xu , Mingming Zhu , Chenxu Yan , Zhiqian Guo

Phosgene (COCl2) is a colorless and highly toxic gas [1–4]. Inhalation of phosgene can cause severe acute respiratory distress [5,6], including non-cardiogenic pulmonary edema, emphysema, and death [7,8]. Unlike chlorine, phosgene emits a deceptive "hay-like" scent (as described by Fries), often leading to misidentification and delayed recognition of exposure. With a density 3.5 times greater than air (the relative density is 3.5), it tends to accumulate in low-lying areas and dissipates slowly, increasing its environmental persistence. Phosgene is highly soluble in water and hydrolyzes to form hydrogen chloride. Once phosgene enters the soil or water, it can cause soil acidification, disrupt the balance of soil microorganisms, and reduce soil fertility. However, phosgene is still indispensable in industrial syntheses [9,10] (such as plastics, pharmaceuticals [11,12], and agrochemicals [13,14]). Therefore, phosgene indeed poses a serious threat to environmental safety, not only its potential use by terrorists but also its accidental release [15,16] in industrial accidents, leading to environmental pollution and harmful soil from phosgene leaks [17]. Therefore, it is urgent to monitor the leakage of phosgene in the environment.
Current detection methods including Raman spectroscopy [18], nuclear magnetic resonance [19,20], mass spectrometry [21], electrochemistry [22,23], gas chromatography [24,25], and HPLC [26] face limitations due to high costs, poor portability, and complex operations. Fluorescence technology [27–30], owing to high sensitivity, selectivity, and real-time monitoring capabilities [31,32], offers a promising alternative strategy for on-site screening. However, plants almost contain abundant auto-fluorescent molecules [33]. Chlorophyll can be excited by ultraviolet, blue, or green light and emits strongly in the red region, showing an obvious dual emission with peaks at 685 nm and 720–730 nm [34]. Cellulose in plants (with a maximum at 420–430 nm) can produce blue emission [35]. Some alkaloids (such as colchicine) and flavonoids in plants emit in the region (470–525 nm) [36]. The longer red fluorescence of plant cells may be due to anthocyanins [37], which have broad and variable auto-fluorescence. Indeed, all these endogenous auto-fluorescent molecules emitting across in the range of 400–800 nm bring undesirable interferences in bioimaging.
The near-infrared-Ⅱ (NIR-Ⅱ) emission (900–1700 nm) [38–44] has become a revolutionary tool for in vivo biological research, enabling higher signal-to-noise ratio (SNR) [45–48] with minimal scattering and autofluorescence in this region. Herein, we developed a NIR-Ⅱ fluorescent probe SiRN for phosgene detection, by integrating silicon rhodamine [49,50] as the fluorophore with o-phenylenediamine as a recognition group for selective sensing phosgene [51–57]. Our molecular design strategy is based on the following considerations (Fig. 1): Phosgene triggers the cyclization of o-phenylenediamine, resulting in a distinct color change (visible to the naked eye) and simultaneously activating NIR-Ⅱ fluorescence (900 nm), thus enabling portable qualitative and quantitative analysis. The probe SiRN exhibits high selectivity and sensitivity towards phosgene, with a low detection limit of 0.75 µmol/L. The probe SiRN shows a rapid response to gaseous phosgene, immediately generating a color change and turn-on NIR-Ⅱ fluorescence signal within 1 s. Notably, its NIR-Ⅱ fluorescence of SiRN effectively circumvents the interference from autofluorescence in plants, enabling direct visualization of phosgene in living plants, which is a crucial advancement for predicting crop toxicity and ensuring food security. We have further validated SiRN’s practicality for phosgene sensing in environmental samples such as gas, solution, soil, and plants. Thus, the probe SiRN shows great promise for applications in environmental surveillance, industrial safety, and sustainable pollutant management.
The synthetic route of SiRN is shown in Fig. S1 (Supporting information), which was obtained by SiNO reacting with o-phenylenediamine. First of all, we foucsed on the systematic characterisation of the fluorescence response of the SiRN probe with phosgene. In accordance with laboratory safety protocols, triphosgene (BTC) is utilised as a non-volatile and low-toxicity substitute for phosgene, as its capacity to generate equivalent phosgene. The proposed molecular recognition mechanism of SiRN’s response to phosgene is illustrated in Fig. 2A. Upon reaction with BTC, SiRN undergoes cyclization to form SiRH, restoring the conjugated structure of the silicon rhodamine scaffold. This structural transformation induces a significant wavelength change. The maximum emission wavelength redshifts to the NIR-Ⅱ region, accompanied by a distinct color change visible to the naked eye.
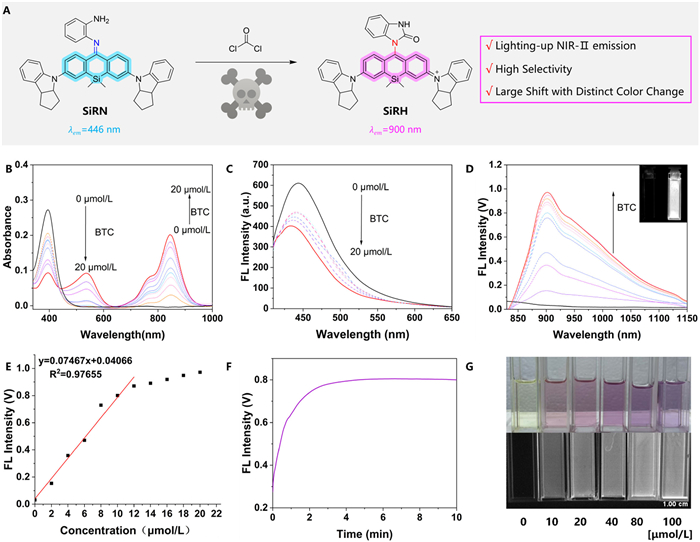
The UV–vis absorption spectra (Fig. 2B) show that in a chloroform system, SiRN exhibits a characteristic absorption peak at 400 nm. Subsequent to the addition of BTC, a novel absorption peak emerged at 846 nm. A comparison of the reaction of the SiRN probe with phosgene before and after the reaction reveals that its absorption peak has a redshift of 446 nm. As the concentration of BTC increases, the absorption peak at 400 nm gradually decreases, while the absorption peak at 846 nm gradually increases. When excited at 400 nm, the fluorescence intensity at 446 nm decreases as the concentration of BTC increases. When the excitation wavelength is 808 nm, the fluorescence at 900 nm increases as the concentration of BTC increases (Figs. 2C and D). The experimental data demonstrate that phosgene undergoes an acylation reaction with the amino group of SiRN, restoring the complete conjugated structure of the silicon rhodamine parent body, leading to a redshift of the maximum emission wavelength to the NIR-Ⅱ region. This phenomenon is accompanied by the appearance of fluorescence (insert of Fig. 2D). As is apparent from the evidence presented in Fig. 2G, the solution undergoes a change in color from light yellow to pink, enabling visual detection without the need for specialist equipment.
The response of SiRN to phosgene was investigated by measuring the emission intensity at 900 nm over time in the presence of BTC. It is evident that following the addition of BTC, there is an augmentation in the fluorescence intensity at 900 nm. The fluorescence intensity no longer changes at around 2 min (Fig. 2F), indicating that a complete response state is reached. The experimental results presented herein demonstrate that SiRN exhibits a rapid response to phosgene, a property that is advantageous for real-time imaging applications. The fluorescence intensity at 900 nm was measured after the reaction of SiRN with phosgene, with the concentration of BTC used as the abscissa and the fluorescence intensity as the ordinate. The resulting data were then subjected to linear regression analysis (Fig. 2E). The probe demonstrated remarkable sensitivity, exhibiting a calculated limit of detection (LOD) of 0.75 µmol/L (signal-to-noise ratio (SNR) = 3). This finding substantiates its capacity for the detection of trace amounts of phosgene.
Upon incremental addition of BTC to a SiRN solution (Fig. 2G), we observed a progressive deepening of the solution’s color accompanied by a concomitant enhancement of NIR-Ⅱ fluorescence intensity. This clear correlation between BTC concentration and both colorimetric and fluorescence responses underscores SiRN’s capability for naked eye phosgene detection in solution. Compared to existing probes (Table S1 in Supporting information), with maximum emissions below 800 nm, SiRN’s 900 nm emission affords markedly improved signal-to-noise ratio, making it especially well suited for in vivo applications. These features lay the groundwork for real‑time phosgene monitoring in biological systems.
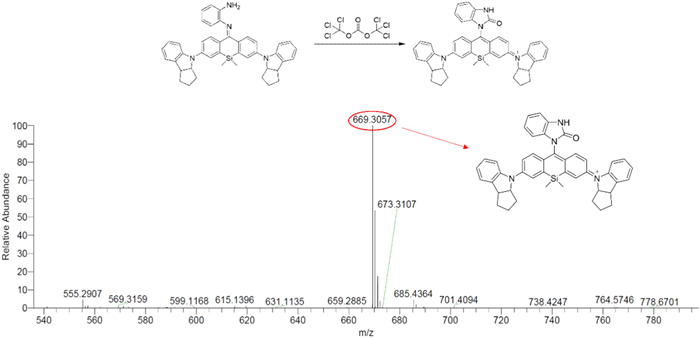
Next, we conclusively verified the reaction mechanism between SiRN and phosgene by high-resolution electrospray ionization mass spectrometry (HR-ESI-MS, positive ion mode) [58]. As shown in Fig. 3, the mass spectrum of the reaction between SiRN and phosgene evidently exhibited a prominent peak at m/z = 669.3057, in excellent agreement with the calculated value for the cyclized product for SiRH (calc. 669.3044). The result confirms that SiRN can react with phosgene to generate SiRH, converts the substituent of the central nitrogen atom into an electron-withdrawing group. This process serves to restore the conjugated structure of silicon rhodamine, resulting in a substantial increase in wavelength. The emission wavelength of SiRH is extended to the NIR-Ⅱ region.
To confirm the probe’s selectivity, we measured the NIR-Ⅱ fluorescence intensity at 900 nm after exposure to a panel of potential interferents, including NO donor (DEA NONOate), oxalyl chloride ((COCl)2), phosphorus oxychloride (POCl3), p-toluenesulfonyl chloride (TsCl), and thionyl chloride (SO2Cl2). NIR-Ⅱ imaging (Fig. 4A) revealed that only the sample containing two equivalents of BTC (a phosgene surrogate) exhibited a strong fluorescence signal at 900 nm. In order to verify this phenomenon, the fluorescence intensity at 900 nm following the addition of various analytes were measured. The results of the study demonstrated that only BTC treatment produced significant fluorescence enhancement, while all other analytes, even at five-fold higher concentrations, produced negligible signal changes compared to the untreated SiRN control (Fig. 4B). These results establish SiRN as a highly specific NIR-Ⅱ probe for phosgene detection. We also performed a photostability test on SiRN, using ICG (the FDA-approved contrast agent) as a reference compound. The absorbance half-life of SiRN is 3-fold that of ICG, indicating that it has satisfactory photostability (Fig. S20 in Supporting information).
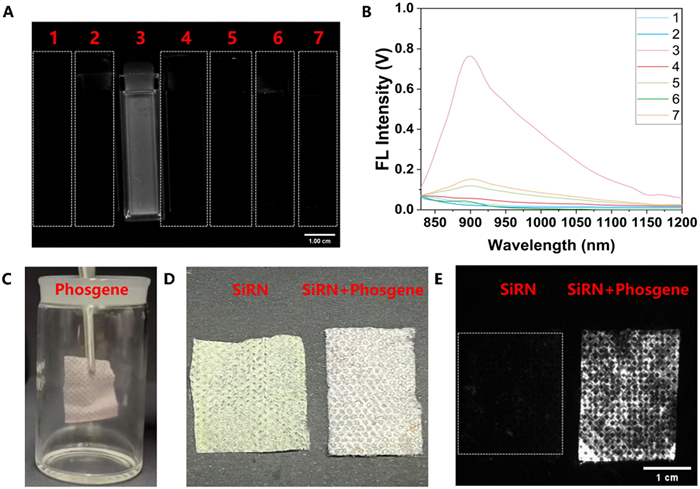
Building on SiRN’s high selectivity and sensitivity in solution, we next translated its performance to gas-phase detection. The non-woven fabric material has a high surface area and porosity, which enhances the interaction between the probe and the target analyte for improving the sensitivity and detection limit. In light of the aforementioned consideration, we fabricated SiRN-loaded test strips by treating face mask material with the probe solution. Subsequently, the material was exposed to phosgene, which was generated in situ from BTC-Et3N under sealed conditions (Fig. 4C). As demonstrated in Movie S1 (Supporting information), upon contact with phosgene, the test strip underwent an immediate (<1 s) colorimetric shift from pale yellow to pink, clearly visible to the naked eye the test strip immediately exhibited a distinct color change (Fig. 4D). Fluorescence imaging of the test strip before and after exposure to phosgene also showed that an obvious fluorescence signal was generated after contact with phosgene (Fig. 4E). Furthermore, as the concentration of phosgene increased, the fluorescence intensity increased as well (Fig. S21 in Supporting information). The high sensitivity and naked-eye readable of SiRN’s sensing of gaseous phosgene demonstrate that SiRN can be used for phosgene sensing in the gas phase.
Phosgene’s environmental impact extends beyond aqueous and atmospheric phases to soils and plants, where its high solubility and hydrolysis to HCl can acidify soils, disrupt microbial communities, and impair plant growth. There is therefore an urgent need for phosgene-responsive probes capable of operating in complex environmental matrices. Building on excellent performance of SiRN in the detection of phosgene in solutions and gases, we extended its application to real-time monitoring in complex environmental matrices, including diverse soil types and living plants. The sensing performance of SiRN for phosgene was verified in various soil samples, such as clay, sandy soil, and field soil. As illustrated in Fig. 5A, various soils have been treated with BTC at a concentration of 200 µmol/L. The SiRN solution was sprayed onto the soil surface and allowed to dry. Fluorescence imaging of the soil was performed using the MARS-FAST imaging system. As demonstrated in Fig. 5B, clay, sand, and field soil that had not been contaminated with BTC did not exhibit any fluorescence signals after the spraying of SiRN. In contrast, soils contaminated with BTC exhibited strong NIR-Ⅱ fluorescence, and the fluorescence intensity increased with rising BTC concentration (Fig. S22 in Supporting information). Thereby, this confirms the utility of SiRN for real-time, on-site phosgene detection in soil.
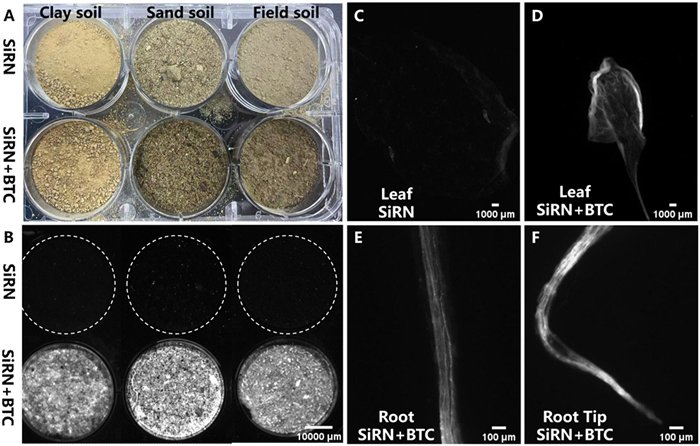
To overcome the challenge of plant autofluorescence, we attempted to use the NIR-Ⅱ fluorescent probe SiRN to detect phosgene in plants. The research object selected for this study was two-week-old Arabidopsis thaliana. As demonstrated in Fig. 5C, Arabidopsis thaliana exhibited no fluorescence signals when exposed exclusively to SiRN. However, after incubation with BTC, fluorescence signals rapidly appeared in the leaf (Fig. 5D), roots (Fig. 5E), and root tips (Fig. 5F) of Arabidopsis thaliana. The results of our preliminary in vivo plant imaging study indicate that SiRN has considerable potential for the real-time detection of phosgene in living plants. These results highlight broad applicability of SiRN for environmental protection, enabling sensitive, real-time phosgene detection across multiple critical matrices, solutions, gases, soils, and living plants, with minimal interference from complex sample backgrounds.
In summary, we have developed a novel silicon rhodamine-based NIR-Ⅱ fluorescent probe (SiRN) for the highly sensitive and selective detection of phosgene in solution, gas, soil, and plants. Notably, we utilize this probe to monitor phosgene in environmental samples and plants. The probe SiRN exhibits a distinct colorimetric change and a pronounced turn-on fluorescence response upon reaction with phosgene, with emission in the NIR-Ⅱ window. This enables real-time, naked-eye detection in both solution and gaseous states. Importantly, SiRN demonstrates excellent performance in complex environmental and biological matrices, including soil and living plants, with high signal-to-noise ratio and minimal interference from autofluorescence. The unique advantages of sensitivity, selectivity, and deep-tissue imaging capability afforded by NIR-Ⅱ emission establishes SiRN as a promising tool for monitoring phosgene in diverse settings. This work represents a significant advance in environmental toxicant detection and contributes to the broader goal of safeguarding environmental health through reliable chemical sensing.
The authors declare that they have no known competing financial interests or personal relationships that could have appeared to influence the work reported in this paper.
Shuairu Wang: Writing – original draft, Methodology, Data curation, Conceptualization. Dongsheng Lian: Methodology, Data curation. Chuyang Sun: Methodology, Data curation. Minghao Xu: Methodology, Data curation. Mingming Zhu: Writing – review & editing, Supervision, Methodology. Chenxu Yan: Methodology, Data curation. Zhiqian Guo: Writing – review & editing, Writing – original draft, Supervision, Conceptualization.
This work was supported by National Natural Science Foundation of China, China (Nos. 22225805, 32121005, 32394001, T2488302, and 22378122), Shanghai Science and Technology Innovation Action Plan (No. 23J21901600), Innovation Program of Shanghai Municipal Education Commission, and the Fundamental Research Funds for the Central Universities.
Supplementary material associated with this article can be found, in the online version, at doi:
C.B. Bast, D.F. Glass-Mattie, Phosgene, in: R.C. Gupta (Ed.), Handb. Toxicol. Chem. Warf. Agents, 3rd Ed., Academic Press, Boston, 2020, pp. 341–351.
T.C. Nicholson-Roberts, J. R. Army Med. Corps 165 (2019) 183–187. doi: 10.1136/jramc-2018-001072
E. Jones, War Hist. 21 (2014) 355–375. doi: 10.1177/0968344513510248
G.J. Fitzgerald, Am. J. Public Health 98 (2008) 611–625. doi: 10.2105/AJPH.2007.111930
W.W. Holmes, B.M. Keyser, D.C. Paradiso, et al., Toxicol. Lett. 244 (2016) 8–20. doi: 10.1016/j.toxlet.2015.10.010
Q. Lu, S. Huang, X. Meng, et al., Int. J. Mol. Sci. 22 (2021) 10933. doi: 10.3390/ijms222010933
G.G. Esposito, D. Lillian, G.E. Podolak, Anal. Chem. 49 (1977) 1774–1778. doi: 10.1021/ac50020a035
S.C. Gad, Phosgene, in: P. Wexler (Ed.), Encycl. Toxicol, 3rd Ed., Academic Press, Oxford, 2014, pp. 904–906.
S. Chauhan, S. Chauhan, R. D’Cruz, et al., Environ. Toxicol. Pharmacol. 26 (2008) 113–122. doi: 10.1016/j.etap.2008.03.003
H. Asahara, N. Takao, M. Moriguchi, T. Inoue, K. Ohkubo, Chem. Commun. 58 (2022) 6176–6179. doi: 10.1039/d2cc01336c
M.O. Ganiu, B. Nepal, J.P. Van Houten, R. Kartika, Tetrahedron 76 (2020) 131553. doi: 10.1016/j.tet.2020.131553
Á.M. Montaña, A. Corominas, J.F. Chesa, F. García, M. Font-Bardia, Eur. J. Org. Chem. 2016 (2016) 4674–4695. doi: 10.1002/ejoc.201600590
A.C. Chaskar, B.P. Bandgar, R.K. Modhave, A.B. Patil, S. Yewale, Synth. Commun. 39 (2009) 992–1001. doi: 10.1080/00397910802448481
T. Fukumura, W. Mori, M. Ogawa, M. Fujinaga, M.R. Zhang, Nucl. Med. Biol. 92 (2021) 138–148. doi: 10.1016/j.nucmedbio.2020.04.007
L. Chen, D. Jiang, J. Xia, J. Hazard. Mater. 56 (1997) 117–136. doi: 10.1016/S0304-3894(97)00033-2
L.S. Hardison, E. Wright, A.F. Pizon, J. Med. Toxicol. 10 (2014) 51–56. doi: 10.1007/s13181-013-0319-6
D. Noort, A.G. Hulst, A. Fidder, R.A. van Gurp, Chem. Res. Toxicol. 13 (2000) 719–726. doi: 10.1021/tx000022z
H. Gao, J. Wu, Y. Zhu, L. Guo, J. Xie, J. Raman Spectrosc. 47 (2015) 233–239.
T.J. Henderson, D.B. Cullinan, Magn. Reson. Chem. 45 (2007) 954–961. doi: 10.1002/mrc.2081
T.J. Henderson, Anal. Chem. 74 (2002) 191–198. doi: 10.1021/ac010809+
T. Kassebacher, P. Sulzer, S. Jürschik, et al., Rapid Commun. Mass Spectrom. 27 (2012) 325–332.
M. Davydova, A. Kromka, P. Exnar, et al., Phys. Status Solidi A 206 (2009) 2070–2073. doi: 10.1002/pssa.200982216
Y. Zhou, B. Yu, E. Shiu, K. Levon, Anal. Chem. 76 (2004) 2689–2693. doi: 10.1021/ac035072y
D.L. Ashley, M.A. Bonin, F.L. Cardinali, et al., Anal. Chem. 64 (1992) 1021–1029. doi: 10.1021/ac00033a011
M. Palit, D. Pardasani, A.K. Gupta, D.K. Dubey, Anal. Chem. 77 (2005) 711–717. doi: 10.1021/ac0486948
J.M. Bissinger, K.T. Rullo, J.T. Stoklosa, et al., J. Chromatogr. 268 (1983) 102–106. doi: 10.1016/S0021-9673(01)95393-2
L. Chen, D. Wu, J. Yoon, ACS Sens. 3 (2018) 27–43. doi: 10.1021/acssensors.7b00816
Q. Pang, F. Huo, Y. Yue, C. Yin, Chin. Chem. Lett. 36 (2025) 110713. doi: 10.1016/j.cclet.2024.110713
T. Liu, X. Han, X. Sun, et al., Chin. Chem. Lett. 36 (2025) 110170. doi: 10.1016/j.cclet.2024.110170
B. Zhu, R. Sheng, T. Chen, J. Rodrigues, L. Zeng, Coord. Chem. Rev. 463 (2022) 214527. doi: 10.1016/j.ccr.2022.214527
B. Zhu, X. Yang, L. Jiang, et al., Chin. Chem. Lett. 36 (2025) 110222. doi: 10.1016/j.cclet.2024.110222
D. Tian, Y. Cao, X. Zeng, X. Ma, J. Yin, Chin. Chem. Lett. (2025), doi: 10.1016/j.cclet.2025.110978
L. Donaldson, Molecules 25 (2020) 2393. doi: 10.3390/molecules25102393
J.J. Lamb, G. Røkke, M.F. Hohmann-Marriott, Photosynthetica 56 (2018) 105–124. doi: 10.1007/s11099-018-0791-y
C. Pohlker, J.A. Huffman, U. Poschl, Atmos Meas Tech 5 (2012) 37–71. doi: 10.5194/amt-5-37-2012
O. Monago-Maraña, I. Durán-Merás, T. Galeano-Díaz, Food Chem. 196 (2016) 1058–1065. doi: 10.1016/j.foodchem.2015.10.041
A. Chanoca, B. Burkel, N. Kovinich, E. Grotewold, K.W. Eliceiri, Plant J. 88 (2016) 895–903. doi: 10.1111/tpj.13297
J.H. Zhu, L. Luo, M. Gu, et al., CCS Chem. 7 (2025) 1552–1566. doi: 10.31635/ccschem.025.202505461
W. Hu, L. Chai, T.D. James, et al., Sens. Actuators B: Chem. 422 (2025) 136509. doi: 10.1016/j.snb.2024.136509
Q. Xu, W.H. Zhu, Z. Guo, et al., Chem. Sci. 14 (2023) 4091–4101. doi: 10.1039/d3sc00193h
J. Huang, Y. Yao, L. Zhang, C. Yan, Z. Guo, Smart Mol 2 (2024) e20240020. doi: 10.1002/smo.20240020
X. Fu, Z. Guo, W.H. Zhu, et al., Sci. China Chem. 68 (2025) 4497–4506. doi: 10.1007/s11426-024-2559-1
H. Si, D. Wang, X. Du, X. Zhou, Chin. Chem. Lett. 35 (2024) 108595. doi: 10.1016/j.cclet.2023.108595
Z. Jiang, Y. Du, Z. Dang, et al., Chin. Chem. Lett. 37 (2026) 111351. doi: 10.1016/j.cclet.2025.111351
Y. Zhang, J. Li, W. -H. Zhu, Z. Guo, Sci. China Chem. 68 (2025) 26–34. doi: 10.1007/s11426-024-2143-0
L. Zhang, W.H. Zhu, Z. Guo, et al., Chem. Commun. 59 (2023) 8388–8391. doi: 10.1039/d3cc01742g
X. Zhang, F. Yang, X. Zhao, et al., Angew. Chem. Int. Ed. 63 (2024) e202410666.
X. Song, W. Hu, T.D. James, et al., Sens. Actuators B: Chem. 422 (2025) 136566. doi: 10.1016/j.snb.2024.136566
L. Zhang, S. Chen, L. Shi, et al., Adv. Funct. Mater. 35 (2024) 2412595.
K. Li, C. He, T. Zhang, et al., Chem. Commun. 61 (2025) 11041–11044. doi: 10.1039/d5cc01871d
X. Zhou, S. Lee, Z. Xu, J. Yoon, Chem. Rev. 115 (2015) 7944–8000. doi: 10.1021/cr500567r
Y. Hu, X. Zhou, J. Yoon, et al., Anal. Chem. 90 (2018) 3382–3386. doi: 10.1021/acs.analchem.7b05011
D. Zhang, L. Wang, X. Yuan, et al., Angew. Chem. 132 (2020) 705–709. doi: 10.1002/ange.201911113
J. Tang, Z. Guo, Y. Zhang, B. Bai, W.H. Zhu, Chem. Commun. 53 (2017) 10520–10523. doi: 10.1039/C7CC05971J
Z. Xu, J. Chen, L.L. Hu, et al., Chin. Chem. Lett. 28 (2017) 1935–1942. doi: 10.1016/j.cclet.2017.07.018
X. Zhou, Y. Zeng, C. Liyan, X. Wu, J. Yoon, Angew. Chem. 128 (2016) 4807–4811. doi: 10.1002/ange.201601346
Y. Zhang, K. Liu, Z. Liu, et al., Sensors 25 (2025) 407. doi: 10.3390/s25020407
W. Gao, C. Wang, X. Yu, Y. Yang, Spectrochim. Acta A: Mol. Biomol. Spectrosc. 329 (2025) 125515. doi: 10.1016/j.saa.2024.125515

Figure 1 Proposed mechanism of SiRN for the selective detection of phosgene, and its applications.

Figure 2 Spectral measurements of SiRN response to phosgene and phosgene sensing in solution. (A) Schematic diagram of the response mechanism of SiRN to phosgene and its advantages. The absorption spectra (B) of SiRN (10 µmol/L) in chloroform in response to different equivalents of BTC (0–2 equiv.), and the fluorescence spectra at λex = 400 nm (C) and λex = 808 nm (D). (E) Linear plot between concentration of BTC and emission intensity, excitation at 808 nm. (F) Time dependent spectra of SiRN in chloroform solution (10 µmol/L) after adding a chloroform solution of BTC (2 equiv.). (G) The color observed by the naked eye and fluorescence changes after the probe responds to different concentrations of BTC.

Figure 3 The high-resolution mass spectrum of SiRN after reacting with 2 equiv. of BTC.

Figure 4 Selectivity towards phosgene of SiRN and phosgene sensing in gas phase. (A) Fluorescence images of SiRN (10 µmol/L) after reacting with BTC (20 µmol/L) and other analytes (100 µmol/L) in chloroform. (B) Fluorescence spectra of SiRN with an excitation wavelength of 808 nm after reacting with BTC (20 µmol/L) and other analytes (100 µmol/L). 1. Blank; 2. NO donor (DEA NONOate); 3. BTC; 4. (COCl)2; 5. POCl3; 6. TsCl; 7. SO2Cl2. (C) Schematic diagram of SiRN for detecting gaseous phosgene. Images of the non-woven fabric treated with SiRN before (left) and after (right) exposure to phosgene for 10 s, observed by the naked eye (D) and fluorescence imaging under excitation wavelength of 808 nm (E).

Figure 5 Phosgene sensing in soil and plants. Image of unpolluted (upper figure) and BTC-polluted (lower figure) clay, sand, and field soil after spraying SiRN, observed by the naked eye (A) and fluorescence imaging under an excitation wavelength of 808 nm (B). Fluorescence imaging of the leaves (C) of Arabidopsis thaliana incubated only with SiRN (10 µmol/L). Fluorescence imaging of the leaves (D), root (E), and root tip (F) of Arabidopsis thaliana incubated with SiRN and BTC (5 equiv.).

 扫一扫看文章

扫一扫关注我们
 DownLoad:
 下载:
下载:
 下载:
下载: