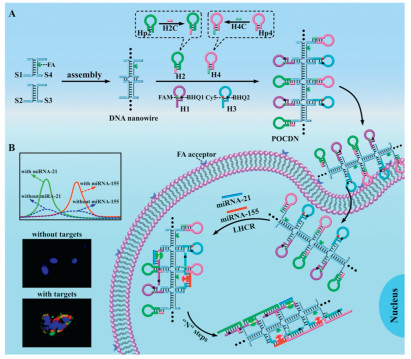
Scheme 1.
(A) Schematic diagram of the integration of the POCDN and (B) the illustration of the LHCR for detection and visualization of miR-21 and miR-155 in cancer cells.
A periodically ordered cruciform DNA nanowire guided-localized HCR for simultaneous and rapid detection and imaging of dual-microRNAs
Hongmin Lei , Jie Zhou , Yichen Han , Yaqin Chai , Ruo Yuan

MicroRNAs (miRNAs) play an important role in the onset and progression of a variety of diseases [1-4], therefore, accurate and rapid detection and visualization of miRNAs expression levels are essential for in-depth study of their function [5-9]. With the development of technology, emerging techniques for miRNA detection and imaging based on nucleic acid amplification such as rolling circle amplification (RCA) [10,11], hybridization chain reaction (HCR) [12-15] and catalytic hairpin self-assembly (CHA) [16,17] have been developed. These emerging detection methods have enhanced the precision and selectivity in miRNA detection, but there are still some problems. For example, RCA necessitates specific enzymes and conditions [18], while the kinetics of HCR and CHA depend on the diffusion of free DNA hairpin probes, resulting in a particularly slow reaction rate [19-21]. Recently, some researchers have proposed to utilize framework nucleic acids as carriers for the reaction probes to concentrate the reactants in a compact space, thereby increasing the local concentration of DNA reactants, accelerating the reaction rate and improving the dynamic efficiency [22-28]. However, some DNA nanostructures such as cubes and tetrahedrons have limited sites that can bind to the reactant probes, which restricts the further improvement of the reaction performance. To tackle the problem of limited loading capacity, existing researches have confirmed that by using DNA nanowires as scaffolds to fix hairpin probes on a large scale, it is possible to achieve orderly spacing of the probes and significantly shorten the distance between them, thereby improving detection sensitivity [29-33]. Nevertheless, the reaction efficiency still needs to be further improved.
Herein, a periodically ordered cruciform DNA nanowire (POCDN) guided-localized hybridization chain reaction (LHCR) was developed for simultaneous sensitive and rapid detection and visualization of dual-miRNAs in cancerous cells (Scheme 1). First, the DNA nanowire was composed of two double strand DNA (dsDNA) (S1/S4, S2/S3) helices, one of which was single-stranded labelled with folic acid (FA) specifically targeting cancer cells. Then, four reaction probes (hairpin H1 labelled with FAM and BHQ1, H2 formed by the hybridization reaction of hairpin Hp2 and short single strand DNA (ssDNA) H2C, hairpin H3 labelled with Cy5 and BHQ2, and H4 formed by hybridization reaction of hairpin Hp4 and short ssDNA H4C) were vertically anchored as structurally rigid units on the DNA nanowire through base complementary pairing to form POCDN. After that, when the receptor FRα binds to FA molecules labelled on DNA nanowires, it induces the receptor-ligand complex to aggregate on the cell membrane surface, thereby promoting the delivery of POCDN into the cell through receptor-mediated endocytosis. Finally, the intracellular targets miRNA-21 (miR-21) and miRNA-155 (miR-155) acted as initiators, triggering two independent LHCR along the DNA nanowire, and the red and green fluorescence instantly lighted up the entire POCDN with two remarkably amplified signal gain, achieving simultaneous sensitive and rapid detection. Furthermore, the proposed DNA nanostructure enabled precise and sensitive imaging of intracellular dual-miRNAs without the liposome transfection. Hence, the proposed strategy provides an effective and promising nanoplatform for simultaneous sensitive detection and visualization of multiple biomarkers, which has potential as a powerful tool for bioanalytical studies and clinical diagnosis.
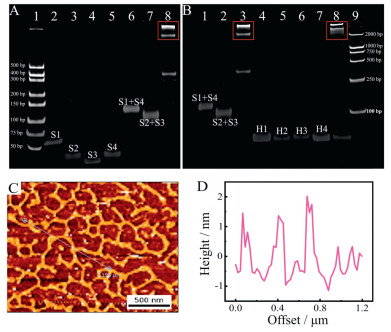
The prepared nanostructures were characterized by 8% native polyacrylamide gel electrophoresis (PAGE) analysis. Firstly, the assembly of the DNA nanowire was verified, and after mixed incubation of S1 and S3 with S4 and S2, new bands with 100–150 bp mobility appeared (Fig. 1A, lanes 6 and 7). Then, when the short ds DNA S1/S4 and S2/S4 were incubated together, the bands representing S1/S4 and S2/S3 disappeared, while new band with lower mobility appeared (Fig. 1A, lane 8), demonstrating the successful assembly of the DNA nanowire. Finally, after incubation with the addition of hairpins H1, H2, H3 and H4, the bands representing H1, H2, H3 and H4 disappeared and new band with lower mobility than DNA nanowire appeared (Fig. 1B, lane 8), which demonstrated the successful formation of POCDN. Furthermore, the configuration of POCDN was analyzed using atomic force microscopy (AFM), the AFM image of POCDN revealed a dispersed linear structure with no obvious entanglement and good dispersion, exhibiting high rigidity and low bending curvature. Cross-sectional analysis showed an average height of approximately 2 nm, which is consistent with the theoretical diameter of dsDNA (Figs. 1C and D).
In addition, the stability of POCDN in serum was assessed by monitoring the recovery of H1- and H3-derived fluorescence (FAM and Cy5, respectively) after incubating POCDN in a 10% fetal bovine serum (FBS) reaction buffer for 12 h. POCDN exhibited significantly reduced fluorescence recovery compared to free probes (Fig. S1 in Supporting information), suggesting that POCDN effectively protected H1 and H3 from nuclease degradation during intracellular delivery.
The feasibility of the miR-21 and miR-155 targeted to induce HCR was characterized by 8% PAGE. First, the feasibility of triggering HCR by the target miR-21 was verified in a solution containing free H1 and Hp2. After incubation of miR-21 with a mixture of H1 and Hp2, the bands corresponding to H1 and Hp2 disappeared along with the appearance of typical low-mobility HCR product bands (lane 4 in Fig. S2B in Supporting information), indicating the successful performance of miR-21 targeted-HCR in a solution. Similarly, the successful miR-155 targeted-HCR also exhibited typical low-mobility HCR product bands in the PAGE plot (Fig. S2C in Supporting information, lane 4).
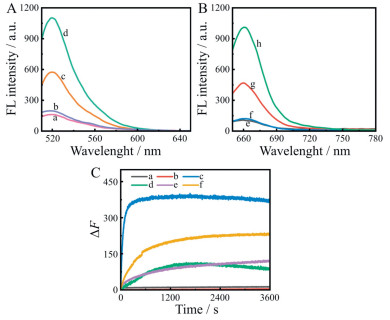
Next, the feasibility of simultaneously detecting miR-21 and miR-155 using LHCR was investigated using fluorescence emission spectroscopy. In Figs. 2A and B, curves a, b, e and f illustrated that the HCR and LHCR systems demonstrated minimal fluorescence background levels when devoid of miR-21 and miR-155. As depicted in Figs. 2A and B, curves c, d, g, h, the fluorescence signal of the LHCR system was much higher than that of the HCR system when miR-21 and miR-155 coexisted, indicating that the LHCR system had higher sensitivity than the traditional HCR system. In addition, real-time fluorescence spectroscopy was used to investigate the reaction kinetics of HCR in solution and LHCR in POCDN. By monitoring the recovery of Cy5 fluorescence signals after probe H3 was activated by 100 nmol/L miR-155 under different conditions, as shown in Fig. 2C, the real-time fluorescence curve of POCDN exhibited rapid fluorescence intensity (curve c) and reached saturation at 300 s, with a reaction time significantly shorter than that reported in previous studies on similar LHCR and localized catalyzed hairpin assembly (LCHA) systems [29,31,34-36]. In the absence of the target miR-155, the real-time fluorescence curves of the HCR and LHCR systems remain largely unchanged over time (Fig. 2C, curves a and b). As shown in Fig. 2C, the traditional HCR (curve d) and unassembled DNA probes triggered by the target miR-155 (curve e) in solutions exhibited similar real-time fluorescence curves, with a smaller increase in fluorescence intensity, and the fluorescence intensity approached saturation at 1600 s. Similarly, the real-time fluorescence spectra of the unassembled probes triggered by the target miR-21 (curve f) also showed slow growth. Additionally, we obtained the reaction rate curves shown in Fig. S3 (Supporting information) by performing the first derivative of the fluorescence intensities of LHCR and HCR (curves c and d) depicted in Fig. 2C. The reaction rate of the POCDN-guided LHCR we designed was extremely high in the first 150 s and then became very low (Fig. S3, curve a). In contrast, the reaction rate and overall efficiency of traditional HCR in solution were relatively low (Fig. S3, curve b). These results suggested that POCDN-guided LHCR was significantly more efficient and faster than traditional HCR, as DNA nanowires concentrated reaction probes in a compact space.
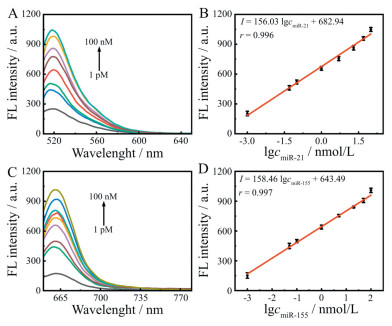
To evaluate the amplification efficiency of LHCR for detecting miR-21 and miR-155 in vitro, the traditional HCR system was selected as a control, and the fluorescence spectra of LHCR and HCR systems were determined when various concentrations of targets miR-21 and miR-155 were present. The results were shown in Fig. 3, for the LHCR strategy, a standard curve F = 156.03 lgcmiR-21+682.94 with a coefficient of 0.994 was plotted in the range of miR-21 concentrations from 1 pmol/L to 100 nmol/L, and a standard curve F = 158.46 lgcmiR-155+643.49 with a coefficient of 0.997 in the range of miR-155 concentrations from 1 pmol/L to 100 nmol/L. The limits of detection (LOD) calculated according to the 3δ method were 0.97 and 0.58 pmol/L for miR-21 and miR-155, respectively. For the traditional HCR strategy (Fig. S4 in Supporting information), a standard curve F = 114.15 lgcmiR-21+306.40 with a coefficient of 0.975 was plotted in the miR-21 concentration range from 100 pmol/L to 100 nmol/L, and a standard curve F = 112.28 lgcmiR-155+214.16 with a coefficient of 0.994 in the miR-155 concentration range from 100 pmol/L to 100 nmol/L. The LODs for miRNA-21 and miRNA-155 were calculated as 89 and 93 pmol/L, respectively. In contrast, LHCR has at least 67.4-fold lower LODs than HCR systems. These results demonstrated that the developed LHCR method can perform simultaneous high-sensitivity analysis of dual miRNAs in vitro. Moreover, some dual-targets detection methods in recent years have been compared, as shown in Table S2 (Supporting information), and the proposed LHCR exhibited a wide linear range and low LODs.
We investigated the specificity of POCDN by selecting a range of common miRNAs, miR-16, miR-221, and miR-222, for comparison. As shown in Fig. S5 (Supporting information), the fluorescence intensities of all interfering miRNAs (100 nmol/L) were similar to those of the blank control group, showing a very low fluorescence signal response. In contrast, significant and similar fluorescence-enhancing signals were observed when the proposed POCDN was incubated with a mixture containing the targets miR-21 and miR-155 (20 nmol/L) and miR-21 and miR-155 alone, respectively. This indicated that the proposed LHCR strategy had excellent specificity and could effectively distinguish between target miRNAs and other interfering miRNAs.
To further assess POCDN's selectivity for dual targets miR-21 and miR-155, control sequences including single- and double-base mismatches were tested. As shown in Fig. S6 (Supporting information), incubation of POCDN with 100 nmol/L mismatched variants (single/double-base mismatched miR-21 or miR-155) yielded minimal fluorescence signals. In contrast, significantly enhanced signals were observed with perfectly matched targets at 20 nmol/L. Notably, POCDN maintained high specificity even when detecting mixtures containing both targets and mismatched sequences, demonstrating robust discriminative capability against non-specific binding.
The practical utility of the LHCR system was confirmed using lysates from MCF-7 and HeLa cells. Figs. S7A and B (Supporting information) showed that increasing cell numbers led to significantly higher Cy5 fluorescence, indicative of elevated miR-155 expression in both cell lines. Furthermore, FAM fluorescence surged substantially with cell number in MCF-7 cells, but only increased gradually in HeLa cells, demonstrating higher miR-21 expression in MCF-7 cells. These findings, consistent with prior reports [37-39], validate POCDN's capability to simultaneously distinguish the differential expression levels of miR-155 and miR-21 in complex biological samples.
First, the feasibility of imaging of intracellular dual-miRNAs using LHCR was carried out on HeLa and MCF-10A (normal mammary epithelial cells) cells, and the specificity of POCDN intracellular delivery mediated via FA receptor-mediated endocytosis was verified. As exhibited in Fig. S8 (Supporting information), there was little fluorescence observed in MCF-10A cell imaging, HeLa cell imaging showed significant green and red fluorescence, and very faint green and red fluorescence was observed in HeLa cell imaging after prior treatment with FA. These results suggested that POCDN could be accurately identified and specifically delivered to cancer cells.
In addition, MCF-7 cells exhibiting elevated levels of miR-21 and miR-155 and HeLa cells with low levels of miR-21 and extremely overexpressed levels of miR-155 were selected to demonstrate the feasibility of POCDN guided-LHCR in enabling concurrent and precise fluorescence imaging of intracellular dual-miRNAs. The results depicted in Fig. 4–1 revealed conspicuous red fluorescence in MCF-7 and HeLa cells imaging, along with clear green fluorescence in MCF-7 cells and faint green fluorescence in HeLa cells. This pointed to a comparable expression of miR-155 in both cell types, while miR-21 levels were notably lower in HeLa cells, corroborating findings from cell lysis experiments. In a control experiment utilizing conventional HCR methods, fluorescence imaging in MCF-7 and HeLa cells was relatively weak compared to the LHCR approach (Fig. 4–2), indicating higher amplification efficiency with the LHCR-based strategy.
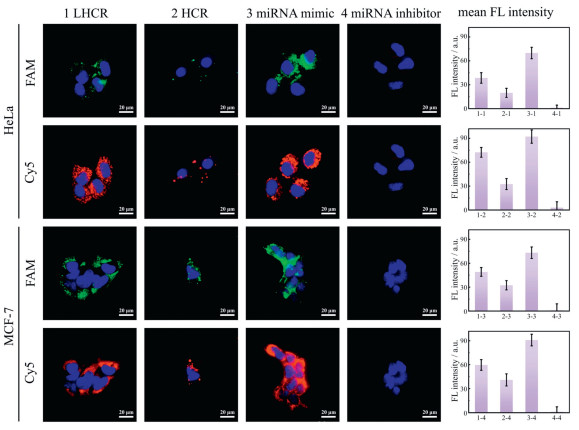
The specificity of the LHCR-based strategy targeting dual-miRNAs was confirmed by a range of cell-based experiments. In particular, the use of miR-155 and miR-21 mimics resulted in a notable augmentation in red and green fluorescence in HeLa and MCF-7 cells, as shown in Fig. 4–3. Conversely, minimal fluorescence response was observed in cells treated with miR-21 and miR-155 inhibitors (Fig. 4–4). These results fully illustrated the remarkable sensitivity of the LHCR strategy based on the differential expression levels of miRNAs in living cells. This further demonstrated that the LHCR-based strategy could achieve ultrasensitive imaging of miR-21 and miR-155 simultaneously, allowing for more effective differentiation between normal and tumor cells.
In summary, we have successfully developed POCDNs guided-localized HCR for simultaneous sensitive and rapid detection and visualization of dual miRNAs within living cells. Impressively, FA labelled on the structural backbone of DNA nanowires could be specifically targeted to malignant tumor cells overexpressing the folate receptor, which greatly improved the efficiency of delivery into the cell and enabled precise imaging of intracellular miRNAs without the liposomal transfection. Compared with the traditional HCR, the POCDN-induced LHCR confined the reactants in a compact space, which greatly improved the sensitivity and reaction rate of the assay, with a 5.3-fold shorter reaction time of only 5 min, and the detection limit was at least 67.4-fold lower, with the LODs as low as 0.97 and 0.58 pmol/L for miR-21 and miR-155, respectively. Therefore, this innovative approach not only presents a promising nanoplatform for the sensitive detection and visualization of multiple biomarkers simultaneously, but also holds considerable potential as a robust tool for bioanalysis and clinical diagnostics.
The authors declare that they have no known competing financial interests or personal relationships that could have appeared to influence the work reported in this paper.
Hongmin Lei: Writing – original draft, Methodology, Investigation, Formal analysis, Data curation, Conceptualization. Jie Zhou: Methodology, Conceptualization. Yichen Han: Methodology, Conceptualization. Yaqin Chai: Supervision, Resources, Funding acquisition. Ruo Yuan: Writing – review & editing, Supervision, Resources, Funding acquisition.
This work was financially supported by National Natural Science Foundation of China (Nos. 22374122, 22476161, 22174113, 22176153).
Supplementary material associated with this article can be
found, in the online version, at doi:
D.P. Bartel, Cell 173 (2018) 20–51.
J.K. Cheong, Y.C. Tang, L. Zhou, Curr. Opin. Biotechnol. 74 (2022) 256–262. doi: 10.1016/j.copbio.2021.12.007
H. Yang, D. Chen, Y. Zhang, et al., Anal. Chem. 96 (2024) 4154–4162. doi: 10.1021/acs.analchem.3c05085
C.A. Brosnan, A.J. Palmer, S. Zuryn, Nat. Commun. 12 (2021) 2194. doi: 10.1038/s41467-021-22503-7
F. Yang, S. Li, X. Li, et al., Anal. Chem. 94 (2022) 16079–16085. doi: 10.1021/acs.analchem.2c03217
P. Yin, M. Ge, S. Xie, et al., Chem. Sci. 14 (2023) 14131–14139. doi: 10.1039/d3sc04957d
X. Gong, J. Zhang, P. Zhang, et al., Anal. Chem. 95 (2023) 18731–18738. doi: 10.1021/acs.analchem.3c02822
X. Gao, L. Feng, R. Deng, et al., Interdiscip. Med. 2 (2024) e20230033. doi: 10.1002/INMD.20230033
Y. Zhu, W. Li, F. Lan, et al., Interdiscip. Med. 2 (2024) e20230043. doi: 10.1002/INMD.20230043
C. Liu, Z. Huang, Z. Li, et al., Anal. Chim. Acta 1343 (2025) 343689. doi: 10.1016/j.aca.2025.343689
X. Wei, M. Ye, H. Jia, et al., Biosens. Bioelectron. 271 (2025) 116975. doi: 10.1016/j.bios.2024.116975
J. Su, T. Liu, M. Wang, et al., Anal. Chim. Acta 1334 (2025) 343419. doi: 10.1016/j.aca.2024.343419
M. Li, H. Chen, Y. Zhang, et al., Anal. Chim. Acta 1344 (2025) 343712.
C. Fan, L. Xie, F. Zhao, et al., Anal. Chim. Acta 1288 (2024) 342172. doi: 10.1016/j.aca.2023.342172
M. Huang, R. Cheng, S. Wen, et al., Chin. Chem. Lett. 35 (2024) 109379.
H. He, X. Zhang, M. Deng, et al., Anal. Chim. Acta 1335 (2025) 343457. doi: 10.1016/j.aca.2024.343457
N. Afshan, T. Cheng, J. Yu, et al., Anal. Chim. Acta 1352 (2025) 343925. doi: 10.1016/j.aca.2025.343925
W. Wang, Q. Ge, X. Zhao, TrAC Trends Anal. Chem. 160 (2023) 116960.
P. Dong, R. Li, S. He, et al., Chem. Sci. 14 (2023) 2159–2167. doi: 10.1039/d2sc05568f
H. Wang, Y. Chen, Y. Jiang, et al., Anal. Chem. 96 (2024) 12854–12861. doi: 10.1021/acs.analchem.4c02570
M. Sun, Q. Zhou, J. Peng, et al., Anal. Chem. 96 (2024), 9078–9087. doi: 10.1021/acs.analchem.4c00594
M. Zhang, Y. Zhang, X. Zhang, et al., Anal. Chem. 96 (2024) 10084–10091. doi: 10.1021/acs.analchem.4c02076
X.Q. Li, Y.L. Jia, Z.X. Wang, et al., Adv. Funct. Mater. 34 (2024) 2401711.
M.K. Xin, X. Sun, H.W. Tang, et al., Anal. Chem. 96 (2024) 7101–7110. doi: 10.1021/acs.analchem.4c00473
L.L. Li, F. Cheng, J. Li, et al., Anal. Chem. 95 (2023) 10992–10998. doi: 10.1021/acs.analchem.3c01117
M. Yu, Y. Zhang, M. Zhang, et al., ACS Sens. 9 (2024) 5302–5311. doi: 10.1021/acssensors.4c01493
K. Wang, Y. Wang, L. Wang, et al., Chin. Chem. Lett. 36 (2025) 109868.
J. Xu, W. Zhang, Z. Cai, et al., Chin. Chem. Lett. 35 (2024) 109620.
Q. Wei, J. Huang, J. Li, et al., Chem. Sci. 9 (2018) 7802–7808. doi: 10.1039/c8sc02943a
Z. Yang, B. Liu, T. Huang, et al., Chem. Sci. 13 (2022) 14373–14381. doi: 10.1039/d2sc05890a
X. Zhu, B. Qu, Z.M. Ying, et al., Anal. Chem. 92 (2020) 15953–15958. doi: 10.1021/acs.analchem.0c03400
Y. Yang, Y. He, Z. Deng, et al., ACS Appl. Bio. Mater. 3 (2020) 6310–6318. doi: 10.1021/acsabm.0c00777
J. Jiao, Y. Xiang, C. Duan, et al., Anal. Chem. 92 (2020) 12394–12399. doi: 10.1021/acs.analchem.0c02146
K. Ren, Y. Xu, Y. Liu, et al., ACS Nano 12 (2018) 263–271. doi: 10.1021/acsnano.7b06200
Y. Zhang, Y. Wu, S. Luo, et al., ACS Sens. 7 (2022) 1075–1085. doi: 10.1021/acssensors.1c02717
S. Liu, J. Wang, Y. Chen, et al., Nano Lett. 24 (2024) 11590–11598.
Y. Han, J. Zhou, F. Liu, et al., Anal. Chem. 95 (2023) 12754–12760. doi: 10.1021/acs.analchem.3c01470
C. Xu, S. Chen, S. Hu, et al., Anal. Chem. 95 (2023) 11061–11069. doi: 10.1021/acs.analchem.3c01335
J.H. Li, J.L. Liu, X.L. Zhang, et al., Anal. Chem. 95 (2023) 4131–4137. doi: 10.1021/acs.analchem.2c05116

Scheme 1 (A) Schematic diagram of the integration of the POCDN and (B) the illustration of the LHCR for detection and visualization of miR-21 and miR-155 in cancer cells.

Figure 1 (A) Lanes 1−8 represented DNA marker, S1, S2, S3, S4, S1+S4, S2+S3, S1+S2+S3+S4, respectively. (B) Lanes 1−9 represented S1+S4, S2+S3, S1+S2+S3+S4, H1, H2, H3, H4, S1+S2+S3+S4+H1+H2+H3+H4, DNA marker, respectively. (C) AFM image of POCDN and (D) the cross-sectional analysis of the white line.

Figure 2 (A, B) Fluorescence emission spectra of miR-21 and miR-155 were detected under different experimental conditions. (a) H1+H2, (b) POCDN, (c) H1+H2+miR-21, (d) POCDN+miR-21, (e) H3+H4, (f) POCDN, (g) H3+H4+miR-155, (h) POCDN+miR-155. (C) Real-time fluorescence curves of miR-155 under different experimental conditions, (a) POCDN, (b) H3+H4, (c) POCDN+miR-155, (d) H3+H4+miR-155, (e) S1+S2+S3+S4+H1+H2+H3+H4+miR-155, (f) S1+S2+S3+S4+H1+H2+H3+H4+miR-21. The ΔF is the relative fluorescence intensity (ΔF = F−F0), in which F represented the real-time fluorescence intensity, and F0 represented the initial fluorescence (t = 0).

Figure 3 Fluorescence intensity response of LHCR in POCDN to different concentrations (1 pmol/L, 50 pmol/L, 100 pmol/L, 1 nmol/L, 5 nmol/L, 20 nmol/L, 50 nmol/L and 100 nmol/L) of miR-21 (A) and miR-155 (C). Calibration curves between fluorescence intensity and the log concentration of target miR-21 (B) and miR-155 (D). Data are presented as mean ± standard deviation (SD) (n = 3).

Figure 4 Fluorescence imaging of HeLa and MCF-7 cells cultured with POCDN (1), H1, H2, H3 and H4 (2). Fluorescence imaging of HeLa and MCF-7 cells treated with miR-21 miR-155 mimics (3), miR-21 miR-155 inhibitors (4), followed by culture with the POCDN. The nucleus is shown in blue, the FAM fluorophore corresponding to miR-21 in green and the Cy5 fluorophore corresponding to miR-155 in red.

 扫一扫看文章

扫一扫关注我们
 DownLoad:
 下载:
下载:
 下载:
下载: