Scheme 1.
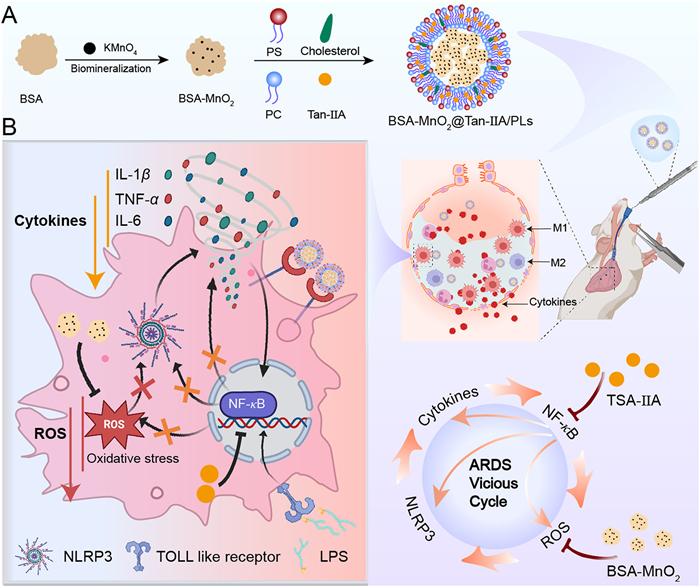
(A) Fabrication illustration of the BMTPLs. (B) Schematic illustration of the efferocytosis-informed BMTPLs NPs breaking the vicious cycle and remodeling the malignant inflammatory microenvironment.
Break the vicious cycle and remodel the malignant inflammatory microenvironment in ARDS with efferocytosis-informed nanodrugs
Yikun Chen , Wenling Li , Juan Cao , Yongjun Wang , Yufang Guo , Liu Qing , Li Wang , Sisi Yu , Lei Xing , Hulin Jiang , Bing Wan

Acute respiratory distress syndrome (ARDS) is an inflammatory disorder syndrome caused by various invasions that induce acute and diffuse lung dysfunction [1]. ARDS treatments remain primarily supportive with significant mortality rates as high as 30%–40% [2]. Unregulated production of pro-inflammatory mediators as well as excessive reactive oxygen species (ROS) generation are hallmarks of the pathogenesis of ARDS, which lead to lung injury and eventually result in respiratory failure [3–5]. Many innovative approaches, such as antioxidants [6], nano-enzymes [7–9], enzyme mimics [10] and biological enzyme molecules [11] have been given to clear ROS. Meanwhile, some anti-inflammatory pathways have recently been found and researched to inhibit the release of inflammation factors [12–15]. However, vicious cycle between inflammatory cytokines (IC) and ROS limit the therapeutic efficiency of ARDS [16–19]. Therefore, it is highly desirable to investigate efficacious anti-inflammatory and antioxidation therapeutic strategies to disrupt the vicious cycle microenvironment of ARDS.
In the progress of ARDS, activated macrophages (M1) in the lungs serve as the major innate immune cell type responsible for pro-IC secretion and inflammasome activation [20,21]. Thereinto, the nucleotide-binding oligomerization domain-like receptor protein 3 (NLRP3) inflammasome in M1 plays a key role in the pathogenetic process of ARDS [22,23]. Its activation triggers interleukin-1 beta (IL-1β) and IL-18 release, often stimulated by the nuclear factor kappa-B (NF-κB) pathway [24,25]. This pathway also enhances the secretion of pro-inflammatory factors like H2O2, tumor necrosis factor-α (TNF-α), IL-6, and IL-1β [26,27]. As a result, the upregulation of systemic inflammation leads to hyper-metabolic activation of innate immune cells, which causes oxidative stress and subsequent secretion of ROS [28]. The excessive ROS results in further activation of IC, which would constitute a vicious loop [18,29]. In contrast, alternatively activated macrophages (M2) as anti-inflammatory phenotype contributes to the resolution of inflammation and tissue repair [30–32]. Fortunately, the functional diversity of the macrophage could switch from M1 to M2 in response to downward of ROS and decrease of IC [33,34]. Consequently, it is a promising strategy to synthesize nanoparticles (NPs) with ROS regulation and anti-inflammatory functions to disrupt the malignant loop and reprogram M1 into M2.
Importantly, precisely targeting macrophages is of utmost importance for NPs to efficiently regulate M1-initiated inflammation cascades [35]. Inspired by the efferocytosis of macrophages, herein, we present a biocompatible efferocytosis-mimicking liposomal NPs BSA-MnO2@Tan-IIA/PSLs (BMTPLs) to break the vicious pathological cycle and effectively remodel the malignant microenvironment (MM) in M1 (Scheme 1). In this study, bovine serum albumin (BSA)-stabilized MnO2 nanozymes–BSA-MnO2 (BM), which possess superior dispersion and high biocompatibility were fabricated through one-step process [36,37]. Then, BM NPs were encapsulated by phosphatidylserine (PS)-containing liposomes (PLs) in the hydrophilic part, and the hydrophobic anti-inflammatory agent tanshinon ⅡA (Tan-IIA) was encapsulated in the phospholipid bilayer. PS acts as the “eat-me” signal molecule to enhance the uptake of M1 to BMTPLs. Upon internalization by M1, Tan-IIA blocks the NF-κB pathway, downregulating NLRP3 inflammasome, and finally suppresses the secretion of H2O2, TNF-α, IL-6 and IL-1β. Meanwhile, BM catalyzes the breakdown of ROS and decreases the ROS level, which further enhances the anti-inflammation function of Tan-IIA. Furthermore, the decrease of inflammatory factors will reduce the production of ROS. The synergetic effect of BM and Tan-IIA effectively breaks the vicious cycle between ROS and inflammatory factors. In conclusion, this efferocytosis-mimicking targeted strategy, which concurrently mitigates inflammatory factors and ROS, profoundly reshapes the deleterious inflammatory microenvironment, and fosters a robust shift towards M2 macrophage polarization. This strategy holds immense promise in revolutionizing the treatment landscape for ARDS, offering a novel and effective therapeutic avenue.
To synthesize the stable BM NPs, BSA was used as a reducing agent and the template via mimicking the disinfection procedure of KMnO4. Then, liposomes composed of cholesterol, PS, and phosphatidylcholine (PC) were%utilized to encapsulate BM NPs in the hydrophilic part, and the hydrophobic anti-inflammatory drug Tan-ⅡA was encapsulated in the phospholipid bilayer by a thin film hydration method [38–42]. During this process, the optimal hydration temperature and drug lipid ratio were investigated by drug loading percentage (DL%), which were determined to be 45 ℃ and 1:10 (w/w), respectively (Fig. S1 in Supporting information). The best Tan-ⅡA encapsulation efficiency was 82.26% ± 0.89%. In order to detect the successful modification of PS, we used Annexin V-fluorescein isothiocyanate (FITC) to label PS. As shown in Fig. S2 (Supporting information), BMTPLs group showed high fluorescence intensity (FI), indicating the successful modification of PS on the liposome. Meanwhile, transmission electron microscopy (TEM) images revealed that the resultant BM NPs and BMTPLs NPs possess a spherical shape with an average distribution of around 5.7 ± 0.89 and 90.0 ± 2.17 nm, respectively (Fig. 1A and Fig. S3 in Supporting information). The dynamic light scattering (DLS) and ζ-potential variations among BSA, BM and BMTPLs indicate the successful synthesis in each step (Figs. 1B and C). Subsequently, we found that the size and polydispersity index (PDI) of BMTPLs had no significant variation in phosphate buffered saline (PBS) for a long time (Fig. 1D). Two peaks, located at 641.58 and 653.28 eV in the BM XPS spectra, were identified as Mn2p3/2 and Mn2p1/2 of MnO2, respectively, which confirmed the successful formation of MnO2 (Figs. 1E and F).
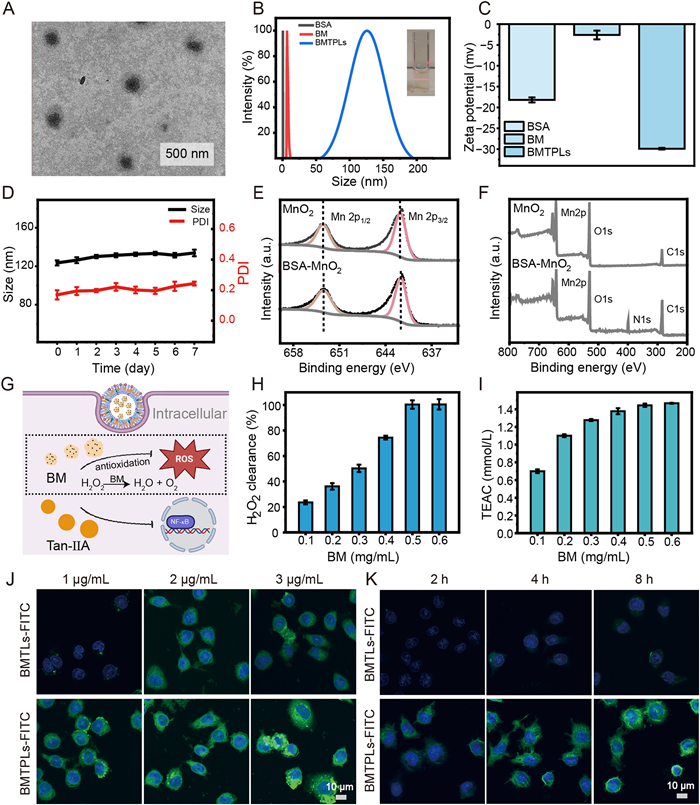
After phagocytosed by M1, BM catalyzes H2O2 to generate H2O and O2, which reduces intracellular ROS levels (Fig. 1G). We investigated the H2O2 clearance capacity of BM at different concentrations through an H2O2 detection kit. When the appropriate concentration of BMTPLs is determined to be 0.5 mg/mL, the H2O2 scavenging rate is close to 100% (Fig. 1H). Moreover, the total antioxidant capacity was further monitored using ABTS as a chemical substrate. At the concentration of 0.5 mg/mL, the BM displays excellent antioxidant activity (Fig. 1I). The findings reflect that BMTPLs have the promising potential for effectively clearing ROS.
Precisely targeting macrophages is of utmost importance for NPs to efficiently regulate M1-initiated inflammation cascades [43]. FITC-loaded liposomes BMT@FITC/Ls (BMTLs-FITC) and BMT@FITC/PLs (BMTPLs-FITC) were prepared to investigate the liposome uptake capability of M1. After testing that the above two groups of liposomes contain a similar encapsulation rate of FITC (Fig. S4 in Supporting information), we performed the following cell uptake-related experiments. Firstly, we incubated M1 cells polarized from RAW264.7 cells pre-stimulated by lipopolysaccharide (LPS) with BMTPLs-FITC at different times to determine the saturated incubation time point. The FI related to the uptake of cells nearly remained unchanged after 8 h incubation with BMTPLs-FITC, as revealed by flow cytometry results (Fig. S5A in Supporting information). Then, we employed 4′,6-diamidino-2′-phenylindole (DAPI) and FITC to locate the nucleus and different nanodrugs in M1 cytoplasm incubated with different concentrations and times (Figs. 1J and K). Fluorescence image results show that the cellular uptake process of BMTLs and BMTPLs is time- and concentration-dependent. More importantly, M1 cells treated with BMTPLs-FITC nanodrugs display the most intense green FI, indicating that this group possesses excellent specific M1 cell targeting owing to efferocytosis-like internalization, which aligns with the outcomes of flow cytometry results (Fig. S5B in Supporting information).
We further investigated different nanodrugs’ ability to clear ROS in vitro within M1 after successfully confirming its effective uptake of BMTPLs. To obtain a safety dose concentration of BMTPLs, RAW264.7 (macrophage), A549 cells (human typellalveolar epithelial cell line) and MLE-12 (murine lung epithelial-12) were treated with BMTPLs at different doses. The results demonstrate that the cell survival rate remained above 90% for 48 h even with a higher concentration of 100 µg/mL, indicating substantial biocompatibility of BMTPLs (Figs. S6A–C in Supporting information). Live/dead staining assay of RAW264.7 using propidium iodide and calcein-AM further confirmed the biosafety of BMTPLs at 100 µg/mL (Fig. S7 in Supporting information). For the following in vivo/in vitro experiments, we applied BMTPLs with a dose concentration of 100 µg/mL. In macrophages, LPS is usually used to activate the Toll-like receptor 4 (TLR4) to induce macrophage polarization toward to M1 phenotype, which elicits the generation of ROS and IC [44,45]. As shown in Fig. S6D (Supporting information), RAW264.7 were stimulated with LPS and then treated with different NPs.
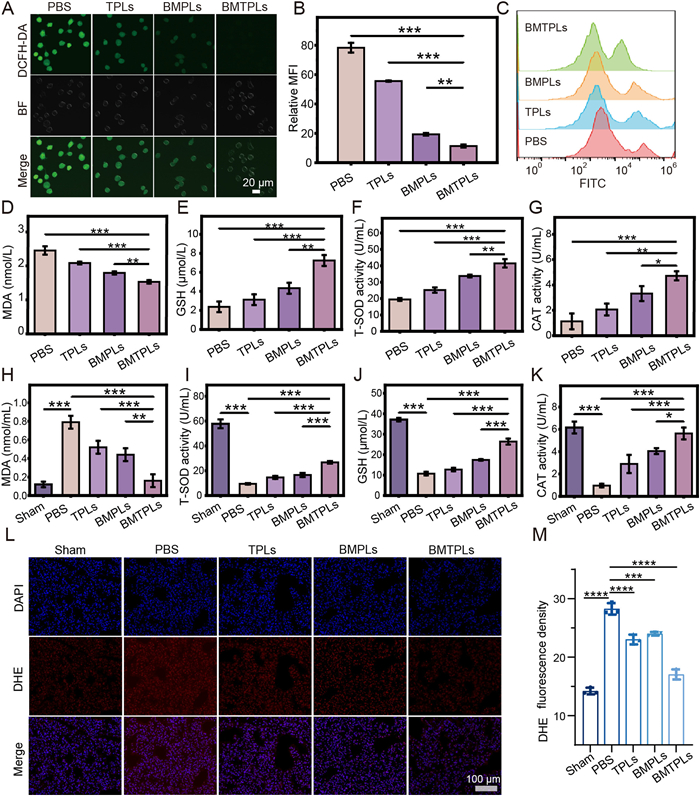
To evaluate cellular ROS level, ROS probe 2′,7′-dichlorofluorescein diacetate (DCFH-DA) was applied. As shown in Figs. 2A and B, the green FI related to ROS is significantly weakened in BMTPLs group owing to the enhanced ROS clearance properties compared with other groups. In addition, the ROS level of TPLs group was lower than PBS group. This may be attributed to that Tan-IIA has the ability to prevent oxidative stress [46]. Flow cytometry analysis further confirmed the effective ROS clearance properties of BMTPLs (Fig. 2C, Fig. S8 in Supporting information). The accumulation of ROS increases oxidative stress pressure in M1, leading to the aggravation of inflammation. The levels of ROS-related factors, such as glutathione (GSH), superoxide dismutase (SOD), malondialdehyde (MDA) and catalase (CAT) were determined through enzyme-linked immunosorbent assays (ELISA) [47]. Notably, the level of oxidative-stress-related factors MDA was markedly reduced and anti-oxidation-related factors GSH, SOD and CAT were enhanced in the BMTPLs group compared to other groups (Figs. 2D–G). These results confirmed the highest ROS clearance properties of BMTPLs, which relieves the high oxidative stress level. Meanwhile, we studied the effect of BMTPLs on scavenging ROS in vivo. As shown in Figs. 2H–K, the decreased MDA level and increased SOD, GSH and CAT activity in BMTPLs group exerted a stronger antioxidation action compared to other groups. Furthermore, lung tissues immunofluorescence stained with dihydroethidium (DHE) to estimate ROS level was carried out. BMTPLs group displayed lower ROS levels compared to other groups (Figs. 2L and M). Overall, benefiting from the enhanced synergistic effect of Tan-ⅡA and BM on ROS clearance and inflammation factor secretion inhibition, BMTPLs presents outstanding ability to improve the inflammatory microenvironment of ARDS.
After phagocytosed by M1, BMTPLs not only decrease ROS level but also prevent the cytokines secretion (Fig. S9 in Supporting information). The anti-inflammation activity of BMTPLs NPs was primarily researched at the cellular level. We collected conditioned media from pre-stimulated RAW264.7 macrophages after various treatments to assess the IC secretion status using ELISA. The capacity of pro-inflammatory mediators, such as TNF-α, IL-6, and IL-1β to trigger local or systemic inflammation which may result in aggravation of inflammation [48]. As shown in Figs. 3A–C, M1-related IC secretion including TNF-α, IL-6, and IL-1β was remarkably decreased in the BMTPLs group. On the contrary, the anti-inflammatory factor IL-10 that M2 macrophages secrete, which play important roles in alleviating inflammation was significantly increased in BMTPLs group than in other groups (Fig. 3D). These phenomena exhibited the excellent capacity of BMTPLs to improve the inflammation microenvironment. Additionally, researchers have shown that ROS clearance can suppress macrophage M1 activation and promote the polarization of macrophages towards M2 phenotype, which can suppress inflammation factor secretion and promote inflammation resolution [49]. Consequently, we assessed the polarization degree of pre-stimulated RAW264.7 cells after various treatments. We labeled M1 subpopulations (CD86) and M2 subpopulations (CD206) by immunofluorescence. As shown in Fig. 3E, compared to other groups, green fluorescence of M1 activation was significantly suppressed and the highest red fluorescence of M2 phenotype transformation was observed in BMTPLs treated groups. Cytometry shows the same effects of BMTPLs to promote the phenotypic transformation of macrophages (Figs. 3F and G). Furthermore, we observed the changes of inflammatory factors caused by macrophage polarization before and after BMTPLs treatments. Fig. S10 (Supporting information) showed that the inflammatory factors (TNF-α, IL-1β, IL-6) secreted by M1 were down-regulated, and the anti-inflammatory factors (IL-10 and transforming growth factor-β (TGF-β)) secreted by M2 were up-regulated after BMTPLs treatment. These results indicate that after uptake by M1 cells, BMTPLs can effectively inhibit cytokines secretion and induce increased expression of M2 cells.
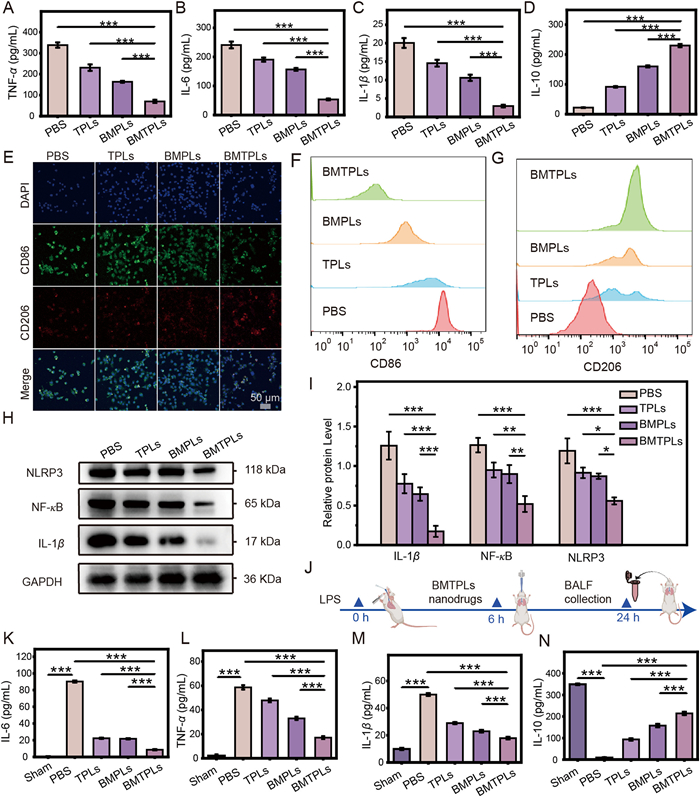
To further explore the underlying mechanism of anti-inflammation, Western blot (WB) analysis of characteristic proteins including NLRP3, NF-κB and IL-1β were investigated. After incubating with BMTPLs for 24 h, the expression of NF-κB, as an important priming signal for activating the NLRP3 inflammasome and promoting the secretion of inflammation factor obviously decreased. Meanwhile, the expression of NLRP3 and IL-1β also had a significant down-regulation compared to other groups (Figs. 3H and I), further suggesting that inhibition to pathological inflammation cascades has happened in M1 cells. Moreover, the expression of inflammatory factors such as IL-1β, IL-6, TNF-α and IL-18 in mRNA level were also investigated through quantitative reverse transcription polymerase chain reaction (qRT-PCR). Consistent with the results of WB, the level of IC decreased significantly after BMTPLs treatment (Fig. S11 in Supporting information). Next, in order to observe the inhibition mechanism of NF-κB, we further observed the expression changes of phosphorylated NF-κB (p-NF-κB), whose phosphorylation level directly affects the activity of NF-κB [50]. As shown in Fig. S12 (Supporting information), the phosphorylation level of NF-κB was significantly down-regulated after BMTPLs treatment, indicating that Tan-IIA inhibits NF-κB activity by inhibiting its phosphorylation. This is consistent with the previously reported literature [51–53]. Considering that the ability of BMTPLs to remodel the MM. We further studied the effect of BMTPLs on inhibiting cytokines secretion in ARDS mice. As described schematically in Fig. 3J, after LPS stimulation for 6 h, mice received different treatments and then the bronchoalveolar lavage fluid (BALF) was collected.
The lung inflammation degree was estimated by testing the cytokines content in BALF. ELISA results revealed that the expression level of the pro-inflammation factor of IL-6, TNF-α and IL-1β in the BMTPLs group was dramatically dropped (Figs. 3K–M). Meanwhile, IL-10 generated by M2 macrophages was further determined in BALF to confirm the possibility that BMTPLs could restore tissue homeostasis. As shown in Fig. 3N, IL-10 was greatly increased in the BMTPLs group than in other groups. In addition, lung tissues immunofluorescence showed that the BMTPLs group had lower intensity of IL-1β and NF-κB protein staining (Fig. S13 in Supporting information). The associated proteins NLRP3 has shown consistent results (Fig. S14 in Supporting information). These results exhibited the excellent capacity of BMTPLs to improve the inflammation microenvironment.
The in vivo therapeutic efficacy of BMTPLs is further evaluated in BALB/c mice model of ARDS by endotracheal administration of 7.5 mg/kg LPS. The protocol for animal experiments was approved by the guiding principles of the Animal Experimentation Ethics Committee. As described schematically in Fig. 4A, after LPS stimulation for 6 h, mice received different treatments by endotracheal administration and were then euthanized after 24 h. The excised lungs are photographed after treatment (Fig. 4B). As expected, the results demonstrate that groups treated with BMTPLs exhibited a remarkable reduction in lung injury compared with the other groups. We further assessment the respiratory function of mice after different treatments, including minute ventilation (MVb), tidal volume (TVb) and relaxation time (tRb). The results in Fig. S15 (Supporting information) indicated that BMTPLs effectively restored lung function in mice compared to PBS, TPLs, and BMPLs groups. Subsequently, hematoxylin and eosin (H&E) staining and histopathological outcomes demonstrated that compared to treatment group with BMPLs and TPLs moderately inhibited the lung injury, whereas the BMTPLs group exhibited higher therapeutic efficiency, which is reflected by the smallest lung injury score. (Figs. 4C and D). Subsequently, as one typical characteristic of ARDS, the wet-to-dry weight ratio of the lung was measured to evaluate pulmonary edema. Compared to the single drug group, the wet-to-dry (W/D) ratio of the BMTPLs group shows the greatest degree of remission (Fig. 4E). The high W/D ratio ascribed to high alveolar capillary barrier permeability in ARDS, which leads to an increased number of total cells in the BALF [54]. Consequently, the protein concentration and cell count in the BALF are performed to estimate the effectiveness of ARDS therapy (Figs. 4F and G). The group treated with BMTPLs is significantly decreased in protein concentration and cell count compared with other groups, implying its excellent anti-inflammation and anti-oxidation properties. Meanwhile, the pulmonary vascular leakage experiments were carried out and the results revealed that BMTPLs could significantly lessen Evans blue dispersion in the lung tissues by decreasing vascular permeability (Fig. 4H and Fig. S16 in Supporting information), which further shows excellent inflammation inhibition and the most effective therapeutic impact of BMTPLs.
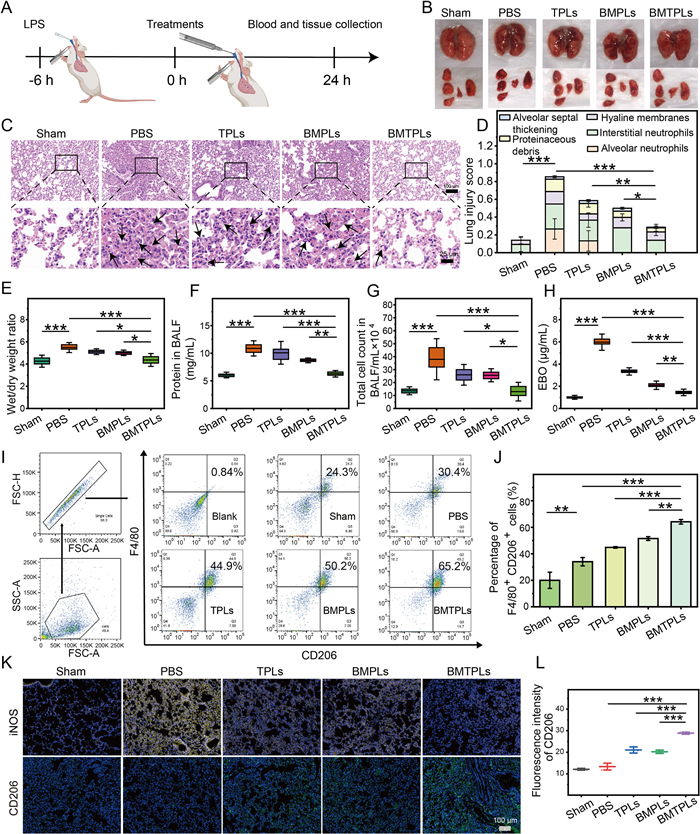
Subsequently, we assessed the polarization degree in collected BALF after various treatments. The flow cytometer was used to research M2 cell level in BALF and the results present the highest percentage of M2 in the BMTPLs group (Figs. 4I and J). Consistently, lung tissues stained with immunofluorescence revealed that the BMTPLs group had higher intensity of CD206 and lower intensity of iNOS protein staining compared to other groups (Figs. 4K and L, Fig. S17 in Supporting information). Overall, benefiting from the enhanced synergistic effect of Tan-ⅡA and BM, BMTPLs presents outstanding ability to improve the inflammatory microenvironment and mitigate ARDS.
Lastly, the safety examination of BMTPLs was conducted in vivo. To study the long-term safety of NPs, we analyzed the changes in the body weight of the mice after different treatments within two weeks. As is shown in Fig. S18 (Supporting information), the treatment groups exhibited varying degrees of weight increase, which indicate negligible side effects of the nanodrugs for longer-term safety. After different treatments, tissue histological analysis of the main organs including heart, liver, spleen, and kidney from mouse were also studied with H&E staining. As shown in Fig. S19 (Supporting information), no discernible pathological abnormalities and signs of damage were found in all groups (Fig. S19A). Meanwhile, we analyzed the serum inflammatory factors levels in different groups, and there was no significant change in the dosing group compared with the normal group (Figs. S19B–E). Furthermore, we analyzed the serum inflammatory factors in BMTPLs and BMTLs after endotracheal administration, respectively. As shown in Fig. S20 (Supporting information), there was no significant change in the BMTPLs and BMTLs groups, which may be attributed to the advantages of local administration, such as local targeting and low systemic toxicity. Subsequently, blood biochemistry and blood routine examination were investigated. As shown in Figs. S19F–K, blood routine indexes including red blood cells (RBC), hemoglobin (HGB), platelet (PLT), mean corpuscular volume (MCV), mean corpuscular hemoglobin (MCH), and mean corpuscular hemoglobin concentration (MCHC) have no significant change in all groups. Moreover, there was no notable disparity of blood biochemistry indexes between the different groups in the detection of alanine aminotransferase (ALT), aspartate aminotransferase (AST), and blood urea nitrogen (BUN) levels (Figs. S19L–N). In addition, to evaluate the biosafety, the hemolysis assay is also investigated, and the results demonstrated that the BMTPLs possess excellent blood biocompatibility (Fig. S21 in Supporting information). Taken together, our results demonstrate that BMTPLs possesses excellent biosafety and biocompatibility within the body, which provides a strong guarantee for the biological application of BMTPLs in the future.
In conclusion, we successfully constructed macrophage-targeting lipid NPs BMTPLs which are made up of BM, Tan-ⅡA and PS-containing liposomes. After phagocytosed by M1 in an efferocytosis-like manner, Tan-IIA inhibits NF-κB pathway and downregulates NLRP3 inflammasome suppressing inflammatory factors secretion. Meanwhile, BM scavenges ROS and alleviates oxidative stress microenvironment which enhances the anti-inflammation of Tan-IIA. Synergistically, BMTPLs effectively terminates pathological cascades and remodels the vicious inflammation microenvironment of ARDS. In particular, BMTPLs reprogramming pro-inflammatory M1 to pro-resolution M2 phenotype contributes to the restoration of tissue homeostasis. Overall, BMTPLs demonstrates prominent mitigation efficacy of ARDS without obvious biological toxicity, which presents a promising direction for ARDS therapy. Owing to the vicious inflammation pathological cascades between cytokines and ROS are also the typical common feature of inflammation in other diseases (e.g., cardiovascular disease, rheumatoid arthritis), we believe that our nano-platform BMTPLs could be applied to more types of inflammation-related diseases in the future.
The authors declare that they have no known competing financial interests or personal relationships that could have appeared to influence the work reported in this paper.
Yikun Chen: Writing – original draft, Investigation. Wenling Li: Writing – original draft, Conceptualization. Juan Cao: Writing – original draft, Methodology. Yongjun Wang: Methodology, Data curation. Yufang Guo: Software, Investigation. Liu Qing: Software, Methodology. Li Wang: Software, Methodology. Sisi Yu: Software, Methodology. Lei Xing: Supervision, Funding acquisition. Hulin Jiang: Writing – review & editing, Supervision, Funding acquisition. Bing Wan: Supervision, Resources, Funding acquisition.
This work was financially supported by the National Key Research and Development Program of China (No. 2022YFE0198400), National Natural Science Foundation of China (Nos. 82020108029, 82473867). This work was also financially supported by Jiangsu Province Chinese medicine science and technology development project (No. MS2021104), Project of State Key Laboratory of Natural Medicines, China Pharmaceutical University (No. SKLNMZZ202021), Double First-Class University Projects (No. CPU2018GY06), Double First-Rate Construction Plan of China Pharmaceutical University (No. CPU20220Z18).
Supplementary material associated with this article can be found, in the online version, at doi:
L.D.J. Bos, L.B. Ware, Lancet 400 (2022) 1145–1156. doi: 10.1016/S0140-6736(22)01485-4
M.A. Matthay, R.L. Zemans, G.A. Zimmerman, et al., Nat. Rev. Dis. Primers 5 (2019) 18. doi: 10.1038/s41572-019-0069-0
P.T. Goud, D. Bai, H.M. Abu-Soud, Int. J. Biol. Sci. 17 (2021) 62–72. doi: 10.7150/ijbs.51811
M.A. Matthay, R.L. Zemans, Annu. Rev. Pathol. 6 (2011) 147–163. doi: 10.1146/annurev-pathol-011110-130158
E.Y. Lim, S.Y. Lee, H.S. Shin, et al., Antioxidants 12 (2023) 2016. doi: 10.3390/antiox12112016
X.S. Wu, B.l. Wang, Y.C. Li, et al., Chin. Chem. Lett. 36 (2025) 111526.
R. Wang, T. Liu, X. Li, et al., Asian J. Pharm. Sci. 19 (2024) 100913.
J. Yang, R. Zhang, H. Zhao, et al., Exploration 2 (2022) 20210267. doi: 10.1002/EXP.20210267
J. He, Y. Hou, Z. Zhang, et al., Nano Biomed. Eng. 16 (2024) 28–47. doi: 10.26599/nbe.2024.9290053
Y. Liu, Y. Cheng, H. Zhang, et al., Sci. Adv. 6 (2020) eabb2695. doi: 10.1126/sciadv.abb2695
F. Jing, Y. Zhu, F. Li, et al., Chem. Eng. J. 465 (2023) 142675. doi: 10.1016/j.cej.2023.142675
X. Li, Y. Wei, S. Li, et al., Int. Immunopharmacol. 111 (2022) 109138. doi: 10.1016/j.intimp.2022.109138
X. Li, C. Xiao, J. Yuan, et al., Inflamm. Res. 72 (2023) 1237–1255. doi: 10.1007/s00011-023-01746-8
B. Li, F. Liu, J. Ye, et al., Small 18 (2022) 2202691. doi: 10.1002/smll.202202691
L. Yin, X. Jiang, M. Wang, et al., Chin. Chem. Lett. 36 (2025) 110224. doi: 10.1016/j.cclet.2024.110224
A.S. Mirchandani, S.J. Jenkins, C.C. Bain, et al., Nat. Immunol. 23 (2022) 927–939. doi: 10.1038/s41590-022-01216-z
S. Ahmad, S. Manzoor, S. Siddiqui, et al., Semin. Cancer Biol. 83 (2022) 384–398. doi: 10.1016/j.semcancer.2021.01.003
G. Idelman, D.L.H. Smith, S.D. Zucker, Redox Biol. 5 (2015) 398–408. doi: 10.1016/j.redox.2015.06.008
Z. Xu, B. Deng, X. Wang, et al., J. Nanobiotechnol. 19 (2021) 404. doi: 10.1186/s12951-021-01152-4
U. Patel, S. Rajasingh, S. Samanta, et al., Drug Discov. Today 22 (2017) 186–193. doi: 10.1016/j.drudis.2016.08.006
W.Q. Jin, L. Liao, T. Qin, et al., Chin. Chem. Lett. 36 (2025) 110920. doi: 10.1016/j.cclet.2025.110920
T. Dolinay, Y.S. Kim, J. Howrylak, et al., Am. J. Respir. Crit. Care. Med. 185 (2012) 1225–1234. doi: 10.1164/rccm.201201-0003OC
Y.S. Xu, T.Z. Zhang, L. Feng, et al., Chin. Chem. Lett. 32 (2021) 1475–1479. doi: 10.1016/j.cclet.2020.09.048
Y. Huang, W. Xu, R. Zhou, Cell Mol. Immunol. 18 (2021) 2114–2127. doi: 10.1038/s41423-021-00740-6
C. Chen, P. Xu, Biomolecules 12 (2022) 1005. doi: 10.3390/biom12071005
T. Liu, L. Zhang, D. Joo, Signal Transduct. Target Ther. 2 (2017) 17023. doi: 10.1038/sigtrans.2017.23
B.R. Barker, D.J. Taxman, J.P.Y. Ting, Curr. Opin. Immunol. 23 (2011) 591–597. doi: 10.1016/j.coi.2011.07.005
J. Liu, X. Han, T. Zhang, et al., J. Hematol. Oncol. 16 (2023) 116. doi: 10.1186/s13045-023-01512-7
L.F. Zhang, W.Q. Deng, Q.W. Huang, et al., Adv. Mater. 16 (2024) e2311474.
A. Shapouri-Moghaddam, S. Mohammadian, H. Vazini, et al., J. Cell Physiol. 233 (2018) 6425–6440. doi: 10.1002/jcp.26429
B. Sui, T. Ding, X. Wan, Exploration 4 (2024) 20230149. doi: 10.1002/EXP.20230149
F. Tian, A. Prina-Mello, G. Estrada, et al., Nano Biomed. Eng. 1 (2009) 13–26.
G. Yang, M. Fan, J. Zhu, et al., Biomaterials 255 (2020) 120155. doi: 10.1016/j.biomaterials.2020.120155
J. Deng, R. Wang, S. Huang, J. Ding, W. Zhou, Chin. Chem. Lett. 34 (2023) 107588. doi: 10.1016/j.cclet.2022.06.011
H. Han, L. Xing, B.T. Chen, et al., Adv. Drug Deliv. Rev. 200 (2023) 115051.
J. Pan, Y. Wang, H. Pan, et al., Adv. Funct. Mater. 27 (2017) 1603440. doi: 10.1002/adfm.201603440
T.J. Zhou, M.M. Zhang, D.M. Liu, et al., Biomaterials 305 (2024) 122447. doi: 10.1016/j.biomaterials.2023.122447
M.Y. Yang, Y.J. Lin, M.M. Han, et al., J. Control. Release 351 (2022) 623–637.
M.M. Han, L. Tang, B. Huang, et al., J. Control. Release 366 (2024) 732–745. doi: 10.1016/j.jconrel.2024.01.032
Z.C. Sun, R. Liao, C. Xian, et al., J. Control. Release 375 (2024) 300–315.
Z. Fang, L. Wang, X. Zhang, et al., Int. J. Biol. Macromol. 284 (2025) 138233. doi: 10.1016/j.ijbiomac.2024.138233
R. Liao, Z.C. Sun, L. Wang, et al., Bioact. Mater. 43 (2024) 406–422.
Y. Wang, J.S. Yang, M. Zhao, et al., Adv. Drug Deliv. Rev. 211 (2024) 115355.
A.P. West, I.E. Brodsky, C. Rahner, et al., Nature 472 (2011) 476–480. doi: 10.1038/nature09973
Z. He, X. Li, H. Zhang, et al., Chin. Chem. Lett. 34 (2023) 108236.
Y.P. Zhao, F. Wang, W. Jiang, et al., J. Drug Target. 27 (2019) 896–902. doi: 10.1080/1061186x.2019.1566338
X. Chang, C. Liu, Y.M. Han, et al., Mol. Ther. Nucleic Acids 32 (2023) 415–431.
D.C. Fajgenbaum, D.L. Longo, C.H. June, N. Engl. J. Med. 383 (2020) 2255–2273. doi: 10.1056/nejmra2026131
M. Ren, C. Zhou, X. Li, et al., Adv. Healthc. Mater. 13 (2024) 2304125.
M.R. Zinatizadeh, B. Schock, G.M. Chalbatani, et al., Genes Dis. 8 (2021) 287–297.
X. Wu, H. Gao, Y. Hou, et al., Toxicol. Appl. Pharmacol. 355 (2018) 1–8.
F. Wang, J. Ma, K.S. Wang, et al., Int. Immunopharmacol. 28 (2015) 764–772.
H. Gao, X. Liu, W. Sun, et al., Cell Death Dis. 8 (2017) e3004. doi: 10.1038/cddis.2017.389
M.A. Matthay, L.B. Ware, G.A. Zimmerman, J. Clin. Invest. 122 (2012) 2731–2740.

Scheme 1 (A) Fabrication illustration of the BMTPLs. (B) Schematic illustration of the efferocytosis-informed BMTPLs NPs breaking the vicious cycle and remodeling the malignant inflammatory microenvironment.

Figure 1 Characterization of NPs BMTPLs. (A) Representative TEM image of BMTPLs NPs. (B) DLS profiles of BSA, BM and BMTPLs NPs. (C) Zeta potentials of BSA, BM and BMTPLs NPs. (D) The seven-day stability of BMTPLs NPs in PBS. (E, F) XPS spectra of MnO2 and BM. (G) Scheme illustration of cellular uptake of BMTPLs and ROS clearance in the cell. (H) H2O2 scavenging ratio of BM NPs at different concentrations (10 mmol/L H2O2). (I) Total antioxidation of BM at different concentrations. (J) Confocal images show different uptake in vitro of BMTLs-FITC and BMTPLs-FITC at different concentrations (loading FITC: 1, 2, 3 µg/mL) after incubation for 2 h. (K) Confocal laser scanning microscope (CLSM) images of NPs with or without PS were taken by pre-stimulated RAW264.7 cells at various incubation times (2, 4 and 8 h). FITC (green) was used to label the NPs, while DAPI was used to stain the cell nuclei. Scale bar: 10 µm. Data are presented as means ± standard deviation (SD) (n = 3).

Figure 2 BMTPLs nanoplatform eliminates ROS in vitro and in vivo. (A) Confocal images exhibiting the ROS level in pre-stimulated RAW264.7 cells after different treatments for 24 h (scale bar: 20 µm). (B) Relative mean fluorescence intensity (MFI) of intracellular ROS in pre-stimulated RAW264.7 cells; the intracellular ROS was stained with the DCFH-DA probe shown in green. Scale bar: 20 µm. (C) Corresponding flow cytometry analysis showing the intracellular ROS level after pre-stimulated RAW264.7 cells incubated with various nanodrugs for 24 h. (D-G) ROS-related factors MDA, GSH, T-SOD and CAT concentration in the culture medium of inflamed macrophages after treatment with PBS, TPLs, BMPLs or BMTPLs. (H–K) In vivo ROS-related factors (H) MDA, (I) T-SOD, (J) GSH and (K) CAT activity in BALF of distinct groups. (L) Representative DHE immunofluorescence images of the lung ROS levels from ARDS model mice after different treatment groups (scale bar: 100 µm). (M) Quantitative analysis of DHE MFI. P < 0.05, **P < 0.01, ***P < 0.001, ****P < 0.0001. Data are presented as means ± SD (n = 3).

Figure 3 ROS clear and macrophages polarization analysis. (A–D) Levels of typical pro-IC (TNF-α, IL-6, IL-1β) and typical anti-IC (IL-10) in the culture medium of inflamed macrophages after treatment with PBS, TPLs, BMPLs or BMTPLs. (E) CLSM images of CD86 (M1 maker, green) and CD206 (M2 maker, red) on pre-stimulated RAW264.7 after incubation with PBS, TPLs, BMPLs or BMTPLs (scale bar: 50 µm). (F, G) Corresponding flow cytometry analysis of CD206 and CD86 in pre-stimulated RAW264.7 macrophages treated with different drugs. (H) WB analysis of NLRP3, NF-κB and IL-1β expression, with glyceraldehyde-3-phosphate dehydrogenase (GAPDH) as the internal control. (I) Quantitative analysis of protein expression levels. (J) Schematic illustration of the ARDS mouse model study. (K–N) Levels of typical pro-IC (IL-6, TNF-α, IL-1β) and typical anti-IC (IL-10) in the BALF. P < 0.05, **P < 0.01, ***P < 0.001. Data are presented as mean ± SD (n = 3).

Figure 4 Evaluation of the therapeutic effect in LPS-ARDS mouse model. (A) Schematic illustration of the ARDS mouse model study. (B) The photography of lung tissues obtained after different treatments. (C) Histological images of lung sections stained with H&E from various treatments. Scale bars in the panels are 25 µm and 100 µm, respectively. (D) The overall score for lung injury derived five pathophysiological characteristics (alveolar neutrophils score, interstitial neutrophils score, hyaline membranes score, proteinaceous debris score and alveolar septal thickening score) primarily based on the histological images. (E) Lung W/D weight ratio. (F) The protein concentration in BALF. (G) The number of total cells in BALF. (H) Evans blue dye extracted from lung tissue after various treatments as indicated. (I) FCM was utilized to identify the polarization of macrophage in BALF after various treatments as indicated. (J) Quantitatively evaluate CD206 positive cells ratio. (K) Representative immunofluorescence images of the lung from ARDS model mice stained with DAPI (blue), CD206 (green), iNOS (yellow) in the different treatment groups (scale bar: 100 µm). (L) Quantitative analysis of IL-1β FI. P < 0.05, **P < 0.01, ***P < 0.001. Data are presented as mean ± SD (n = 3).

 扫一扫看文章

扫一扫关注我们
 DownLoad:
 下载:
下载:
 下载:
下载: