Key Laboratory of Bio-Inspired Smart Interfacial Science and Technology of Ministry of Education, School of Chemistry, Beihang University, Beijing 100191, China
b.
University of Science and Technology of China, Hefei 230026, China
c.
Suzhou Institute for Advanced Research, University of Science and Technology of China, Suzhou 215123, China
d.
PetroChina Research Institute of Petroleum Exploration & Development, Beijing 100083, China
e.
Tianmushan Laboratory, Hangzhou 310023, China
f.
School of Materials Design and Engineering, Beijing Institute of Fashion Technology, Beijing 100029, China
g.
The Key Laboratory of Bionic Engineering (Ministry of Education), Jilin University, Changchun 130012, China
Received Date:
28 April 2025 Accepted Date:
12 August 2025 Revised Date:
11 August 2025 Available Online:
15 May 2026
Abstract:
Regulating gas diffusion is essential for a range of natural and industrial processes, including underwater breathing, aeration reactor and energy device. Natural organisms, e.g., water boatman, utilize their superaerophilic (SAL) abdomen to create a plastron underwater, enabling efficient gas exchange with dissolved oxygen. Herein, inspired by nature, we have developed a superaerophilic stripe that can form an air film underwater to enhance gas diffusion. Increasing the width (w) of the superaerophilic stripe and height (h) of water, along with decreasing the distance between the bubble and the stripe (d), can improve gas diffusion. Due to the improved dissolved gas diffusion, an efficient hydrogen evolution reaction driven by enhanced H2 diffusion was successfully achieved, resulting in an electrode potential decrease ~13 mV at the same current density of 1 mA/cm2 compared to that without the SAL stripe. This research offers important theoretical insights into the dynamics of gas diffusion and presents practical methods for enhancing gas mass transfer.
Gas diffusion plays a crucial role in various natural and industrial processes, including underwater breathing [1–4], aeration reactors [5–7], and energy devices [8–10]. For example, nature organisms like water boatmen (Agraptocorixa eurynome) have tiny hairs on their thorax and abdomen that can capture air bubbles (or create a plastron), contributing them to exchange gases with dissolved oxygen and survive underwater for extended periods [11]. The incorporation of superaerophilic interfaces in gas-liquid membrane contactors effectively mitigates CO2 mass transfer resistance by sustaining a gas film, which enhances gas diffusion and separation efficiency, bearing critical significance in industrial carbon capture applications [12,13]. Consequently, understanding and optimizing diffusion kinetics are critical for advancing energy efficiency, elevating production throughput, and enabling sustainable manufacturing paradigms across diverse industrial sectors.
Significant accomplishments have been developed to promote gas diffusion. Heating, pressurizing, and stirring are commonly utilized in industrial processes to enhance convection and promote gas mass transfer in gas-liquid two-phase systems [14–16]. Oxygen aeration is commonly used to increase the surface area for gas diffusion, either by generating small bubbles or utilizing membrane diffusers to optimize oxygen diffusion efficiency [17,18]. In the field of gas-involved electrochemistry, such as CO2 reduction, oxygen reduction reaction, hydrogen evolution reaction, innovative electrode designs have shown promising results to enhance gas diffusion [19,20], including the water-spider inspired hydrophobic Cu electrode [21], the SAL electrode [22], and the SAL/superaerophobic (SAB) synergistic electrode [23]. Despite these advancements, the detailed influence of superaerophilic materials on the diffusion of dissolved gases in water is seldom investigated.
In this work, we have carefully investigated the dissolved gas diffusion under the influence of partial immersed SAL stripe with gas film through observing bubble shrinking. Three key factors, that are the width of the SAL stripe (w), the distance between the bubble and SAL stripe (d), and the height of the water (h), were analyzed. Specifically, increasing the width (w) of the SAL stripe and water height (h) will accelerate the diffusion of dissolved gas and result in faster bubble shrinking, whereas increasing the distance between the bubble and SAL stripe (d) will slow down the diffusion of dissolved gas and result in slower bubble shrinking. Moreover, the incorporation of SAL stripe in the hydrogen evolution reaction has clearly enhanced the promotion of dissolved hydrogen diffusion. These findings establish a scientific understanding for using superaerophilic materials in gas diffusion processes and inspire novel approaches to regulate mass transfer in gas-involved processes.
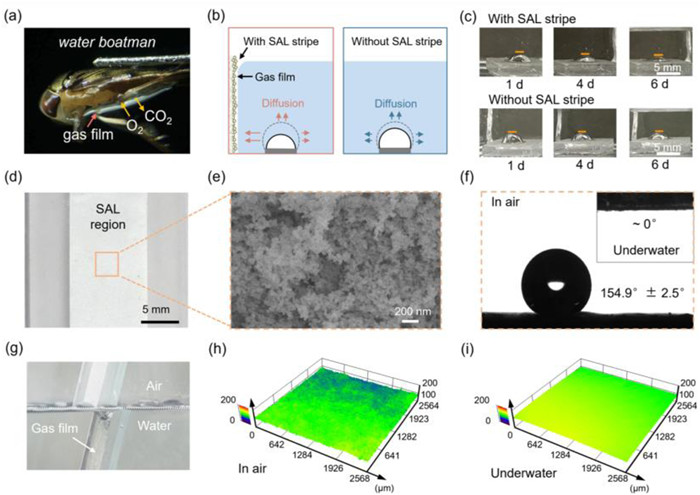
In nature, water boatmen (Agraptocorixa eurynome) can utilize their SAL abdomen to form gas plastron for breathing underwater (Fig. 1a) [24]. The partial pressure of oxygen within the gas plastron is lower than that of the surrounding aqueous environment, thereby establishing a concentration gradient that facilitates unidirectional diffusion of dissolved oxygen from water into the gas-phase interface. While, the partial pressure of carbon dioxide within the gas plastron is larger than that of the surrounding aqueous environment, driving the directional diffusion of carbon dioxide from the gas plastron to the water. Consequently, gas plastron, i.e., gas film, can serve as an effective avenue for gas diffusion, thereby significantly improving gas exchange efficiency.
Figure 1
Figure 1.
(a) The plastron on the abdomen of the Water Boatman, facilitating gas exchange. Reproduced with permission [24]. Copyright 2010, Elsevier. (b) Schemes of dissolved gas diffusion of the system with and without SAL stripe. The length of the arrows indicates the strength of gas diffusion. (c) The volume of trapped bubble decreases with the time. The system with SAL stripe shows faster bubble shrinking, indicating faster gas diffusion. (d) Optical image of the SAL stripe. (e) SEM image of the SAL stripe. (f) Water contact angle in air and bubble contact angle underwater on the SAL stripe. (g) Optical images of the SAL stripe and laser-etched region. LSCM images of the SAL stripe in air (h) and underwater (i).
Inspired by water boatmen, we have proposed a strategy that utilizing SAL stripe to construct a stable plastron underwater for enhancing dissolved gas diffusion. Fig. 1b displays a gas container filled with water, featuring a SAL stripe attached to the left side, while the right side does not have a SAL stripe. A digital camera was employed to capture the dynamic changes of bubbles, from front-view. The SAL stripe in the left side can serve as an avenue for accelerating the gas diffusion in the bubble. Meanwhile, the gas in the right bubble can only diffuse into the bulk liquid. Consequently, the left bubble is supposed to shrink faster than the right one. The experimental results shown in Fig. 1c have verified our hypothesis, that the bubble in the container featuring the SAL stripe shrinks faster than that in the container without the SAL stripe, indicating accelerated dissolved gas diffusion. The maximum vertical height between gas-liquid interface and substrate was used as an indicator of bubble volume, with greater height corresponding to larger volume. In detail, after 1 day of diffusion, the crown heights measured 2.20 mm (with SAL stripe) and 2.42 mm (without). By 4 days, the heights decreased to 1.48 and 1.70 mm, respectively. After 6 days, the difference became more pronounced, with heights of 0.99 mm (with SAL stripe) and 1.54 mm (without).
The SAL stripes can be obtained through roller coating method, which is used for evenly coating superhydrophobic SiO2 nanoparticles on the surface, and subsequent laser etching processes (Fig. S1 in Supporting information). Laser etching process induces hydrophilicity in the region, with a measured water contact angle of 16.0° ± 1.9° and bubble contact angle of 153.9° ± 2.2° (Fig. S2 in Supporting information). The region without laser etching is the SAL stripe, of which optical image can be learned in Fig. 1d. The surface of SAL stripe is decorated with superhydrophobic SiO2 nanoparticles (Fig. 1e), enabling it with a water contact angle of 154.9° ± 2.5° and a bubble contact angle of ~0° (Fig. 1f). When the SAL stripe is immersed in water, a shiny silver sheen can be easily observed on the surface of SAL region, indicating the existence of gas plastron (Fig. 1g).
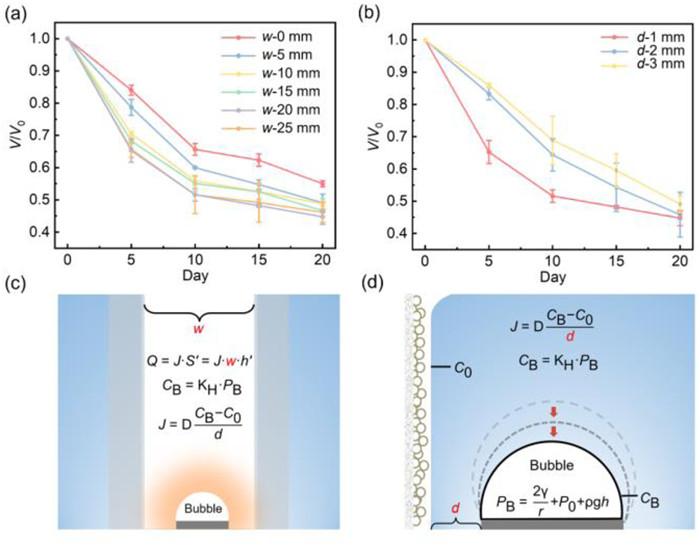
Meanwhile, laser scanning confocal microscopy (LSCM) technology was utilized to characterize the plastron on SAL region. In air, the LSCM image shows uneven surface (Fig. 1h), which is consistent with its rough surface morphology. Underwater, a continuous and smooth surface is observed, suggesting that a new smooth interface is generated underwater, i.e., the gas/water interface of plastron (Fig. 1i). Following the fabrication of the SAL stripe, an investigation was carefully conducted on three crucial factors: The width of the SAL stripe (w), the distance between the bubble and SAL stripe (d), and the height of water (h), in relation to the diffusive shrinking rate of gas bubble. The schematic diagram and actual photos of experimental setup are shown in Fig. S3 (Supporting information).
The influence of SAL stripe width on gas diffusion was firstly investigated. Here, h is established to be 10 cm, d is 1.0 mm, and bubble volume is 40 µL (V0). In general, a larger SAL stripe exhibits faster bubble shrinkage (Fig. S4 in Supporting information). Bubble volume fraction (V/V0), i.e., the real-time volume to their initial volume, is utilized to quantify the rate of bubble shrinking, which can be statistically analyzed through optical image contour (Experimental Section and Fig. S5 in Supporting information). As shown in Fig. 2a, when the SAL stripe width is 0, 5, 10, 15, 20, and 25 mm, V/V0 after 20 days is ~49.7%, ~49.1%, ~48.8%, ~46.7%, ~44.7% and 46.2% respectively. These results demonstrate that increasing SAL stripe width is capable of accelerating gas diffusion, but further widening of the SAL stripe would not substantially enhance the bubble diffusive shrinking rate. Consequently, 20 mm is the optimal value of SAL stripe width. In addition, d also greatly influenced the gas diffusion. As shown in Fig. 2b and Fig. S6 (Supporting information), when the distances between the SAL stripe and gas bubble are 1, 2, and 3 mm, the time necessary for the bubble to reduce to half of its volume is around 12 (50.0%), 16 (50.6%), and 20 days (49.1%) respectively.
Figure 2
Figure 2.
(a) The curve of V/V0versus day under the influence of w variable. (b) The curve of V/V0versus day under the influence of d variable. (c) Scheme of the influence of w on gas diffusion (lateral-view). (d) Scheme of the influence of d on gas diffusion (front-view).
These results can be explained through Fick's First Law (Eq. 1) [25]:
J=−D∂C∂X
(1)
where ∂C∂X refers to the gas concentration gradient, D is diffusion coefficient (25 ℃, 1 atm, DN2=2.0 cm2/s) [26]. To simplify the diffusion model, only two main diffusive directions around the bubble were considered: the diffusion to the water surface (i.e., atmosphere) in the vertical direction, and the diffusion to the SAL stripe in the horizontal direction. Owing to the existence of gas plastron on SAL stripe that directly connects with atmosphere, the gas concentration at the diffusion endpoint (water surface and SAL surface) is equivalent to the concentration of N2 in water (25 ℃, 1 atm, 6.0998 × 10⁻⁴ mol/L, marked as C0). While at the diffusion starting point (water-bubble interface), N2 concentration would be determined by local pressure at the gas-liquid interface (Eq. 2) [27]:
CB=KH·PB
(2)
where PB is the internal pressure of bubble, which can be presented as follows (Eq. 3) [28,29]:
PB=2γr+P0+ρgh
(3)
where γ is the surface tension of water (25 ℃, 1 atm, 72.021 mN/m), r is the bubble's radius, P0 is the standard atmospheric pressure. The SAL stripe width w directly influences the surface area of the air/water interface (S′), which serves as the outlet for dissolved gases. Meanwhile, the equivalent outlet height (h′) remains constant under the same water height condition. The diffusion rate of gas (Q) can be illustrated as follows (Eq. 4):
Q=J·S′=−D(KH·PB−C0)d·(w·h′)
(4)
The diffusion flux J remains constant for systems with that have the same initial volume V0, water height h, and distance between bubble and SAL stripe d. Therefore, an increase in w will lead to larger outlet area (S′), and higher Q, leading to faster gas diffusion and the shrinkage of bubbles (Fig. 2c). But for width larger than 20 mm, the increased outlet is far away from bubble, showing no further enhancement of gas diffusion. For system with same V0, h and w, the decreasing of d will result in larger J and present faster bubble shrinking rate (Fig. 2d), which is consistent with our experimental results.
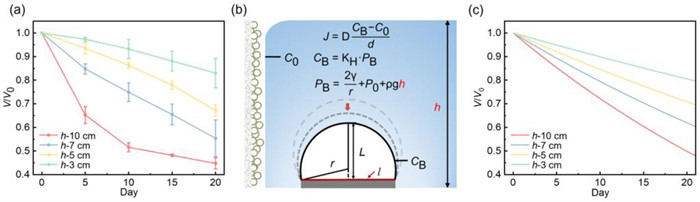
Water height (h) is also critical to the bubble shrinking performances. Here, w is set to be 20 mm and d is 1 mm. According to Fig. 3a and Fig. S7 (Supporting information), increasing water height (3, 5, 7, and 10 cm) is beneficial for bubble shrinking. For example, at depths of 3, 5, 7, and 10 cm underwater, the volume fractions of bubbles after 20 days are approximately 83.0%, 67.2%, 55.4%, and 44.7%, respectively. This phenomenon can also be explained through Fick's first Law. According to Eqs. 2 and 3, h will significantly influence PB, which in turn influences CB and ultimately impact J as described in Eq. 1 (Fig. 3b). According to the Ideal Gas Law, PB can be learned as follows (Eq. 5):
PBV=nRT
(5)
Figure 3
Figure 3.
(a) The curves of V/V0versus Day under the influence of h variable. (b) Mechanism of the influence of h on gas diffusion. (c) Theoretical results calculated by Python.
where PB has already given in Eq. 3, T is 298.15 K, R is the ideal gas constant, V is the bubble volume. We assume that the bubble has a geometric shape that matches a spherical crown shape with a radius of r and a height of L. Additionally, the bubble was attached to a superaerophilic circular plate with a diameter of 5 mm, which is equal to the bottom section diameter (l) of the spherical crown. Consequently, V, S, and r can be given by following equations (Eqs. 6-8):
V=πh23(3r−L)
(6)
S=2πrL
(7)
r2=l24+(r−L)2
(8)
Notably, since r evolves dynamically with time t, any parameter intrinsically linked to r, such as the bubble volume V, surface area S and inner pressure PB must consequently inherit this time dependence. Thus, we explicitly express them as V(t), S(t) and P(t) to represent how they change over time. The amount of gas molecules diffusing through bubble interface in time interval dt can be expressed by Eq. 9:
dn=−J·S(t)dt
(9)
Combine Eq. 5 with Eq. 9 to get Eq. 10:
dV=RTdnP(t)
(10)
Considering the concentration gradient from the gas-liquid interface to the SAL stripe, Eq. 1 can be further expressed as follows (Eq. 11):
J=DCB−C0d=DKHP(t)−C0d
(11)
Then dV can be calculated as follows (Eq. 11):
dV=−D[KHP(t)−C0]RTS(t)dP(t)dt
(12)
Cooperating with initial condition (V0 = 40 µL), the change of bubble volume versus diffusion time can be calculated through Iterative Method using Python as calculating tool. The results presented in Fig. 3c align well with the experimental findings. For the water height of 3, 5, 7, and 10 cm underwater, the bubble volume fractions by simulation after 20 days are 80.5%, 70.8%, 61.9% and 49.9% respectively, exhibiting a close agreement with the experimental results (~83.0%, ~67.2%, ~55.4%, and ~44.7%). In practical applications, balancing of SAL stripe width (w), bubble-stripe distance (d), and water height (h) within spatial constraints is required. Our approach prioritizes: (1) Minimizing d (decreases diffusion distance), (2) optimal w is 20 mm, for limited space (<20 mm), maximizing w (increases gas egress area), and (3) maximizing h (enhances diffusion driving force).
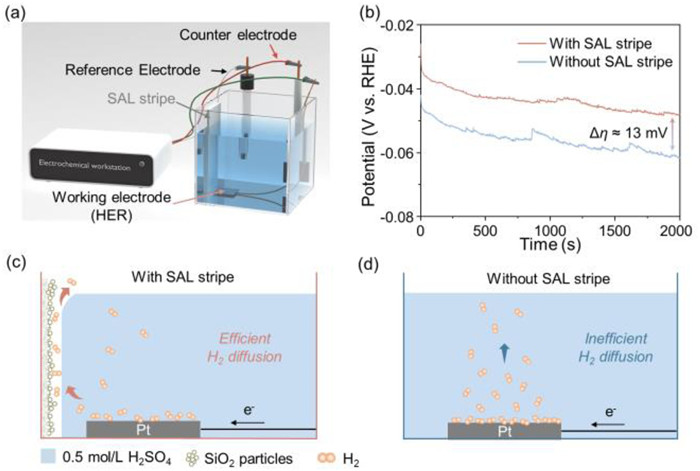
Inefficient gas diffusion in electrochemical reactions causes product accumulation, leading to gas concentration polarization [30]. Because the SAL stripe can improve diffusion of dissolved gas, we incorporated it into the electrocatalytic hydrogen evolution reaction (HER) to enhance electrode performance. The experimental setup is shown in Fig. 4a and Fig. S8 (Supporting information), on which Pt plate was used as working electrode to generate hydrogen. A SAL stripe was positioned adjacent to the cathode to enhance hydrogen diffusion. Notably, we selected the milliampere-range current for comparison, which can avoid the interference of bubble behavior. Experiment results (Fig. 4b) demonstrate that the incorporation of SAL stripe decreased electrode potential ~13 mV at the same current density of 1 mA/cm2 in comparison to that without SAL stripe. The decreased electrode potential can be attributed to the existing plastron of SAL stripe, which significantly reduces the diffusion distance, resulting in higher dissolved H2 diffusion rate. As shown in Fig. 4c, the local concentration of dissolved H2 near the electrode surface was reduced, which directly decrease the concentration overpotential (ηC) quantified in Eq. 13 [31,32]:
ηC=RTnFlnCH2CH2sat
(13)
where R is the ideal gas constant, T is the temperature, n is the number of moles of electrons involved in electrode reaction, F is the Faraday constant, CH2 is the concentration of dissolved H2 on electrode surface, CH2sat is the saturated concentration of H2. The decrease in dissolved H2 concentration (CH2) directly lowers the ηC, thereby decreases electrode potential. In contrast, the group without SAL stripe demonstrates inefficient gas diffusion, which leads to the accumulation of dissolved H2 on the electrode surface, significantly raising the ηC and producing lower current output (Fig. 4d). Finite element simulation was employed to quantify the mass transfer improvement. As presented in Fig. S9 (Supporting information), the peak H2 concentration at electrode interface decreased dramatically from 103 mmol/L (without SAL stripe) to 41.9 mmol/L (with SAL stripe) at 1 mA/cm2. This ~59.3% reduction demonstrates significantly accelerated hydrogen diffusion away from the electrode surface. According to Eq. 13, this concentration difference corresponds to theoretical overpotential reduction of 11 mV at 298 K. This prediction closely matches the experimental potential difference observed in chronopotentiometry measurements (~13 mV, Fig. 4b), confirming that accelerated diffusion through SAL stripe directly reduces electrochemical overpotential.
Figure 4
Figure 4.
(a) Schematic diagram of experimental set-up for hydrogen evolution reaction. (b) Chronopotentiometry measurements of hydrogen evolution reaction at 1 mA/cm2. (c) Schematic diagrams of hydrogen diffusion processes in HER with SAL stripes. (d) Schematic diagrams of hydrogen diffusion processes in HER without SAL stripes.
In summary, we have demonstrated that the presence of SAL stripe with gas plastron significantly accelerate the dissolved gas diffusion, which is measured by the shrinking rate of gas bubble. The rate of gas diffusion increases with the SAL width (w) and water height (h), but decreases with the distance between bubbles and SAL stripes (d). A theoretical analysis was conducted to link the diffusion process with bubble kinetics. Moreover, we utilized the SAL stripe to enhance the diffusion of dissolved hydrogen in the hydrogen evolution reaction, thereby improving the catalytic efficiency. We believe the present work could lead to further understanding of underwater gas diffusion and offer valuable insights for applications in the fields of biomedicine, environmental management, wastewater treatment, and so on.
Declaration of competing interest
The authors declare that they have no known competing financial interests or personal relationships that could have appeared to influence the work reported in this paper.
CRediT authorship contribution statement
Lingyao Zhang: Writing – original draft, Data curation, Conceptualization. Chunhui Zhang: Writing – review & editing, Writing – original draft, Supervision, Conceptualization. Yingjia Sun: Formal analysis, Data curation. Qinglin Yang: Formal analysis, Data curation. Ziwei Guo: Formal analysis, Data curation. Xiaoqi Wang: Formal analysis, Data curation. Kang Wang: Formal analysis, Data curation. Lin Zhang: Formal analysis, Data curation. Kesong Liu: Writing – review & editing, Supervision, Formal analysis, Data curation, Conceptualization. Shichao Niu: Formal analysis, Data curation. Cunming Yu: Writing – review & editing, Writing – original draft, Supervision, Conceptualization. Lei Jiang: Supervision.
Acknowledgments
We acknowledge the financial supports form the National Natural Science Foundation (Nos. 22175011, 52472293), the China Postdoctoral Science Foundation (No. 2024M753143), the Jiangsu Province Excellent Post-Doctoral Program (No. 2024ZB457), CNPC Innovation Found (No. 2022DQ02-0611), Tianmushan Laboratory Research Project (No. TK2023C018), the Fundamental Research Funds for the Central Universities (Nos. JKF-20240560, JK2024-78), Key Science and Technology Projects for Basic and Prospective Research of CNPC (No. 2023ZZ11), the Opening Project of the Key Laboratory of Bionic Engineering (Ministry of Education) (No. K202407), Jilin University.
Supplementary materials
Supplementary material associated with this article can be found, in the online version, at doi:10.1016/j.cclet.2025.111720.
D. Wakerley, S. Lamaison, F. Ozanam, et al., Nat. Mater. 18 (2019) 1222–1227. doi: 10.1038/s41563-019-0445-x
[22]
Z. Lu, W. Xu, J. Ma, et al., Adv. Mater. 28 (2016) 7155–7161. doi: 10.1002/adma.201504652
[23]
C.H. Zhang, Z. Xu, N.N. Han, et al., Sci. Adv. 9 (2023) 10.
[24]
P.G. Matthews, R.S. Seymour, J. Insect Physiol. 56 (2010) 470–479.
[25]
A. Fick, Lond. Edinb. Dubl. Phil. Mag. 10 (1855) 30–39.
[26]
C.L. Yaws, Chapter 13 - Diffusion coefficient in water – inorganic compounds, in: C.L. Yaws (Ed.), Transport Properties of Chemicals and Hydrocarbons, William Andrew Publishing, Boston, 2009, pp. 594–596.
[27]
S.R. German, M.A. Edwards, Q.J. Chen, H.S. White, Nano Lett. 16 (2016) 6691–6694. doi: 10.1021/acs.nanolett.6b03590
H. Vogt, J. Electrochem. Soc. 137 (1990) 1179. doi: 10.1149/1.2086624
[32]
C. Gabrielli, F. Huet, R.P. Nogueira, Electrochim. Acta 50 (2005) 3726–3736.
Figure 1
(a) The plastron on the abdomen of the Water Boatman, facilitating gas exchange. Reproduced with permission [24]. Copyright 2010, Elsevier. (b) Schemes of dissolved gas diffusion of the system with and without SAL stripe. The length of the arrows indicates the strength of gas diffusion. (c) The volume of trapped bubble decreases with the time. The system with SAL stripe shows faster bubble shrinking, indicating faster gas diffusion. (d) Optical image of the SAL stripe. (e) SEM image of the SAL stripe. (f) Water contact angle in air and bubble contact angle underwater on the SAL stripe. (g) Optical images of the SAL stripe and laser-etched region. LSCM images of the SAL stripe in air (h) and underwater (i).
Figure 2
(a) The curve of V/V0versus day under the influence of w variable. (b) The curve of V/V0versus day under the influence of d variable. (c) Scheme of the influence of w on gas diffusion (lateral-view). (d) Scheme of the influence of d on gas diffusion (front-view).
Figure 3
(a) The curves of V/V0versus Day under the influence of h variable. (b) Mechanism of the influence of h on gas diffusion. (c) Theoretical results calculated by Python.
Figure 4
(a) Schematic diagram of experimental set-up for hydrogen evolution reaction. (b) Chronopotentiometry measurements of hydrogen evolution reaction at 1 mA/cm2. (c) Schematic diagrams of hydrogen diffusion processes in HER with SAL stripes. (d) Schematic diagrams of hydrogen diffusion processes in HER without SAL stripes.

 DownLoad:

 下载:
下载:


 下载:
下载:
