School of Nuclear Science and Technology, University of South China, Hengyang 421001, China
b.
School of Resources, Environment and Materials, Guangxi University, Nanning 530004, China
c.
School of Materials Science and Engineering, State Key Laboratory of Green and Efficient Development of Phosphorus Resources, Engineering Research Center of Phosphorus Resources Development and Utilization of Ministry of Education, Key Laboratory of Green Chemical Engineering Process of Ministry of Education, Hubei Key Laboratory of Plasma Chemistry and Advanced Materials, Novel Catalytic Materials of Hubei Engineering Research Center, Wuhan Institute of Technology, Wuhan 430205, China
* Corresponding authors. E-mail addresses: dqzeng@usc.edu.cn (D. Zeng)
Received Date:
05 April 2025 Accepted Date:
12 August 2025 Revised Date:
12 August 2025 Available Online:
15 May 2026
Abstract:
Coupling photocatalytic H2 generation with antibiotic degradation offers a promising strategy for addressing energy and environmental challenges, leveraging the synergistic benefits of these processes. Herein, a novel heterojunction photocatalyst consisting of ultrafine CeO2 nanoparticles anchored onto CdS nanosheets was prepared using a simple one-pot in-situ hydrothermal method, enabling the simultaneous photocatalytic H2 generation and tetracycline (TC) degradation. The H2 generation efficiency of the optimal CeO2/CdS (CC-0.10) is 3544 µmol g-1 h-1, which surpasses pure CdS by 29.3 times. Additionally, TC is degraded by CC-0.10 at a rate constant (k value) of 0.0352 min-1, 2.73 times faster than CdS (0.0129 min-1). The free radical quenching and electron spin resonance experiments revealed the active involvement of •OH and •O2- radicals in the TC degradation process. Moreover, the unique CeO2/CdS heterojunction photocatalyst was also effective in degrading TC wastewater with an H2 yield of 1374 µmol g-1 h-1, displaying its dual performance in simultaneously degrading antibiotic wastewater and producing H2. The CeO2/CdS type Ⅱ charge transfer mechanism is confirmed by XPS, EPR, KPFM, fs-TAS, and DFT calculations. This work introduces a promising approach to constructing rare-earth oxide/metal sulfide nanocomposites for addressing the interconnected challenges of energy production and environmental pollution.
The rapid expansion of industrial activities and aquaculture has exacerbated the pressing challenges of energy scarcity and antibiotic pollution [1–3]. Tetracycline, a prevalent non-biodegradable antibiotic found in wastewater, constitutes a substantial threat to public health and ecological systems [4,5]. Photocatalytic technology, with its inherent green efficiency and environmental friendliness, has positioned it as a key innovation for alleviating energy crises and treating wastewater [6–8]. In traditional photocatalytic systems, using only photogenerated electrons or holes for a single reaction often leads to underutilization of the opposite charge carrier [9–11]. Additionally, relying on sacrificial agents, which are often expensive or toxic chemicals, to enhance charge separation and accelerate specific reactions can increase costs and potential secondary pollution [12,13]. Thus, it is crucial to develop dual-functional photocatalytic systems to simultaneously utilize both electrons and holes for sustainable photocatalytic processes.
CdS is an n-type sulfide semiconductor that has garnered significant research interest due to its optimal band structure and strong absorption of visible light [14–16]. To date, research efforts have focused on utilizing CdS for photocatalytic H2 generation [15,17,18] and organic dye degradation [19]. However, the photocatalytic properties of CdS are often impeded by the high rate of charge carrier recombination and significant photocorrosion. To address these challenges, researchers have found various novel approaches for CdS, including heterojunction forming [20], cocatalyst loading [21], dye sensitization [22], and elemental doping [23,24]. Among these approaches, the construction of CdS-based heterojunction shows particular promise in enhancing visible light absorption and reducing the recombination of charge carriers [25,26]. Therefore, the pursuit of enhanced photocatalytic activity necessitates the creation of novel and extremely effective CdS-based heterojunction photocatalysts, specifically those exhibiting improved charge separation and prolonged operational stability.
CeO2 nanostructure has emerged as a highly promising catalyst due to its unique properties, including reversible Ce3+/Ce4+ redox pairs, abundant oxygen vacancies, and excellent chemical stability [27–29]. The formation of CeO2-based heterojunctions with other semiconductors often leads to enhanced photocatalytic activity by promoting charge separation. Several CeO2-based nanocomposites, such as CeO2/TiO2 [30], Fe3O4/CeO2/g-C3N4 [31], and CeO2/Bi2WO6 [32], have shown reduced charge carrier recombination rates and improved photocatalytic performances. Pairing CeO2 with CdS to construct a heterojunction is a promising strategy to enhance the charge separation efficiency of CdS photogenerated carriers [33,34]. However, interfacial barriers hinder efficient carrier migration, posing a significant challenge in enhancing photocatalytic properties through simple mechanical mixing for heterojunction construction [35]. While conventional physical mixing approaches often suffer from limitations, our previous research highlighted the advantages of in-situ synthesis methods, which facilitate closer contact between components and stronger interfacial interactions, resulting in significantly enhanced photocatalytic activities [36–38]. Therefore, employing in-situ synthesis strategies for fabricating unique CeO2/CdS heterojunctions is expected to produce highly efficient photocatalysts with improved charge separation efficiency and enhanced photoactivity.
Leveraging the benefits of heterojunction construction and in-situ synthesis, this study investigates the fabrication of novel 0D/2D CeO2/CdS heterojunctions composed of ultrasmall CeO2 nanoparticles and layered CdS nanosheets via an in-situ one-pot hydrothermal technique. The dual-functional photocatalytic activities of resulting CeO2/CdS nanocomposites are evaluated for photocatalytic H2 production and TC degradation, demonstrating superior stability and photocatalytic activity. The active radicals and degrading processes involved in TC degradation are systematically investigated. The reason for the improved photocatalytic performance is the in-situ synthesis of ultrasmall CeO2 nanoparticles on the layered CdS surface, constructing a stable heterojunction and modulating charge distribution between CeO2 nanoparticles and CdS nanosheets.
As depicted in Fig. 1a, the CeO2/CdS hybrid was fabricated through a straightforward one-pot in-situ hydrothermal synthesis. This process involved the reaction of Cd(OAc)2·2H2O, Ce(OAc)3·nH2O, and CH4N2S in ethylenediamine. To highlight the advantages of this in-situ synthesis approach, a comparative study was conducted using ex-situ prepared CeO2/CdS samples. These ex-situ samples were obtained by physically mixing different ratios of CeO2 and CdS and are denoted as CC-0.01-ex, CC-0.05-ex, CC-0.10-ex, CC-0.16-ex, and CC-0.24-ex.
Figure 1
Figure 1.
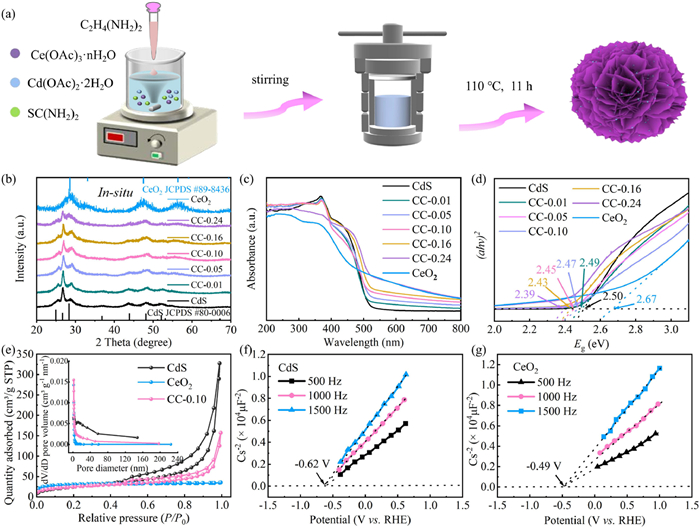
(a) Diagrammatic representation of the CeO2/CdS manufacturing process, (b) XRD patterns, (c) UV–vis spectra, and (d) corresponding Tauc plots of the photocatalysts. (e) N2 adsorption/desorption isotherm of CdS, CeO2 and CC-0.10. Mott-Schottky plots of CdS (f) and CeO2 (g).
As shown in Fig. 1b, the phase composition of the synthesized catalysts, including CdS, CC-0.01, CC-0.05, CC-0.10, CC-0.16, CC-0.24, and CeO2 (Table S1 in Supporting information), was characterized using X-ray diffraction (XRD) analysis. The XRD illustration of pristine CdS revealed diffraction peaks at 2θ values corresponding well with the standard CdS phase (JCPDS No. 80–0006). Similarly, the (111), (200), (220), (311), and (224) planes of CeO2 were identified as the diffraction peaks for pure CeO2 at 28.55°, 33.08°, 47.79°, and 56.34° (JCPDS No. 89–8436). Interestingly, all CeO2/CdS nanocomposites exhibited a mixed XRD pattern characteristic of both CdS and CeO2. The intensity of the CeO2 diffraction peaks increased with increasing Ce content. To investigate the impact of the synthesis method on the phase composition, XRD analysis was conducted on ex-situ prepared CeO2/CdS nanocomposites. Fig. S1 (Supporting information) reveals that the XRD patterns of the ex-situ synthesized CeO2/CdS photocatalysts closely resemble those of the one-pot in-situ synthesized samples, indicating that the in-situ method successfully yields the desired phase composition without significant variation.
The surface area and porous structure of CdS, CC-0.10, and CeO2 were examined utilizing isotherms for nitrogen adsorption and desorption (Fig. 1e). The mesoporous architectures of all three materials were indicated by type Ⅳ isotherms with H3 hysteresis loops at relative pressures (P/P0) ranging from 0.4 to 1.0 [36,39]. The pore size distribution curves of all samples (Fig. 1e, inset) displayed distinct peaks within the range of 2–50 nm. An analysis comparing the precise surface areas of CdS, CC-0.10, and CeO2 (Table S2 in Supporting information) revealed that the CC-0.10 (90.83 m2/g) exhibited a smaller surface area than CdS nanosheets (116.45 m2/g), while CeO2 nanoparticles displayed the smallest surface area (85.65 m2/g). These findings suggest that incorporating CeO2 nanoparticles into the CdS nanosheets resulted in a reduction in surface area, inferring that the effectiveness of the charge transfer was the key element for enhanced photocatalytic activities.
The absorbance properties of CdS, CeO2, and CeO2/CdS were examined (Fig. 1c). Pure CdS showed a stronger absorption edge at around 520 nm compared to CeO2 at 460 nm. Interestingly, the CeO2/CdS nanocomposites exhibited a higher intensity of visible light absorption than CdS, indicating that adding CeO2 nanoparticles improves the capacity of nanocomposites to absorb visible light [40,41]. According to the Kubelka-Munk equation, the bandgap energies of the synthesized materials were 2.50 eV (CdS), 2.67 eV (CeO2), 2.49 eV (CC-0.01), 2.47 eV (CC-0.05), 2.45 eV (CC-0.10), 2.43 eV (CC-0.16), and 2.39 eV (CC-0.24) for the respective samples (Fig. 1d). The narrower bandgap energies of the CeO2/CdS nanocomposites compared to both CdS and CeO2 indicate a significantly broader light absorption range. Mott-Schottky plots (Figs. 1f and g) demonstrated positive slopes for both pure CdS and CeO2, confirming the inherent semiconducting character of the n-type [42,43]. It was found that the flat band potentials (Efb) for CeO2 nanoparticles and CdS nanosheets were −0.49 V and −0.62 V, respectively. The conduction band (CB) potential and the Efb for n-type semiconductors are typically thought to be roughly identical [44]. Thus, it is predicted that the VB of CeO2 and CdS are 2.18 V and 1.88 V.
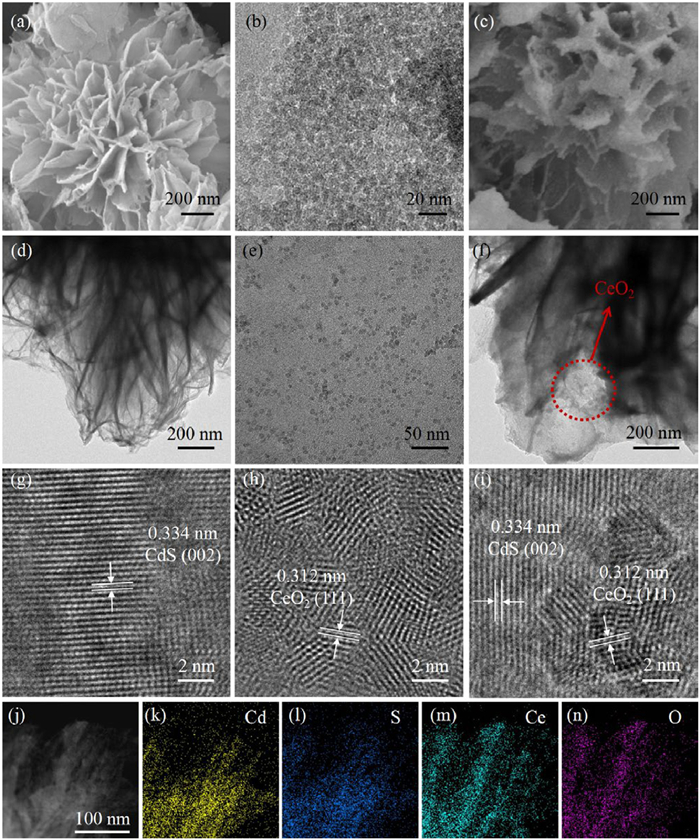
Transmission electron microscopy (TEM) and scanning electron microscopy (SEM) were used to study the morphostructure of photocatalysts. As shown in Figs. 2a and d, SEM and TEM images of CdS revealed a hierarchical nanoflower-like structure comprising nanosheets with diameters ranging from approximately 200–500 nm. A 0.334 nm-spaced lattice fringe, representing the (002) plane of CdS, was seen in the high-resolution TEM (HRTEM) picture (Fig. 2g). The morphologies of pure CeO2, as seen in TEM images (Figs. 2b and e) and SEM image (Fig. S2 in Supporting information), indicated an ultrasmall particle-like structure. An HRTEM image (Fig. 2h) revealed a lattice fringe with a spacing of 0.312 nm, consistent with the (111) plane of CeO2. The SEM and TEM images of the CC-0.10 nanocomposite (Figs. 2c and f) clearly demonstrated that the hierarchical nanoflower-like CdS was decorated with CeO2 nanoparticles on its surface, confirming the successful fabrication of the 0D/2D CeO2/CdS heterojunction. Furthermore, HRTEM analysis (Fig. 2i) revealed two tightly bonded lattice stripes with spacings corresponding to the (002) plane of CdS (0.334 nm) and the (111) plane of CeO2 (0.312 nm), indicating the formation of an intimate heterojunction that facilitates efficient charge separation. Elemental mapping analysis of CC-0.10 (Figs. 2k-n) confirmed the even dispersion of Cd, S, Ce, and O elements, following the high-angle annular dark-field (HAADF) image (Fig. 2j), further supporting the strong bond between the hierarchical CdS nanosheets and the in-situ synthesized CeO2 nanoparticles.
Figure 2
Figure 2.
SEM (a, c), TEM (b, d, e, f), and HRTEM (g, h, i) images of CdS (a, d, g), CeO2 (b, e, h), and CC-0.10 (c, f, i). HAADF image (j) and EDS elemental mapping images (k-n) of CC-0.10.
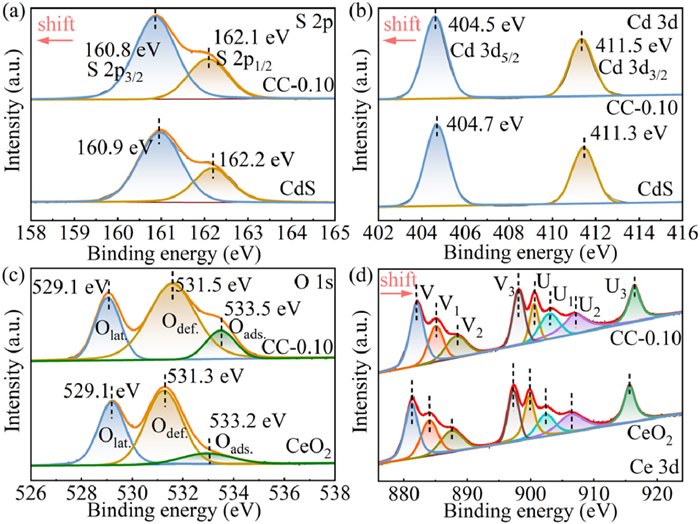
The elemental makeup and chemical states of CdS, CeO2, and the CC-0.10 nanocomposite were investigated using X-ray photoelectron spectroscopy (XPS). Following the anticipated composition of CdS and CeO2, the XPS survey spectrum (Fig. S3 in Supporting information) verified the existence of Cd, S, Ce, and O elements in the CC-0.10 nanocomposite. Analysis of the S 2p XPS spectrum (Fig. 3a) identified two peaks for CC-0.10 at 160.8 and 162.1 eV, matching the S 2p3/2 and S 2p1/2 binding energies, respectively, indicating a valence state of −2 for sulfur [45]. In the Cd 3d spectrum (Fig. 3b), two peaks were observed at 404.5 and 411.5 eV, matching the Cd 3d5/2 and Cd 3d3/2 binding energies, confirming the presence of Cd2+ in CdS [46,47]. The O 1s spectrum of CC-0.10 (Fig. 3c) exhibited three peaks at 529.1, 531.5, and 533.5 eV, corresponding to lattice oxygen, defect oxygen, and adsorbed oxygen associated with surface hydroxy groups, respectively [48]. The Ce 3d XPS spectrum (Fig. 3d) was deconvoluted into two sets of spin-orbit lines, Ce 3d3/2 and Ce 3d5/2, labeled U and V. The three characteristic peaks associated with Ce 3d3/2 were designated as U, U2, and U3, while those associated with Ce 3d5/2 were labeled V, V2, and V3 [27]. These six peaks are characteristic of Ce4+. Additionally, two peaks (U1 and V1) were attributed to Ce3+ [49]. Interestingly, Ce 3d and O 1s binding energies in the CC-0.10 exhibited a significant shift towards higher binding energy levels than CeO2, suggesting electron transfer from CeO2 to CdS. Conversely, the binding energies of S 2p and Cd 3d in CC-0.10 displayed a notable decrease compared to CdS, indicating an increase in electron density within CdS. These XPS results provide compelling evidence for a robust contact between CdS nanosheets and CeO2 nanoparticles at the interface, supporting the CeO2/CdS heterojunction to develop successfully [50,51].
Figure 3
Figure 3.
High-resolution XPS spectra of S 2p (a), Cd 3d (b), O 1s (c) and Ce 3d (d) of CdS, CeO2 and CC-0.10.
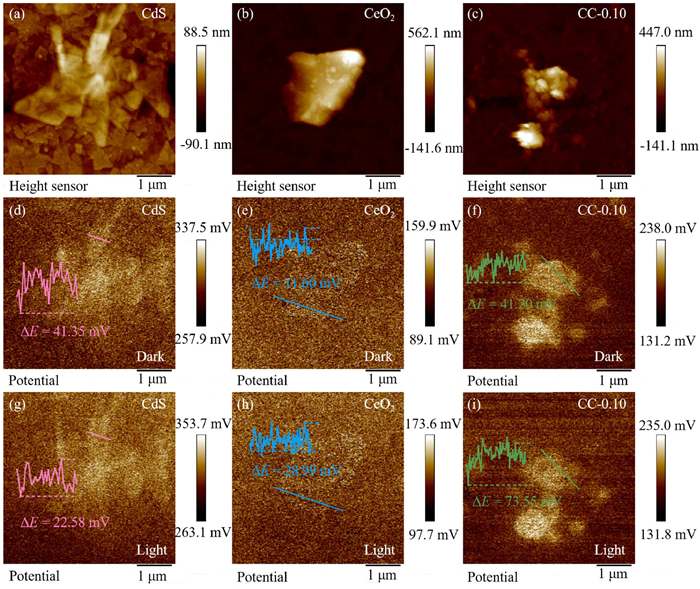
The surface potential difference and work function (WF) of the samples were investigated using Kelvin probe force microscopy (KPEM), which provided insights into the electron transfer process and the development of BIEF at heterogeneous interfaces. Figs. 4a-c show the AFM images of CdS, CeO2, and CC-0.10, respectively. The average CPD between the samples and the SCM-PIT Pt/Ir alloy probe under dark circumstances was 41.35 mV (CdS), 11.60 mV (CeO2), and 46.20 mV (CC-0.10), as illustrated in Figs. 4d-f. Therefore, the corresponding WFs for CdS and CeO2 are 4.64 and 4.61 eV, respectively, determined by the following equation: WF (eV) = 4.6 + e × CPD, where e denotes the charge of one electron and the standard electrode potential of the Pt/Ir probe is 4.6 eV [52,53]. As illustrated in Figs. 4d and g, the surface potential images of CdS were captured prior to and following photoexposure, respectively. The results showed that under photoexposure conditions, the CPD between the probe and CdS is more negative. This indicates that upon exposure to light, the surface of CdS has a buildup of photogenerated electrons. Fig. 4h shows the surface potential image of CeO2 after light irradiation. In contrast, CC-0.10 exhibited a more positive CPD when under light than before light (Figs. 4f and i). This implies that a significant amount of photogenerated electrons migrate to CeO2 along the electron migration channel of the CeO2/CdS heterojunction [54,55]. These findings provide compelling evidence for CeO2/CdS heterojunction generation.
Figure 4
Figure 4.
(a-c) AFM images of CdS, CeO2, and CC-0.10, and corresponding KPFM surface potential distributions for (d-f) dark conditions and (g-i) light conditions.
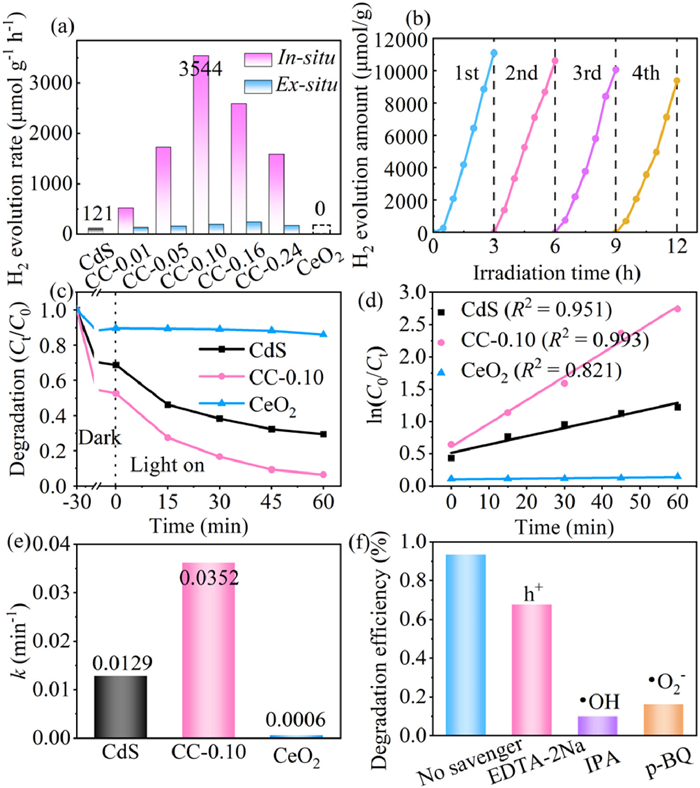
The H2 production efficiency of the CdS, CeO2, and CeO2/CdS photocatalysts was assessed under visible light irradiation (Fig. 5a). Initially, the pristine CdS exhibited a modest H2 generation rate of 121 µmol h−1 g−1, while pure CeO2 showed no photocatalytic activity for H2 production. However, the optimized CC-0.10 sample displayed a significantly enhanced H2 generation rate of 3544 µmol h−1 g−1, a 29.3-fold rise in contrast to CdS. Importantly, the H2 generation rates of the in-situ synthesized CC-0.01, CC-0.05, CC-0.10, CC-0.16, and CC-0.24 photocatalysts were 4.0, 10.8, 17.9, 10.6, and 8.9 times higher, respectively, than their ex-situ counterparts. These results suggest that the in-situ synthesis method leads to improved intimate heterointerface formation and enhanced charge separation. In addition, wavelength-dependent hydrogen production measurements (Fig. S4 in Supporting information) for CC-0.10 revealed the highest activity at 450 nm and significant activity within the 420–520 nm range, demonstrating its reliance on the visible light spectrum for photocatalysis. Furthermore, the prepared CeO2/CdS demonstrated superior photocatalytic H2 generation performance compared to previously reported CdS-based photocatalysts (Table S3 in Supporting information). The H2 generation efficiency of CC-0.10 was examined over four cycles to assess the stability and reusability of the CeO2/CdS nanohybrid (Fig. 5b). The photocatalytic H2 production efficiency remained above 80% after four cycles. XRD analysis (Fig. S5 in Supporting information) confirmed that the crystal structure of CC-0.10 remained unchanged after multiple cycling runs, indicating its structural stability and potential for long-term use in photocatalytic applications.
Figure 5
Figure 5.
(a) Comparison of the rate of H2 creation during photocatalysis. (b) Photocatalytic cycling runs of CC-0.10 under visible light. (c) Photocatalytic activities of CdS, CeO2, and CC-0.10 for TC degradation. (d) Kinetic analysis, (e) quasi-first-order kinetic constant, (f) trapping experiments of active species.
The photocatalytic degradation capability of the CdS, CeO2, and CeO2/CdS was assessed using tetracycline (TC) as the target pollutant. CdS exhibited a significantly higher TC removal rate (70.51%) compared to CeO2 (13.94%), as demonstrated in Fig. 5c. Notably, the CC-0.10 exhibited a substantial enhancement in TC degradation efficiency, reaching 93.56%, surpassing both pure CdS and CeO2. Kinetic analysis of the degradation process (Figs. 5d and e) revealed that the CC-0.10 sample displayed the highest kinetic constant (k) value of 0.0352 min−1, surpassing CdS (0.0129 min−1) and CeO2 (0.0006 min−1) by 2.73 and 58.67 times, respectively. Using EDTA-2Na (h+ scavenger), IPA (•OH scavenger), and p-benzoquinone (p-BQ) (•O2- scavenger) radical trapping tests were carried out to determine the active species involved in the photocatalytic process of TC degradation (Fig. 5f). The addition of EDTA-2Na, IPA, and p-BQ resulted in a 25.87%, 83.40%, and 77.35% decrease in TC degradation rate, respectively, compared to the experiment without scavengers. This confirms the involvement of h+, •OH, and •O2- radicals within the degradation process of photocatalysis, with •OH and •O2- playing a dominant role.
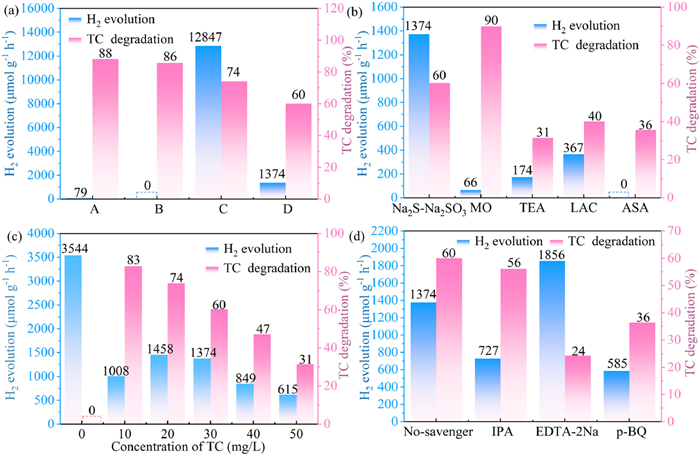
Based on the observed H2 generation activity and TC removal performance of the CeO2/CdS nanocomposite, a number of tests were carried out to examine its ability to simultaneously carry out photocatalytic H2 production and TC degradation. To evaluate this dual functionality, TC and the sacrificial agent Na2S-Na2SO3 were employed as the target solution. As shown in Fig. 6a, in the presence of TC alone, the H2 evolution rate was 79 µmol h−1 g−1 in the range of 350–780 nm and 0 µmol h−1 g−1 with the UV cut-off filter (λ > 420 nm), while TC removal rates were 88.2% and 85.8%, respectively. With UV cut-off filters (λ > 420 nm), the photocatalytic hydrogen production rate decreased significantly compared to full-spectrum irradiation, confirming the contribution of UV light to the overall activity. However, when both TC and Na2S-Na2SO3 were present, the H2 evolution rates significantly increased to 12,847 µmol h−1 g−1 (350 nm > λ > 780 nm) and 1374 µmol h−1 g−1 (λ > 420 nm), while TC removal rates were 73.9% and 60.0%, respectively. This observation suggests that adding a hole scavenger (Na2S-Na2SO3) might inhibit TC degradation. For TC degradation and simultaneous H2 production, the CeO2/CdS demonstrated better synergistic photocatalytic efficacy than other photocatalysts (Table S4 in Supporting information). To assess the influence of different sacrificial agents on H2 evolution and TC degradation efficiency, some common sacrificial agents were investigated, including Na2S-Na2SO3, methyl orange (MO), triethylamine (TEA), lactate (LAC), and ascorbic acid (ASA) (Fig. 6b). The H2 production rate was significantly higher with Na2S-Na2SO3 compared to other sacrificial agents, with no H2 production observed when ASA was used. The highest TC removal efficiency (90%) was achieved with MO as the sacrificial agent.
Figure 6
Figure 6.
Influence of reaction conditions on the photocatalytic activity of CeO2/CdS for simultaneous H2 evolution and tetracycline degradation. (a) Solution (A: TC alone, no UV cut-off filter; B: TC alone, with the UV cut-off filter; C: TC + Na2S-Na2SO3, no UV cut-off filter; D: TC + Na2S-Na2SO3, with UV cut-off filter). (b) Sacrificial agents. (c) TC concentration. (d) Scavengers.
To investigate the connection between TC concentration and action of photocatalysis, a gradient study was conducted utilizing TC concentrations between 0 and 50 mg/L (Fig. 6c). Interestingly, the maximum H2 evolution rate of 3544 µmol h−1 g−1 was observed when no TC was present (at a TC concentration of 0 mg/L), suggesting that TC acts as a competitive inhibitor for H2 production. A decrease in the H2 evolution rate was observed with increasing TC concentrations, while TC removal rates were higher at lower concentrations, suggesting that the capacity of CeO2/CdS for TC removal is limited and may be affected by the concentration of the target pollutant [56]. To elucidate the synergistic mechanism, quenching experiments were performed and illustrated in Fig. 6d. Adding EDTA-2Na and p-BQ significantly inhibited TC degradation, suggesting that h+ and •O2- play a major role in TC degradation during the dual-functional photocatalytic process. Interestingly, the addition of EDTA-2Na led to a significant improvement in H2 yield, which is attributed to the scavenging of holes by EDTA-2Na, resulting in more photogenerated electrons on CC-0.10 available for water reduction. The addition of IPA had no significant effect on TC degradation, indicating that •OH may not be the active species in this dual reaction. The presence of TC acts as a hole scavenger, promoting its own degradation and making it easier for photogenerated electrons to go to the H2 development. This synergistic effect results in dual-photocatalytic applications for both pollutant degradation and H2 generation.
The degradation pathway of TC (m/z 445) by CdS/CeO2 was investigated using HPLC-MS analysis (Figs. S6 and S7 in Supporting information). Two primary degradation pathways were identified. Pathway Ⅰ: •O2- attacks the phenol groups of TC, forming a macromolecular intermediate P2 (m/z 475). Further oxidation converts P2 to P3 (m/z 459). Subsequent cleavage of P3, accompanied by the loss of hydroxyl groups, generates smaller molecules P4 (m/z 344) and P5 (m/z 300) [57]. Pathway Ⅱ: Double bond oxidation and •OH attack lead to the formation of hydroxyl and keto groups, resulting in the hydroxylated product macromolecule P10 (m/z 461) [58]. P10 undergoes N-demethylation, deamidation, and dehydroxylation through h+ attack, yielding P11 (m/z 400) [59]. Further dihydroxylation converts P11 to P12 (m/z 386), and subsequent ring opening and hydroxyl group modification generates P13 (m/z 301) [32]. Finally, both pathways lead to the formation of smaller organic molecules (P10, m/z 141; P11, m/z 149; P12, m/z 114; and P13, m/z 165) from intermediates with molecular weights greater than 300. The mineralization efficiency of CdS/CeO2 (CC-0.10) for TC degradation, assessed by total organic carbon (TOC) removal (Fig. S8 in Supporting information), reached 52.46% after being exposed to visible light for 60 min. This represents a 1.95-fold increase compared to CdS and a 9.65-fold increase compared to CeO2. These smaller organic molecules can be further mineralized to CO2 and H2O under the action of •O2-, •OH, and h+ [60,61].
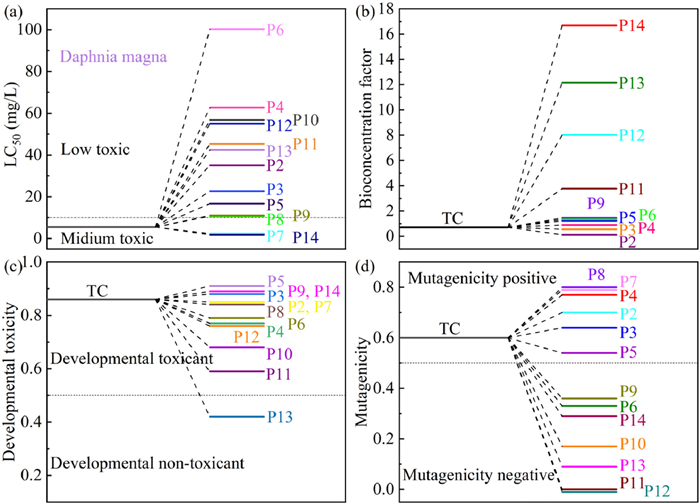
To evaluate the ecotoxicity of TC and its metabolites, the Toxicity Estimation Software Tool (T.E.S.T., Version 5.1.2) is used to compute four toxicity indicators: mutagenicity, developmental toxicity, bioaccumulation factor, and Daphnia magna LC50 (48 h). Predicted by quantitative structure-activity relationships (QSAR) from the U.S. Environmental Protection Agency database (EPA) [62,63]. For TC, the Daphnia magna LC50 (48 h) value was 5.44 mg/L, which is moderately toxic (Fig. 7a). However, after photocatalytic degradation, most of the intermediates showed low toxicity properties. Fig. 7b shows that CC-0.10 composites are effective in reducing the bioaccumulation factor of most intermediates. As shown in Fig. 7c, TC exhibited some developmental toxicity. Most intermediates of TC degradation showed a decreasing trend of toxicity, and the overall trend was non-toxic. Furthermore, the photocatalytic degradation of CC-0.10 resulted in a notable reduction in the mutagenicity of the intermediates, which was found to be less than TC. Additionally, P6, P9, P10, P11, P12, P13, and P14 exhibited a distinct negative mutagenicity profile (Fig. 7d). Therefore, the above results of toxicity analysis can be concluded that the CeO2/CdS photodegradation system decreases the toxicity of intermediates while mineralizing part of them into CO2 and H2O [64]. In addition, to better evaluate the environmental friendliness of the CeO2/CdS photocatalytic system, the toxicity of TC intermediates was assessed using mung bean seed germination and growth experiments. As shown in Fig. S9 (Supporting information), the untreated TC solution severely inhibited mung bean growth, resulting in stunted seedlings, discoloration, and a lack of leaf development. In contrast, both the control and photocatalytically treated groups exhibited healthy growth, comparable stem elongation, and leaf formation, indicating negligible toxicity of the degraded products. These results strongly suggest that the CeO2/CdS photocatalytic system effectively detoxifies TC by degrading it into non-toxic intermediates, thus significantly reducing its aquatic ecotoxicity.
Figure 7
Figure 7.
(a) Daphnia magna LC50 (48 h), (b) bioaccumulation factor, (c) development toxicity, and (d) mutagenicity of TC and its degradation intermediates for CC-0.10.
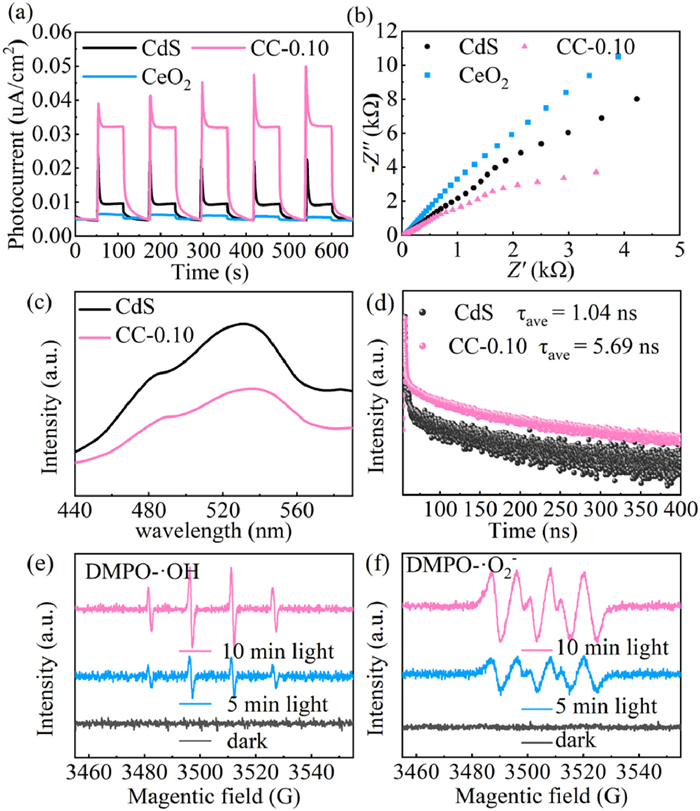
To assess the effectiveness of charge separation and transfer, photoelectrochemical tests were carried out. Fig. 8a illustrates a clear trend in the photocurrent intensity: CeO2 < CdS < CC-0.10. The formation of the CeO2/CdS interface plays a crucial role in facilitating charge carrier transport and reducing electron-hole pair recombination [65–67]. The photocurrent curves of the samples show an anodic photocurrent spike immediately after the onset of irradiation, which is caused by the separation of electron-hole pairs at the interface of the catalyst/electrolyte. As depicted in Fig. 8b, the Nyquist plot of CC-0.10 shows a smaller semicircle radius than pristine CdS and CeO2, indicating significantly lower charge transfer resistance [68,69]. Fig. 8c displays the PL spectra of CdS and CC-0.10. Compared to CdS, the PL intensity of CC-0.10 is significantly reduced, suggesting enhanced electron-hole pair separation due to the incorporation of CeO2 [70,71]. These findings are further supported by TRPL spectra (Fig. 8d) and Table S5 (Supporting information). Compared to CdS (1.04 ns), the average lifetime (τave) of CC-0.10 (5.69 ns) is significantly longer, indicating the CeO2/CdS heterojunction facilitates effective interfacial charge transfer [72]. These findings collectively provide compelling evidence for the enhanced migration and separation of photogenerated carriers facilitated by CeO2/CdS heterojunction formation. Electron paramagnetic resonance (ESR) spectroscopy detected reactive radicals during the photocatalytic reaction. Figs. 8e and f show that CC-0.10 does not show DMPO-•OH and DMPO-•O2- signals without light. However, under visible light irradiation, the ESR spectra of CC-0.10 clearly exhibit DMPO-•OH and DMPO-•O2- signals. The peak intensities increase with light exposure time, confirming the generation of both •OH and •O2- during the photoexcitation process [73,74].
Figure 8
Figure 8.
Photocurrent response (a), EIS plots (b) of CdS, CeO2 and CC-0.10. PL (c) and TRPL (d) decay curves of CdS and CC-0.10. ESR spectra of CC-0.10 for DMPO-•OH (e) and DMPO-•O2- (f).
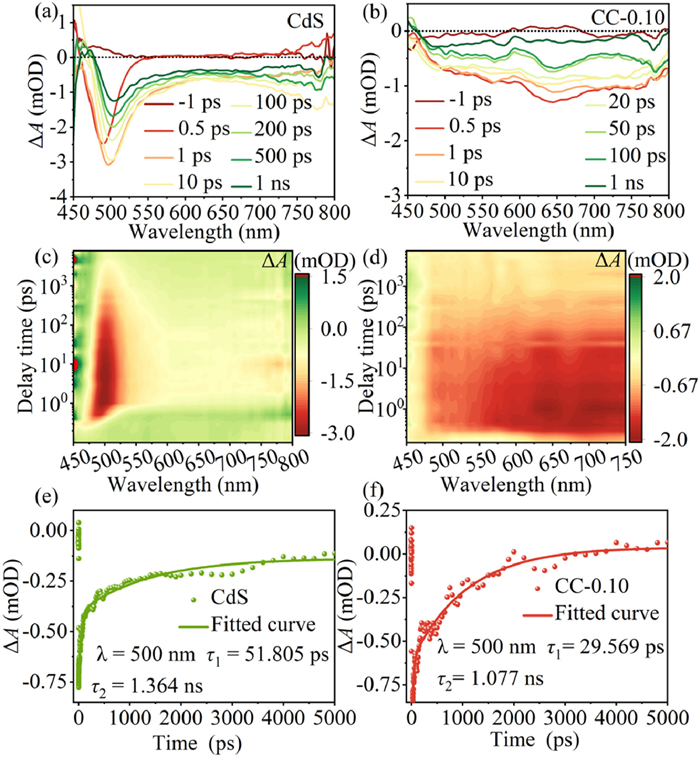
The femtosecond time-resolved transient absorption spectroscopy (fs-TAS) was employed to gain a deeper understanding of the photogenerated carrier dynamics that support the exceptional photocatalytic activity and stability of CeO2/CdS. Figs. 9a and c depict the CdS excitation of a 360 nm pump pulse with a significant negative peak at the wavelength between 470 nm and 540 nm, with the greatest absorption peak at 500 nm at various representative probe delays (0.5 ps to 5 ns). This signal can be attributed to the ground state bleach (GSB), representing the relaxation of the excited state [75,76]. For CC-0.10 shown in Figs. 9b and d, a larger wavelength range of the GSB signal can be clearly observed. A kinetic decay curve was fitted at 500 nm using a double exponential function, as shown in Figs. 9e and f. The time constants of τ1 (51.81 ps) and τ2 (1.34 ns) for CdS are related to the respective shallow electron capture and photogenerated carrier recombination [77,78]. The relaxation lifetimes of the carriers in CC-0.10 are significantly shorter compared to those of pristine CdS, suggesting that the introduction of CeO2 can significantly speed up the electron relaxation process [79]. The electric field at the interface is thought to accelerate electron migration and transfer, which can drastically alter the electrons' relaxation behavior and cause the accelerating impact of electron relaxation in the CC-0.10 composites [80,81]. This finding confirms the establishment of a tight heterojunction by showing that photogenerated electron migration takes place at the coupled contact between CdS and CeO2.
Figure 9
Figure 9.
TA spectra of CdS (a) and CC-0.10 (b). 2D mapping TA spectra of CdS (c) and CC-0.10 (d). Typical TA dynamics were probed at 500 nm for CdS (e) and CC-0.10 (f).
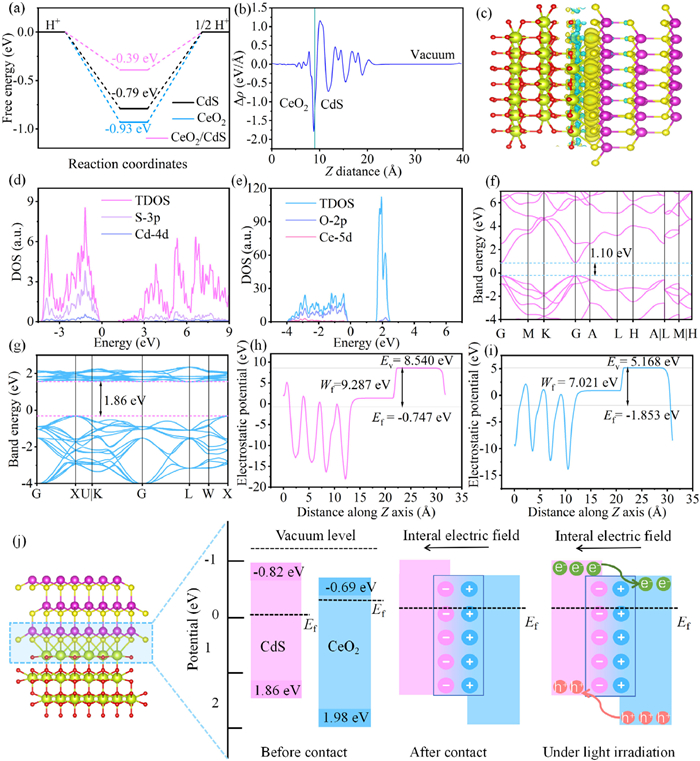
To gain deeper insight into the inherent electrical characteristics of CdS, CeO2, and CeO2/CdS, density functional theory (DFT) calculations with the code of Quantum Espresso were carried out [82]. The DFT-optimized structures of CdS, CeO2, and CeO2/CdS are presented in Fig. S10 (Supporting information). For H2 generation through water splitting, a Gibbs free energy of H2 adsorption closer to zero indicates a more favorable reaction rate for H2 evolution [83,84]. Calculations reveal (Fig. 10a) that the Gibbs free energy of H* in the CeO2/CdS heterostructure is −0.39 eV, closer to zero compared to CdS (−0.79 eV) and CeO2 (−0.93 eV). This suggests enhanced desorption of H2 from the heterostructure, highlighting the crucial role of H+ and H2 adsorption in the H2 evolution reaction [67]. Charge density difference diagrams (Figs. 10b and c) clearly illustrate charge redistribution primarily at the interface between CdS (002) and CeO2 (111), where electrons are transferred from the CeO2 (111) to the CdS (002) surface. This observation aligns with the findings from the XPS analysis. Bader charge calculations confirm this charge transfer, quantifying it at 0.0303 e/Å from the CeO2 (111) to the CdS (002) surface.
Figure 10
Figure 10.
(a) Gibbs free energy. (b) Plane-averaged charge density plot of CeO2 (111)/CdS (002). (c) Differential charge density map of CeO2 (111)/CdS (002) interface. The cyan region indicates charge depletion, the yellow region indicates charge accumulation and the isosurface value is set to 0.003 e/Å3. DOS of the (d) CdS and (e) CeO2. Band structures of the (f) CdS and (g) CeO2. Calculated working function of the (h) CdS and (i) CeO2. (j) Energy level diagrams between CdS and CeO2.
Analysis of the DOS plots (Figs. 10d and e) reveals that the conduction band (CB) electronic hybridization of CdS is mostly controlled by S 3p and Cd 4d orbitals, while the CB edge of CeO2 is primarily made up of O 2p and Ce 5d orbitals. As depicted in Figs. 10f and g, the band gaps of CdS and CeO2 were reckoned to be 1.10 and 1.86 eV, using the hybrid generalized HSE06 functional. These values are lower than those obtained from UV–vis characterization (2.50 and 2.67 eV) due to the inherent limitations of the generalized gradient approximation (GGA) [85]. Further computations determined that the work functions of CdS and CeO2 were 9.287 and 7.021 eV, respectively, relative to vacuum energy and Fermi energy levels (Figs. 10h and i). The difference in Fermi energy levels arising from the work function disparity drives charge migration at the interface upon contact between CdS and CeO2. Electrons from CeO2 (111) transfer to the CdS (002) until equilibrium is reached, aligning the Fermi energy levels of the two materials. This observation is consistent with the differential charge density and Bader charge calculations. The specific charge transfer pathway within the CeO2/CdS heterojunction is illustrated in Fig. 10j. When CdS and CeO2 come into close contact, electrons move from CeO2 to CdS until their Fermi energy levels are equal. This electron transfer process leads to an electron depletion layer in CeO2 and an electron accumulation layer in CdS, establishing an internal electric field directed from CeO2 to CdS. The electric field causes downward band bending in CdS and upward band bending in CeO2. When exposed to light, electrons in both materials move to CB levels, creating gaps in the VB in the VB levels. The electrons then move from CdS to CeO2, where a reduction reaction occurs, while the holes move from CeO2 to CdS, facilitating an oxidation reaction. These above findings indicate that CeO2/CdS forms a type-Ⅱ heterojunction, effectively preventing the recombination of electron-hole pairs, and enabling their transfer to the respective reduction and oxidation active sites, ultimately enhancing the photocatalytic activity.
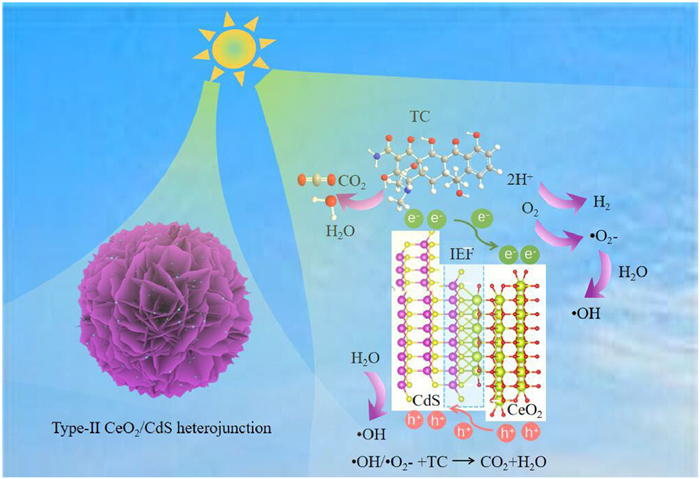
Drawing on the findings of our investigation, we suggest a photocatalytic reaction mechanism for the 0D/2D CeO2/CdS nanocomposite, illustrated in Fig. 11. The CeO2 nanoparticles loaded onto CdS nanosheets construct a type-Ⅱ heterostructure. This heterojunction successfully inhibits photogenerated carriers from recombining and enhances the photocatalytic activity [86]. Results from differential charge density and work function measurements indicate that electrons transfer from CeO2 nanoparticles to CdS nanoflowers when they are closely bound together. In the presence of visible light, electrons within the valence band (VB) of CdS and CeO2 are excited to the conduction band (CB), thereby creating holes in their respective VBs. The photoexcited electrons in the CB of CdS migrate to the CB of CeO2 due to energy band bending, Coulombic interactions, and an inherent electric field, whereas the photoexcited holes in the CeO2 VB migrate to the CdS VB. During the simultaneous H2 production and TC degradation, the accumulated photoexcited electrons in the CB of CeO2 participate in photocatalytic H2 production, and the TC consumes a large number of holes in the VB of CdS to prevent combination with photogenerated electrons. Furthermore, the generated active radicals such as •O2- and •OH would also be accountable for the TC degradation into CO2 and H2O.
Figure 11
Figure 11.
The possible photocatalytic mechanism over 0D/2D CeO2/CdS.
In this work, we have successfully synthesized 0D/2D CeO2/CdS photocatalysts through a facile one-pot hydrothermal approach, demonstrating enhanced photocatalytic activity for simultaneous H2 generation and degradation of TC. The optimized CeO2/CdS nanocomposite (CC-0.10) exhibited exceptional H2 production activity, achieving a rate 29.3 times greater than pure CdS while evidencing excellent stability and recyclability. Furthermore, the highest kinetic constant (k) value constant for TC degradation using CC-0.10 was 2.73 times more than CdS. Moreover, the factors influencing the dual functionality of the CeO2/CdS nanocomposite for simultaneous photocatalytic H2 production and TC degradation were investigated. Free radical quenching and EPR experiments proved the active roles of •O2-, h+, and •OH in the photodegradation of TC. Compared with pristine CdS, fs-TAS evidenced that CC-0.10 could accelerate the efficient separation and transfer of excitons. A type-Ⅱ heterojunction electron transfer pathway across the CeO2/CdS interface was verified by XPS, KPFM, and DFT calculations, which effectively inhibits electron-hole recombination and enhances photocatalytic efficiency. LC-MS analysis and toxicity assessment of the TC degradation intermediates indicated that the CeO2/CdS nanocomposites not only reduced the molecular weight of the intermediates but also mineralized them into carbon dioxide and water. This work provides concrete evidence for the feasibility of 0D/2D CeO2/CdS heterojunctions in the photocatalytic degradation of antibiotic wastewater while simultaneously producing H2.
Declaration of competing interest
The authors declare that they have no known competing financial interests or personal relationships that could have appeared to influence the work reported in this paper.
This work was supported by the National Natural Science Foundation of China (Nos. 52102092 and 62004143), the National Key R&D Program of China (No. 2022YFB3506100), the Key R&D Program of Hubei Province (No. 2022BAA084), the Key Project of Scientific Research Plan of Hubei Provincial Department of Education (No. D20241501) and the Natural Science Foundation of Hunan Province (No. 2025JJ50260).
Supplementary materials
Supplementary material associated with this article can be
found, in the online version, at doi:10.1016/j.cclet.2025.111717.
D. Shakya, R.K. Shukla, S. Kumar, et al., J. Ind. Eng. Chem. 132 (2024) 304–317. doi: 10.1016/j.jiec.2023.11.023
Figure 1
(a) Diagrammatic representation of the CeO2/CdS manufacturing process, (b) XRD patterns, (c) UV–vis spectra, and (d) corresponding Tauc plots of the photocatalysts. (e) N2 adsorption/desorption isotherm of CdS, CeO2 and CC-0.10. Mott-Schottky plots of CdS (f) and CeO2 (g).
Figure 2
SEM (a, c), TEM (b, d, e, f), and HRTEM (g, h, i) images of CdS (a, d, g), CeO2 (b, e, h), and CC-0.10 (c, f, i). HAADF image (j) and EDS elemental mapping images (k-n) of CC-0.10.
Figure 4
(a-c) AFM images of CdS, CeO2, and CC-0.10, and corresponding KPFM surface potential distributions for (d-f) dark conditions and (g-i) light conditions.
Figure 5
(a) Comparison of the rate of H2 creation during photocatalysis. (b) Photocatalytic cycling runs of CC-0.10 under visible light. (c) Photocatalytic activities of CdS, CeO2, and CC-0.10 for TC degradation. (d) Kinetic analysis, (e) quasi-first-order kinetic constant, (f) trapping experiments of active species.
Figure 7
(a) Daphnia magna LC50 (48 h), (b) bioaccumulation factor, (c) development toxicity, and (d) mutagenicity of TC and its degradation intermediates for CC-0.10.
Figure 8
Photocurrent response (a), EIS plots (b) of CdS, CeO2 and CC-0.10. PL (c) and TRPL (d) decay curves of CdS and CC-0.10. ESR spectra of CC-0.10 for DMPO-•OH (e) and DMPO-•O2- (f).
Figure 9
TA spectra of CdS (a) and CC-0.10 (b). 2D mapping TA spectra of CdS (c) and CC-0.10 (d). Typical TA dynamics were probed at 500 nm for CdS (e) and CC-0.10 (f).
Figure 10
(a) Gibbs free energy. (b) Plane-averaged charge density plot of CeO2 (111)/CdS (002). (c) Differential charge density map of CeO2 (111)/CdS (002) interface. The cyan region indicates charge depletion, the yellow region indicates charge accumulation and the isosurface value is set to 0.003 e/Å3. DOS of the (d) CdS and (e) CeO2. Band structures of the (f) CdS and (g) CeO2. Calculated working function of the (h) CdS and (i) CeO2. (j) Energy level diagrams between CdS and CeO2.

 DownLoad:

 下载:
下载:


 下载:
下载:
