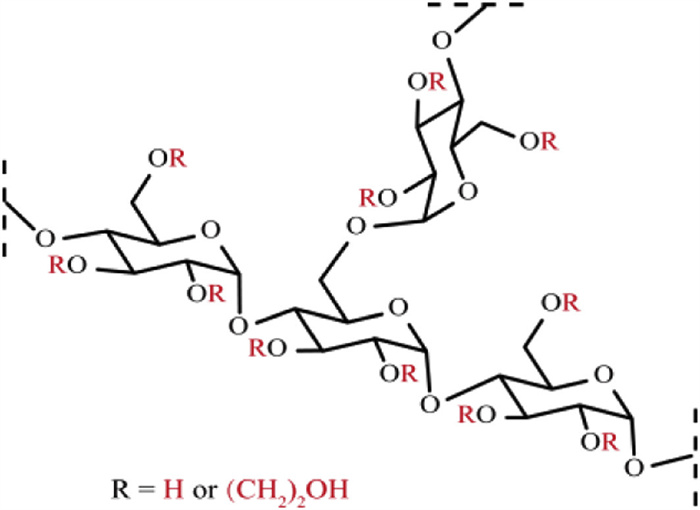
Figure 1.
Structure of hydroxyethyl starch.
Full-profile bioanalysis of polydisperse macromolecular hydroxyethyl starch 130/0.4 in rat plasma via LC-IS-CID coupled with MRM
Xin Xu , Huan Yang , Jiachong Chi , Xiangjun Meng , Jingkai Gu

Polysaccharides, the most abundant natural carbohydrate polymers, exhibit broad-spectrum pharmacological activities - including antitumor, immunomodulatory, antibacterial, and antioxidant properties [1–3], making them attractive candidates for drug development. Their biocompatibility underlies its utility in biomedical applications, including colloidal plasma expanders and drug delivery systems [4–6]. Characterizing polysaccharide pharmacokinetics (PK) requires quantification of intact macromolecule, yet analytical challenges persist due to polydispersity, structural complexity, low ionization efficiency, and chromophore absence. Current methods rely on indirect quantification via hydrolytic cleavage into monosaccharides/oligosaccharides, requiring rigorous optimization to control the generation of hydrolysis products [7], yet reproducibility remains elusive [8]. Derivatization steps, often required to enhance sensitivity/separation, entail labor-intensive procedures and byproduct formation, thereby increasing the risk of assay bias [9,10].
Hydroxyethyl starch 130/0.4 (HES130/0.4) is a derivative of polysaccharide. It is derived from the chemical denaturation of starch molecules, a process that involves the incorporation of hydroxyethyl groups (HE) at the C2, C3, or C6 free hydroxyl positions (Fig. 1), with a compact hyperbranched structure of 14.74 ± 2.01 nm in diameter [11]. Its high molecular weight (130,000 ± 20,000 Da) and amylase resistance (molar substitution = 0.4, C2/C6 = 9) endows HES130/0.4 with prolonged intravascular retention and sustained oncotic pressure maintenance, enabling its clinical use as an intravenous volume expander to treat hypovolemic shock in trauma or hemorrhagic scenarios [12,13]. Moreover, HES130/0.4 is a promising drug delivery platform [14–16]. Notably, the osmotic effect of HES130/0.4 depends on the number of particles present in the circulation [17], indicating that efficacy is fundamentally dependent on circulating macromolecular HES130/0.4. Its half-life dictates expansion duration. However, its structural complexity - characterized by high molecular weight and polydispersity - poses significant challenges for direct chemical analysis and quantification.
As shown in Table 1, current bioanalytical methods for detecting HES in biological matrices predominantly employ indirect approaches involving hydrolysis or enzymatic conversion to glucose/oligosaccharides, followed by colorimetric, enzymatic, or mass spectrometry quantification [18–26]. These indirect methods are typically intricate and time-consuming. Due to the lack of standards for specific hydrolysis products, such as HE-substituted glucose, indirect quantification of HES can only be achieved by measuring the amount of glucose. In this case, endogenous glucose or glycogen that exists in the biological matrix can confound the assay, leading to suboptimal specificity. Owing to its complex macromolecular structure and inherent polydispersity, fully profiling HES presents a significant challenge. Only a limited number of studies have employed direct analysis (Table 1). A colorimetric assay was used to quantify HES in plasma, but it suffered from poor specificity. The in-source fragmentation strategy enables direct urinary HES detection with minimal sample preparation. However, such approaches exhibit narrow dynamic ranges and insufficient sensitivity for complex biological matrices like plasma.
 DownLoad:
CSV
DownLoad:
CSV
| No. | Method | Column | Mobile phase | Sample preparation | Internal Standard | LOQ (µg/mL) | Linearity range (µg/mL) |
Biological sample type | Application | Ref. |
| 1 | LC-IS-CID-MS/MS | XAmide (100 × 3 mm, 5 µm) | (A) 0.1% FA in water, (B) acetonitrile (ACN) | Protein precipitation |
Xylotetraose | 40 | 40-4000 | Plasma | Plasma PK study in rat | This work |
| Indirect method | ||||||||||
| 2 | Hydrolysis | _ | _ | Acetone precipitation; trifluoroacetic acid hydrolysis | _ | _ | Not mentioned | Plasma and urine | Plasma PK and urinary excretion studies in subjects | [18] |
| 3 | Hydrolysis | _ | _ | Acetone precipitation; trifluoroacetic acid hydrolysis | _ | 80 | Not mentioned | Plasma and urine | Plasma PK and urinary excretion studies in subjects | [19] |
| 4 | Benedict’s reaction | _ | _ | Water dilution; HCl hydrolysis (60 min boil); NaOH neutralization; Benedict's reagent addition (8 min boil) | _ | _ | _ | Urine | HES screening of athletes | [24] |
| 5 | LC-MS (APCI) | Microsorb amine-type column (100 × 4.6 mm, 3 µm) | (A) 1% acetic acid in water, (B) ACN | HCl hydrolysis (30 min, 80 ℃); evaporated | Glucose-13C6 | _ | _ | Urine | Detection of HES | [25] |
| 6 | GC-MS | HP 5 MS capillary column (16 m × 0.25 mm, 0.25 µm (film thickness)) | _ | HCl hydrolysis (1 h, 100 ℃); dried; derivatization | _ | _ | _ | Urine | HES screening of athletes | [21] |
| 7 | MALDI-TOF MS | _ | _ | Partial TFA hydrolysis (30 min, 100 ℃); dried; resuspended in analytical matrix | _ | _ | _ | Urine | Detection of HES | [22] |
| 8 | LC-MS | Polaris 5 NH2 column (150 × 2.1 mm, 5 µm) | (A) 5 mmol/L ammonium formate, 0.1% FA in H2O, (B) 0.1% FA in ACN | Incubated with α-amylase/dextranase (37 ℃, 60 min), addition of internal standard, evaporation and redissolution | Glucose-13C6, Mannitol-13C1 |
_ | _ | Urine | Detection of HES | [26] |
| Direct approach | ||||||||||
| 1 | Lugol's iodine solution | _ | _ | Mix plasma with 10% TCA; centrifuge; mix the supernatant with LUGOL; measure the OD at 530 nm | _ | Not mentioned | Not mentioned | Plasma | Detection of HES | [20] |
| 2 | LC-(IS-CID)-MS/MS | Phenomenex Onyx monolithic C18 column (100 × 4.6 mm) | (A) ammonium acetate buffer (5 mmol/L, 0.1% of glacial acetic acid; pH = 3.5), (B) ACN | Mixed directly with the internal standard; injected | β-Cyclodextrin | 10 | 100-1000 | Urine | Detection of HES | [27] |
| 3 | LC–(IS-CID)–TOF MS | Ultra hydrogel DP guard column (40 × 6 mm) | (A) 5 mmol/L ammonium formate, 0.1% FA in H2O, (B) ACN | Diluted, centrifuged; injected | _ | 250 | 250-10,000 | Urine | Screening HES | [23] |
This study introduces a tailored method for macromolecular HES130/0.4 quantification, combining protein precipitation, high performance liquid chromatography (HPLC) separation, and in-source collision-induced dissociation (IS-CID) integrated with multiple reactions monitoring (MRM) techniques. Optimized column gradients eluted polydisperse HES130/0.4 as a single symmetric peak. IS-CID converts HES130/0.4’s complex precursor ions to a limited number of common characteristic fragments for MRM quantification. The workflow was validated and successfully applied to investigate the PK of HES130/0.4 in rats, revealing its large distribution volume and rapid elimination within 24 h. This full-profile direct method simplifies sample processing while preserving intact HES130/0.4 in biological matrices, yielding PK data closer to the actual situation, thereby enabling precise elucidation of the pharmacokinetics-pharmacodynamics (PK-PD) correlation. Additionally, it establishes a benchmark for comprehensive polysaccharide direct quantification.
We conducted a comprehensive characterization and analysis of the parent ion profile of HES130/0.4 using mass spectrometry. HES130/0.4 is a macromolecular polysaccharide, exhibiting polydispersity through variations in the molecular weight, the number of charges acquired during ionization, and the types of adduct ions formed, which complicates the identification of precursor ions for quantification purposes. Furthermore, like other polysaccharides, HES130/0.4 is highly susceptible to fragmentation within the ion source [22,23,27]. Therefore, despite meticulous optimization of the instrumental parameters, the detection of the parent ions remained elusive.
The propensity for fragmentation within the ion source presents a strategic approach for the quantitative analysis of HES130/0.4. IS-CID refers to the fragmentation of parent ions within the ion source due to declustering potential (DP), this process should typically be avoided in MS analysis. However, for HES130/0.4, IS-CID via a high DP in the ion source simplifies the MS pattern by converting numerous complex precursor ions into a limited number of common characteristic fragment ions, referred to as "pseudo-precursor ions". These "pseudo-precursor ions" are subsequently subjected to further fragmentation through collision energy (CE) to produce product ions suitable for MRM screening (Fig. 2A).
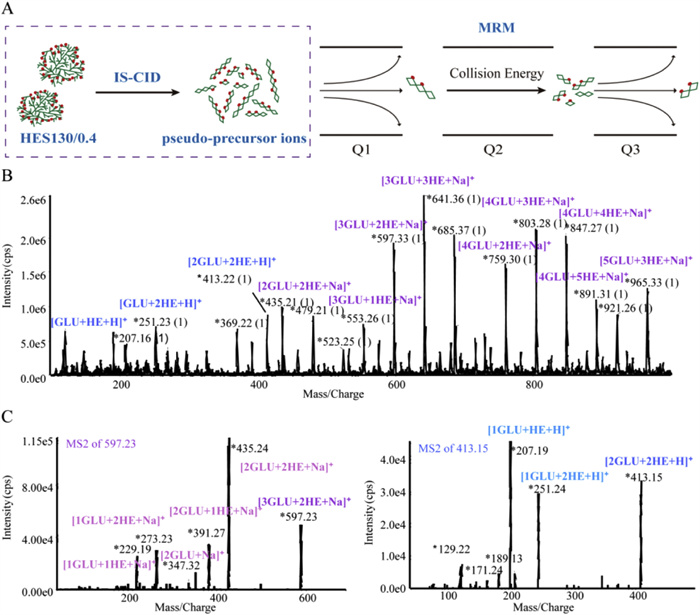
As shown in Fig. 2B, IS-CID analysis of HES130/0.4 yielded characteristic fragment ions differing by one or more dehydrated glucose units and/or HE group substitutions. For example, m/z 597.33, 641.36, 803.28, and 847.29, corresponding to structures with three glucose units accompanied by two or three HE groups, and four glucose units with three or four HE groups ([3GLU+2HE+Na]+, [3GLU+3HE+Na]+, [4GLU+3HE+Na]+, [4GLU+4HE+Na]+). Furthermore, hydrogenated adducts were detected at m/z 207.16, 251.23, 369.22, and 413.22, assigned as [GLU+HE+H]+, [GLU+2HE+H]+, [2GLU+HE+H]+, and [2GLU+2HE+H]+, respectively.
Subsequently, the CE was increased to investigate the product ions at m/z 597.23 (sodium addition peak) and 413.15 (hydrogenation peak), which are "pseudo-parent ions" of HES130/0.4, respectively. As shown in Fig. 2C, at a CE of 50 eV, the glycosidic bond of the ion with m/z 597.23 undergoes further cleavage, yielding fragments like m/z 435.24 ([2GLU+2HE+Na]+), m/z 391.27 ([2GLU+HE+Na]+), and m/z 273.23 ([GLU+2HE+Na]+), among others. Some fragments associated with the glucose unit, such as m/z 347.32 ([2GLU+Na]+), were also detected since some of the hydroxyl groups were not substituted by the HE group. In contrast, the hydrogenated ion tended to fragment more readily in the quadrupole (CE = 15 eV), and its fragmentation pattern generally resembled that of the sodium-added ion, with the notable difference that a distinct dehydration peak was observed, for example, at m/z 189.13. Further dehydration elimination by m/z 189.13 produced m/z 171.24, and m/z 129.22 could be a fragment ion produced by successive elimination of formaldehyde by m/z 189.13.
In terms of chromatography, size exclusion chromatography (SEC) columns are used for the analysis of polysaccharides. However, due to polydispersity, the peaks obtained on SEC for HES130/0.4 are often broad and asymmetric, with poor sensitivity and linearity. Besides, the strong polarity of HES130/0.4 reduces its retention on the C8 and C18 columns. Notably, amino columns have demonstrated efficacy in analyzing hydrolysates of HES130/0.4, including glucose and other oligosaccharides. In this study, a polar amide group modified ACCHROM XAmide column 100A (3.0 mm × 100 mm, 5 µm) was selected. Compared with the amino column, the amide column has better separation effect, wider pH range and higher stability. Additionally, the polar groups shield the silanol groups, minimizing interactions with HES130/0.4 and significantly improving peak shapes.
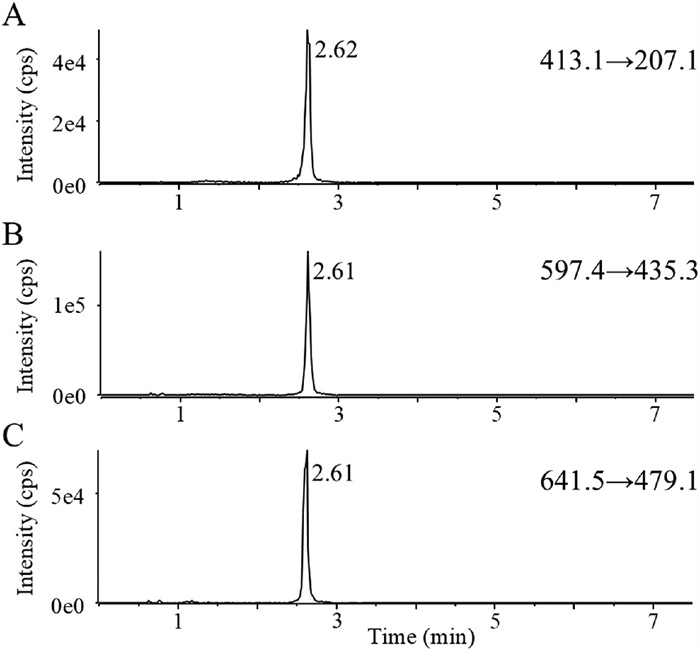
To achieve the elution of polydisperse HES130/0.4 as a single peak, we meticulously optimized the chromatographic elution program. The optimized gradient profile is as follows: 0−1.2 min 60% B; 1.2−2.4 min 60% → 10% B; 2.4−3.6 min 10% → 2% B; 3.6−5.4 min 2% B; 5.4−6.0 min 2% → 60% B; 6.0−7.5 min 60% B. Moreover, when acetonitrile was employed as the organic phase and formic acid as the modifier, the peak shape of HES130/0.4 became narrow and symmetric, exhibiting better sensitivity and selectivity. Under optimized chromatographic conditions, all characteristic ion pairs exhibited symmetrical single peaks with consistent retention times (2.6 min), validating the detection of HES130/0.4 and the method's specificity (Fig. 3). The ion transition m/z 597.4 → 435.3 was selected as the quantitative pair due to its highest signal intensity. The details were provided in Supporting information.
Common sample pretreatment methods include protein precipitation (PPT), liquid-liquid extraction (LLE), and solid-phase extraction (SPE). HES130/0.4 is not amenable to LLE due to its high polarity. The procedure for SPE is intricate and time-consuming, whereas PPT offers a straightforward process. The method largely circumvents analyte loss during processing. However, characterized by a multitude of hydroxyl groups and a negative charge, HES130/0.4 is inclined to interact and co-precipitate with plasma proteins. This necessitates further optimization of the treatment. In this study, various precipitation reagents were assessed as demonstrated in Fig. S1 (Supporting information). It is evident that acetonitrile was ineffective in disrupting the interactions between HES130/0.4 and plasma proteins. In contrast, methanol exhibited relatively high recovery. Subsequently, an appropriate amount of formic acid addition to methanol adjusted the pH, reducing electrostatic interactions between HES130/0.4 and plasma proteins and improving recovery. Finally, methanol containing 0.03% formic acid was selected as the precipitation reagent. Suitable internal standards can effectively address the issue of quantitative inaccuracies caused by matrix effects. After screening, xylotetraose was chosen as the internal standard in this study. Details can be found in Supporting information.
Subsequently, the specificity, selectivity, standard curves and ranges, accuracy and precision, carryover and associated stability of the method were systematically examined in this study. To assess the presence of interference from complex biological matrices in this method, the chromatograms of blank plasma, plasma samples containing analytes HES130/0.4 and internal standard were compared in this study. The results are shown in Fig. S3 (Supporting information). The retention times of HES130/0.4 and internal standard were 2.63 and 1.11 min, respectively. No significant interference from endogenous substances was observed at the retention time of the analyte and internal standard in blank plasma. Carryover was less than 15% of the LLOQ, meeting the requirements of bioanalytical method validation. The assays demonstrated linearity over the range of 40–4000 µg/mL in rat plasma. The regression equation was y = 0.00134x + 0.0166 (r = 0.995), where y represents the analyte/internal standard peak area ratio and x represents concentration. A representative linearity curve was given in Fig. S4 (Supporting information). The method has a wider linear range than other published screening methods [23,27].
The accuracy and precision validation of the method at LLOQ, LQC, MQC, and HQC concentration levels are listed in Table S1 (Supporting information). The intra-and inter-day accuracy and precision were <15%, suggesting that the method is reliable and reproducible. The plasma matrix effect ranged from 102%-107% (Table S2 in Supporting information). The extraction recoveries of HES130/0.4 ranged from 95.3% to 106% (Table S3 in Supporting information). Hence the extraction method used in this study was reproducible and exhibited a high rate of recovery. In addition, the stability of HES130/0.4 was investigated after 4 h at room temperature, 48 h under autosampler conditions and three freeze-thaw cycles. The results showed that HES130/0.4 in the biological matrix was stable under all storage conditions (Table S4 in Supporting information). These results indicate that the method developed in this study is highly specific, sensitive, stable and reproducible.
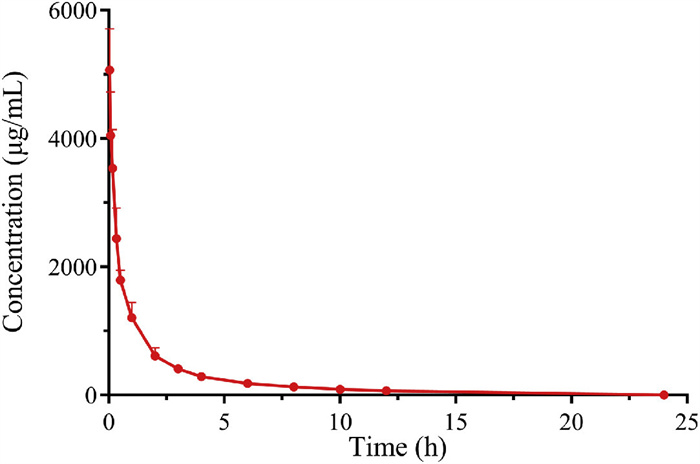
The validated method was then employed to assess plasma pharmacokinetics in rats (3 males, 3 females, weight 200 ± 10 g) following an intravenous injection of 300 mg/kg HES130/0.4. All animal procedures were performed in accordance with protocols approved (No. YNPZXM2023012) by the Institutional Animal Care and Use Committee of Jilin University. The mean plasma concentration-time curve of HES130/0.4 is depicted in Fig. 4. Comprehensive data for each rat is available in Table S5 (Supporting information). The area under the concentration-time curve (AUC0-t) was 5245 ± 646 h µg/mL, constituting >93% of the AUC0-∞ of 5598 ± 633 h µg/mL. This indicates that HES130/0.4 is thoroughly eliminated from rat plasma within 24 h. The elimination half-life (t1/2) was 3.71 ± 0.49 h. The mean apparent volume of distribution (Vz) was 291 ± 55.8 mL/kg, which exceeds the plasma volume in rats (31.2 mL/kg) but is less than the extracellular fluid volume in rats (296.8 mL/kg) [28], suggesting that HES130/0.4 in plasma is more broadly distributed outside the cells. Additionally, t-tests of important parameters such as AUC0-t, t1/2, clearance (CL) and Vz in female and male rats showed that there was no male-female difference in the pharmacokinetics of HES130/0.4.
Characterizing HES130/0.4’s plasma PK is critical for understanding its PK-PD relationship. Prior hydrolysis-based methods failed to reflect in vivo profiles due to endogenous glucose interference, while published direct methods suffered from poor specificity, broad peaks, and limited linearity. This study introduces an innovative direct quantification method using IS-CID-MRM, addressing these limitations by preserving intact HES130/0.4 in plasma, improving peak symmetry, and expanding linearity. The resulting PK data more accurately reflects physiological reality, enabling precise PK-PD correlation analysis.
While the method developed in this study effectively mitigates the glucose interference typically encountered in traditional pharmacokinetic studies, it currently lacks the ability to distinguish between HES130/0.4 and its complex and diverse metabolites. This limitation may affect the accuracy of pharmacokinetic analyses. Following intravenous injection, HES130/0.4 undergoes rapid α-amylase-mediated degradation with stochastic cleavage sites, theoretically producing a heterogeneous mixture of oligo-/polysaccharides with varying molecular weights. However, the osmotic efficacy of HES130/0.4 as a plasma volume expander relies on the number of particles present in circulation. This indicates that all circulating HES130/0.4 macromolecules—not just unmetabolized forms—contribute to sustaining colloid osmotic pressure. Therefore, the inability to differentiate HES130/0.4 from its metabolites has only limited impact the reliability of efficacy.
Current metabolite identification studies of HES130/0.4 remain restricted to urine, providing only broad molecular weight distributions that underscore the complexity of HES130/0.4 catabolism. Various methodologies, such as chromatography, capillary electrophoresis, and ion mobility spectrometry, have enabled in vitro separation of oligosaccharides, while nuclear magnetic resonance (NMR) and mass spectrometry techniques permit structural characterization of specific configurations [29–31]. However, these approaches remain constrained to analyzing a limited subset of oligosaccharides under controlled conditions and face significant challenges in resolving the vast complexity of HES130/0.4 metabolites (oligosaccharides and polysaccharides) within intricate biological matrices. Notably, the present study has demonstrated the identification of up to 200 human milk oligosaccharide compounds with a maximum degree of polymerization of 13 using a four-dimensional all-ion fragmentation liquid chromatography-electrospray ionization-ion mobility-mass spectrometry strategy [32]. This breakthrough highlights the potential of integrating orthogonal separation techniques to resolve highly intricate carbohydrate mixtures, providing a roadmap for comprehensive characterization of complex polysaccharides metabolites.
The authors declare that they have no known competing financial interests or personal relationships that could have appeared to influence the work reported in this paper.
Xin Xu: Writing – original draft, Methodology, Investigation, Data curation. Huan Yang: Investigation. Jiachong Chi: Investigation. Xiangjun Meng: Writing – review & editing. Jingkai Gu: Writing – review & editing, Supervision, Project administration, Conceptualization.
This work was supported by the National Natural Science Foundation of China (Nos. 82030107, 82304443, 82373944).
Supplementary material associated with this article can be found, in the online version, at doi:
Y. Liu, Y.Y. Sun, G.L. Huang, Int J. Biol. Macromol. 111 (2018) 780-786. doi: 10.1016/j.ijbiomac.2018.01.086
L. Li, J. Hu, C. Qin, et al., Chin. Chem. Lett. 36 (2025) 110797. doi: 10.1016/j.cclet.2024.110797
S. Su, X. Ding, L. Fu, et al., Int. J. Mol. Med. 44 (2019) 713-724.
J.P. Teixeira, L.M. Van Sant, N. Nielsen, Anaesth. Intensive Care Med. 24 (2023) 421-427. doi: 10.1016/j.mpaic.2023.04.003
Y. Liu, M. Zhu, M. Meng, et al., Chin. Chem. Lett. 34 (2023) 107583. doi: 10.1016/j.cclet.2022.06.006
L. Sun, X. Luo, C. Zhou, et al., Chin. Chem. Lett. 35 (2024) 108803. doi: 10.1016/j.cclet.2023.108803
I. Uhliariková, M. Matulová, P. Capek, Carbohydr. Res. 508 (2021) 108400. doi: 10.1016/j.carres.2021.108400
Y. Deng, L.X. Chen, B.J. Zhu, et al., Int. J. Biol. Macromol. 205 (2022) 15-22. doi: 10.3390/biomimetics7010015
J. Liu, H.D. Wang, F.F. Yang, et al., Carbohydr. Polym. 277 (2022) 118867. doi: 10.1016/j.carbpol.2021.118867
T.L. Wong, L.F. Li, J.X. Zhang, et al., J. Chromatogr. A 1607 (2019) 460388. doi: 10.1016/j.chroma.2019.460388
C. Xiao, H. Hu, H. Yang, et al., Nanoscale Adv. 1 (2019) 1002-1012. doi: 10.1039/c8na00271a
P.A. Glover, E. Rudloff, R. Kirby, J. Vet. Emerg. Crit. Care 24 (2014) 642-661. doi: 10.1111/vec.12208
I.D. Yozova, J. Howard, N.E. Sigrist, et al., Front. Vet. Sci. 4 (2017) 140. doi: 10.3389/fvets.2017.00140
W.Y. Yan, M. Sheng, W.L. Yu, et al., ACS Omega 8 (2023) 11447-11456. doi: 10.1021/acsomega.3c00275
D. Li, J.X. Ding, X.L. Zhuang, et al., J. Mater. Chem. B 4 (2016) 5167-5177. doi: 10.1039/C6TB00991C
G.F. Li, Y. Li, Y.L. Tang, et al., Int. J. Pharma. 471 (2014) 234-244. doi: 10.1016/j.ijpharm.2014.05.038
M. Westphal, M.F.M. James, S. Kozek-Langenecker, et al., Anesthesiology 111 (2009) 187-202. doi: 10.1097/ALN.0b013e3181a7ec82
J. Waitzinger, F. Bepperling, G. Pabst, et al., Clin. Drug Investig. 16 (1998) 151-160. doi: 10.2165/00044011-199816020-00008
M. Yamakage, F. Bepperling, M. Wargenau, et al., J. Anesth. 26 (2012) 851-857. doi: 10.1007/s00540-012-1430-6
G.P. Otto, B. Wissuwa, A. Mehnert, et al., Crit. Care 16 (2012) 426. doi: 10.1186/cc11302
M. Thevis, G. Opfermann, W. Schänzer, J. Chromatogr. B: Biomed. Appl. 744 (2000) 345-350. doi: 10.1016/S0378-4347(00)00251-6
R.G. Gallego, J. Segura, Rapid Commun. Mass Spectrom. 18 (2004) 1324-1330. doi: 10.1002/rcm.1491
M. Kolmonen, A. Leinonen, T. Kuuranne, et al., Anal. Bioanal. Chem. 401 (2011) 563-571. doi: 10.1007/s00216-011-4838-1
F.B. Scalco, R.E. Simoni, M.L.C. de Oliveira, et al., J. Sci. Med. Sport 13 (2010) 13-15. doi: 10.1016/j.jsams.2008.06.010
K. Deventer, P. Van Eenoo, F.T. Delbeke, J. Chromatogr. B: Analyt. Technol. Biomed. Life Sci. 834 (2006) 217-220. doi: 10.1016/j.jchromb.2006.02.044
M. Mazzarino, I. Fiacco, X. de la Torre, et al., Drug Test. Anal. 3 (2011) 896-905. doi: 10.1002/dta.387
S. Guddat, M. Thevis, A. Thomas, et al., Biomed. Chromatogr. 22 (2008) 695-701. doi: 10.1002/bmc.986
B. Davies, T. Morris, Pharm. Res. 10 (1993) 1093-1095. doi: 10.1023/A:1018943613122
D. Smolkova, R. Cmelik, J. Lavicka, Trac-Trend Anal. Chem. 163 (2023) 117068. doi: 10.1016/j.trac.2023.117068
D. Smolkova, D. Moravcova, J. Lavicka, J. Sep. Sci. 47 (2024) e2300705. doi: 10.1002/jssc.202300705
A.H. Abikhodr, A. Ben Faleh, S. Warnke, et al., Analyst 148 (2023) 2277-2282. doi: 10.1039/d3an00407d
J. Gonsalves, J. Bauzá-Martinez, B. Stahl, et al., Anal. Chem. 97 (2025) 5563-5574. doi: 10.1021/acs.analchem.4c06081

Figure 2 (A) Schematic diagram of IS-CID. (B) Mass spectrum of HES130/0.4 acquired by IS-CID (DP = 300 V). The characteristic fragments of HES130/0.4, produced through IS-CID, fall into two principal categories. The sodium-adduct ion, highlighted in purple, and the hydrogenated ion, highlighted in blue. (C) MS/MS spectra of m/z 597.23 and 413.15.

Figure 3 Representative chromatograms of different ion channels obtained using the in-source collision-induced dissociation integrated with multiple reactions monitoring (IS-CID-MRM) method for the determination of HES130/0.4.

Figure 4 Mean plasma concentration-time curve of HES130/0.4 after a single intravenous injection of 300 mg/kg HES130/0.4 to rat (data are mean ± SD, n = 6).
Table 1. Bioanalytical methods reported for HES130/0.4.
| No. | Method | Column | Mobile phase | Sample preparation | Internal Standard | LOQ (µg/mL) | Linearity range (µg/mL) |
Biological sample type | Application | Ref. |
| 1 | LC-IS-CID-MS/MS | XAmide (100 × 3 mm, 5 µm) | (A) 0.1% FA in water, (B) acetonitrile (ACN) | Protein precipitation |
Xylotetraose | 40 | 40-4000 | Plasma | Plasma PK study in rat | This work |
| Indirect method | ||||||||||
| 2 | Hydrolysis | _ | _ | Acetone precipitation; trifluoroacetic acid hydrolysis | _ | _ | Not mentioned | Plasma and urine | Plasma PK and urinary excretion studies in subjects | [18] |
| 3 | Hydrolysis | _ | _ | Acetone precipitation; trifluoroacetic acid hydrolysis | _ | 80 | Not mentioned | Plasma and urine | Plasma PK and urinary excretion studies in subjects | [19] |
| 4 | Benedict’s reaction | _ | _ | Water dilution; HCl hydrolysis (60 min boil); NaOH neutralization; Benedict's reagent addition (8 min boil) | _ | _ | _ | Urine | HES screening of athletes | [24] |
| 5 | LC-MS (APCI) | Microsorb amine-type column (100 × 4.6 mm, 3 µm) | (A) 1% acetic acid in water, (B) ACN | HCl hydrolysis (30 min, 80 ℃); evaporated | Glucose-13C6 | _ | _ | Urine | Detection of HES | [25] |
| 6 | GC-MS | HP 5 MS capillary column (16 m × 0.25 mm, 0.25 µm (film thickness)) | _ | HCl hydrolysis (1 h, 100 ℃); dried; derivatization | _ | _ | _ | Urine | HES screening of athletes | [21] |
| 7 | MALDI-TOF MS | _ | _ | Partial TFA hydrolysis (30 min, 100 ℃); dried; resuspended in analytical matrix | _ | _ | _ | Urine | Detection of HES | [22] |
| 8 | LC-MS | Polaris 5 NH2 column (150 × 2.1 mm, 5 µm) | (A) 5 mmol/L ammonium formate, 0.1% FA in H2O, (B) 0.1% FA in ACN | Incubated with α-amylase/dextranase (37 ℃, 60 min), addition of internal standard, evaporation and redissolution | Glucose-13C6, Mannitol-13C1 |
_ | _ | Urine | Detection of HES | [26] |
| Direct approach | ||||||||||
| 1 | Lugol's iodine solution | _ | _ | Mix plasma with 10% TCA; centrifuge; mix the supernatant with LUGOL; measure the OD at 530 nm | _ | Not mentioned | Not mentioned | Plasma | Detection of HES | [20] |
| 2 | LC-(IS-CID)-MS/MS | Phenomenex Onyx monolithic C18 column (100 × 4.6 mm) | (A) ammonium acetate buffer (5 mmol/L, 0.1% of glacial acetic acid; pH = 3.5), (B) ACN | Mixed directly with the internal standard; injected | β-Cyclodextrin | 10 | 100-1000 | Urine | Detection of HES | [27] |
| 3 | LC–(IS-CID)–TOF MS | Ultra hydrogel DP guard column (40 × 6 mm) | (A) 5 mmol/L ammonium formate, 0.1% FA in H2O, (B) ACN | Diluted, centrifuged; injected | _ | 250 | 250-10,000 | Urine | Screening HES | [23] |
 下载: 导出CSV

 扫一扫看文章

扫一扫关注我们

 下载:
下载: