Received Date:
15 May 2025 Accepted Date:
09 August 2025 Revised Date:
05 August 2025 Available Online:
15 December 2026
Abstract:
Li+/Na+ ion exchange has made a breakthrough in the synthesis of Ni-rich layered cathode oxide, which can effectively mitigate the severe Li/Ni disorder that occurs in the traditional solid-phase sintering method. However, the comparative study of the cations presents in the Li layer as pillars is rarely reported. Herein, a series of Ni2+/Na+ co-substituted Ni-rich materials are designed by ion exchange at ∼200 °C with varying Li+/Na+ molar ratios (4, 8, 12, 16), which is used as a platform to quantitatively decipher the pillar effect contributed by Ni2+ and Na+ in the Li layer. We found that Ni2+ is approximately 3.5 times more effective as pillar than Na+. Theoretical calculations further reveal that Ni2+ in Li slab provides the higher mechanical strength than Na+ in the deeply delithiated state of Ni-rich materials. Besides, the results of structural evolution over cycling reveals that Ni2+ plays a greater role of pillar in stabilizing the structure with higher lattice energy compared to Na+, attributed to its higher mechanical strength (bulk modulus: 56.9 vs. 43.8 GPa). The PL-4 cathode (Li+/Na+ molar ratios = 4) exhibited optimal electrochemical performance, retaining 90.4% capacity after 70 cycles at 1 C and delivering a high specific capacity of 141.7 mAh/g at 10 C. This work provides design principles for the synthesis of layered oxides with high structural stability via ion exchange, potentially leading to the development of advanced cathode materials for high-energy lithium-ion batteries.
With the rapid development of large-scale energy storage and electric vehicles, increasing demands are being placed on lithium-ion battery cathode materials [1,2]. Ni-rich layered ternary cathode materials (LiMO2, where M = Ni, Co, Mn (NCM) or Al (NCA), Ni ≥ 0.8) dominate the market, while the key to their further development is the reduction of energy cost and increase of energy density [3-5]. Currently, the biggest challenge facing ternary layered materials is the structural instability caused by the severe Li/Ni disorder. The traditional high-temperature solid-phase sintering method is one of the most important ways to form Li/Ni disorder. The occupation of Li+ sites by Ni2+ was generally considered to be detrimental to performance due to the obstacle to Li+ diffusion. Recently, it has been shown that a moderate amount of Li/Ni disorder can stabilize the LiO6 space structure due to the pillar effect of Ni2+ [6]. Therefore, it is a challenging task to regulate the Li/Ni disorder for structural optimization.
Based on our previous work [7,8], we found that the ion exchange holds great potential for regulating the Li/Ni disorder of NCM materials. On the one hand, owing to ion exchange at mild temperatures (∼200 ℃), the Ni2+ diffusion rate decreases dramatically, allowing the Li/Ni disorder to be effectively regulated. Benefiting from the Li/Ni disorder in the low content range, Ni2+ can act as a pillar in the lithium layer and thus stabilize the crystal structure of the materials. On the other hand, as the precursor material for ion exchange is a NaNixCoyMn1 - x - yO2 material, the trace amount of residual Na+ ions still can be observed in ion-exchanged LiNixCoyMn1 - x - yO2. In general, Na+ ions in the Li layer are also capable of acting as pillars [9-11]. Since Na+ (1.02 Å) has a larger radius than Li+ (0.76 Å), the Li layers of the NCM material are too narrow for the deintercalation of Na+ ions, and thus Na+ is trapped in the Li+ sites as a pillar for the Li layers during cycling.
Although Ni2+ and Na+ at Li+ site can stabilize the LiO6 layer, the comparative study of the Ni2+ and Na+ present in the Li layer during ion exchange is rarely reported. Previous studies have focused on the qualitative benefits of Na+ or Ni2+ as a pillar, without quantifying its effectiveness relative to other cations. Cho et al. [9] investigated the pillar layer effect formed by Ni2+ occupying the lithium layer in the region around 10 nm on the LiNi0.70Co0.15Mn0.15O2 surface. He et al. [10] synthesized Na-stabilized Li1.2 − xNax[Co0.13Ni0.13Mn0.54]O2 by introducing larger Na ions into the Li slabs of the layered material, demonstrating that Na enlarges the Li slab space of the layered material, which facilitate the stabilization of the host lattice and allow rapid diffusion of Li ions in the bulk lattice. Although many systematic studies have been done in the literature on the pillar effects of Na+ and Ni2+, respectively. Critically, a direct and quantitative comparison of the pillar effects between Ni2+ (a transition metal cation) and Na+ (an alkali metal cation) remains unexplored, despite their distinct chemical properties and interactions with the host lattice. In contrast to conventional solid-phase sintering, ion exchange offers a unique platform to precisely regulate Li/Ni disorder and residual Na+ content by modulating reaction driving forces (e.g., Li+/Na+ molar ratios). Therefore, the ion-exchanged materials can be used as a good platform to quantitatively decipher the pillar effect of Ni2+ and Na+ in layered oxide cathodes, which is a task worthy of further research on the enhanced structural stability of materials. During ion exchange, the Li/Ni disorder and the content of residual Na+ can be adjusted by modulating the reaction driving force of Li+/Na+ ion exchange. And the reaction driving force is generally determined by the concentration difference between Li+ and Na+, i.e., the Li+/Na+ molar ratio.
In this work, we systematically investigated the pillar effect contributed by Ni2+ and Na+ on the enhanced structural stability of ion-exchanged Ni-rich materials. This work innovatively leverages this method to decouple and quantify the individual contributions of Ni2+ and Na+ to structural stabilization. Based on the molar ratio of Li+/Na+ in the ion exchange process, four sets of variables (the Li+/Na+ molar ratio: 4, 8, 12, and 16. The Li+/Na+ molar ratio was selected based on pre-experiments (tested range: 1-16). A lower limit of 4 ensured sufficient Li+ concentration to drive ion exchange effectively, while the upper limit of 16 avoided LiOH precipitation due to its aqueous solubility. This range balances exchange efficiency, avoids kinetic trapping of Na+, and covers critical thresholds for optimal structural and electrochemical performance were studied with a reaction driving force from low to high, which effectively modulated the occupancy of Ni2+ and Na+ in the Li layer. By systematically varying the Li+/Na+ molar ratio, we establish a quantitative relationship between structural analysis and electrochemical performance, revealing that Ni2+ is approximately 3.5 times more effective as pillar than Na+. Theoretical calculations further confirm that Ni2+ in Li slab provides stronger structural strength than Na+ in the deeply delithiated state of NCM. When the Li+/Na+ molar ratio is 4, the ion-exchanged cathode achieves the best structural stability with a high lattice energy, which is evidenced by X-ray absorption fine structure (XAFS) spectra, soft X-ray absorption (sXAS) spectra, and high-angle annular dark field-scanning transmission electron microscopy (HAADF-STEM). Such discoveries quantify the respective contributions of Ni2+ and Na+ to the pillar effect of Ni-rich materials and provide new insights into the synthetic design of boosted structural stability in Ni-rich materials during ion exchange. And provide mechanistic and quantitative insights into the relative efficacy of transition metal vs. alkali metal cations as structural pillars in Ni-rich cathodes, advancing the rational design of high-stability layered oxides.
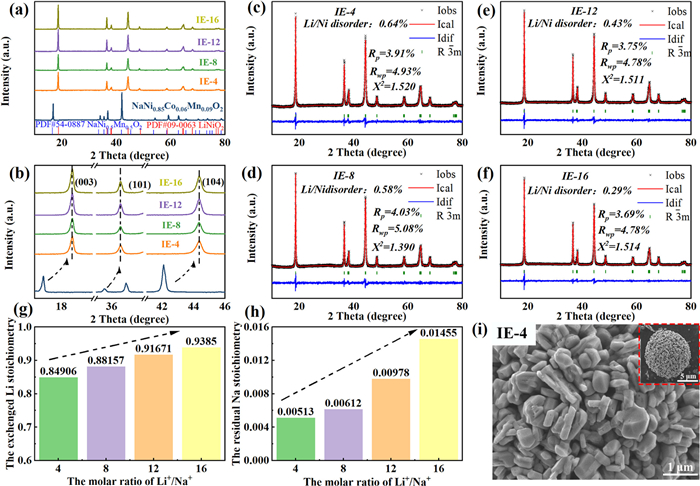
Based on the X-ray diffraction (XRD) results (Fig. 1a), it is observed that the ion-exchanged (IE) materials under different driving forces were all converted from Na-containing oxides to Li-containing oxides. Note that the reaction driving force are modulated by the Li+/Na+ molar ratio ranging from 4 to 16 during ion-exchange process. As shown in Fig. 1b, an enlarged view of three representative diffraction peaks displays that the peaks of IE materials are all shifted to the high angle, indicating that the smaller Li+ ions have replaced larger Na+ ions, resulting in a decreased interlayer spacing of the alkali metal layer [12]. One of the greatest advantages of ion exchange for the synthesis of layered materials is the regulation of Li/Ni disorder. As shown in Figs. 1c-f, the Li/Ni disorder of IE materials is less than 1%, significantly lower than that of the high-temperature calcined samples (5%-10%) [13-16]. On the other hand, a moderate amount of Ni2+ occupies the Li+ sites and acts as a pillar to stabilize the LiO6 structure [17]. As can be seen from Table S1 (Supporting information) of the cell parameters, the c/3a values for IE materials are above 1.64, indicating that the IE materials have obtained an ordered layered structure under different reaction driving forces.
Figure 1
Figure 1.
(a) The XRD patterns of ion-exchanged layered oxides. (b) XRD patterns of enlarged view around the main peaks in (a). The Rietveld refinements of XRD patterns for (c) IE-4, (d) IE-8, (e) IE-12, and (f) IE-16 materials. The layered oxides obtained by ion exchange under different driving forces with Li/Na molar ratio of 4, 8, 12, 16 are donated as IE-4, IE-8, IE-12 and IE-16, respectively. The ICP results of (g) the Li stoichiometry and (h) the residual Na stoichiometry of ion-exchanged layered oxides. (i) The SEM image of IE-4 materials. Note that the materials obtained by ion exchange under different driving forces with Li/Na molar ratios of 4, 8, 12, 16 are donated as IE-4, IE-8, IE-12 and IE-16, respectively.
As evidenced by the inductively coupled plasma emission spectrometer (ICP) results (Figs. 1g and h), the higher reaction driving force leads to more Na+ ions exchanged by Li+ ions (stoichiometry of Li+ ions: IE-4, 0.84906; IE-8, 0.88157; IE-12, 0.91671; IE-16, 0.9380). Meanwhile, the amount of residual Na+ ions monotonically increases with increasing reaction driving force (stoichiometry of Na+ ions: IE-4, 0.00513; IE-8, 0.00612; IE-12, 0.00978; IE-16, 0.01455). Notably, the total alkali metal occupancy (Li+ + Na+) remains below unity (0.854-0.953), confirming the presence of Li vacancies. This is because the ion exchange process occurs via the shrinking core model (Fig. S1 in Supporting information). Ion exchange initially takes place on the outer layer of the particles, and then the reaction interface gradually spreads to the interior. As the reaction driving force gets higher, the reaction in the outer layer is too vigorous and rapid, resulting in the shrinking interlayer spacing in the outer layer and thus some Na+ in the interior being unable to diffuse outwards and becoming trapped. These trapped Na+ ions lead to the residual Na+ in the IE materials. This compositional trend (higher residual Na+ at elevated Li+/Na+ molar ratios) aligns with a shrinking-core mechanism, wherein rapid surface exchange at high driving force reduces interlayer spacing, kinetically trapping Na+ ions in the particle core. Thus, higher Li+/Na+ molar ratios enhance Li+ incorporation without requiring complete Na+ removal, as vacancies buffer stoichiometric imbalance. At the same time, we added a heat treatment process after ion exchange, during which we added some lithium salts to bring the molar amount of lithium ions close to 1, so that the properties of the final product would not be affected by the presence of lithium vacancies.
A study of the scanning electron microscope (SEM) in Fig. 1i and Fig. S2 (Supporting information) reveals that secondary particles of IE materials have little change in spherical shape and size. Also, the transition metal (TM) elements of IE materials are evenly distributed with minor variations in their proportion (Figs. S3-S6 in Supporting information). These results indicate that the reaction driving force does not have much influence on the morphology of the IE materials. Notably, SEM analysis confirms consistent secondary particle morphology and crystallinity across all samples, indicating that particle size effects are negligible here; thus, the observed Na+ trapping is primarily governed by reaction driving force rather than diffusion path length.
To further examine the crystallographic information, we conducted transmission electron microscope (TEM) analysis on IE materials. Fig. S7 (Supporting information) shows that the IE materials exhibit a regular R-3m layered structure and its corresponding fast Fourier transform (FFT) patterns from the (003) crystal planes. The lattice spacing is approximately 0.47 nm. This is in agreement with the previous XRD results (Fig. 1a). Despite the large difference in reaction driving force for ion exchange, the effect on the crystal structure of the final product formed is insignificant.
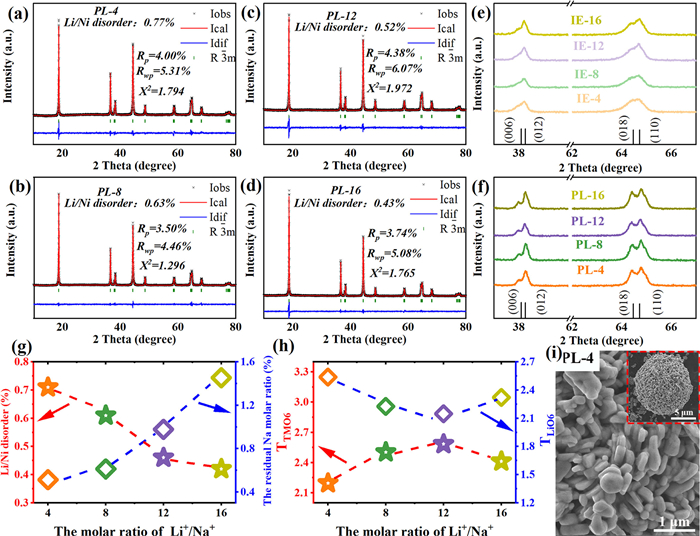
A short heat treatment was performed after ion exchange to repair lattice defects caused by the rapid process. Note that the IE materials after heat treatment are referred to as PL. As mentioned earlier, the residual Na+ ions may agglomerate as a result of the core-shrinking reaction that occurs during the ion exchange process. Nevertheless, the Na+ ions gradually diffuse towards a uniformly distribution during the heat treatment due to the thermal relaxation effect and lithium vacancies. The heat treatment did not alter the crystal structure, and PL-4 remained as a layered oxide, as confirmed by corresponding fast Fourier transform patterns (Fig. S8 in Supporting information). The magnified HAADF-STEM images of regions A and B demonstrate the well-ordered layered structure in PL-4 with low Li/Ni disorder. We performed the Rietveld refinements on PL materials to further observe their crystal structure. As shown in Figs. 2a-d, the Li/Ni disorder of PL increases after heat treatment, which is due to the high temperatures accelerating the migration rate of Ni2+ towards Li+ sites. Fortunately, the increase in the Li/Ni disorder is not significant, and the final Li/Ni disorder remains below 1% (PL-4, 0.71%; PL-8, 0.61%; PL-12, 0.46%; PL-16, 0.42%) owing to the short duration of heat treatment. The splitting peaks of (006)/(012) and (018)/(110) in the PL materials become sharp and pronounced (Figs. 2e and f), indicating that the layered ordering of the PL was enhanced. To reveal the correlation between the processing and structure, we plotted the crystal structure parameters as a function of the molar ratio of Li+/Na+ (Figs. 2g and h, Table S2 in Supporting information). The molar ratio of Li+/Na+ shows a monotonically increasing linear relationship with the Li/Ni disorder but a monotonically decreasing linear relationship with the amount of residual Na+ ions. This leads to a volcano relationship between the molar ratio of Li+/Na+ and the spacing of TMO6, as well as a V-shaped relationship with the spacing of LiO6. The spacing of LiO6 peaks at PL-4, contributing to the best Li+ diffusion. As for the microscopic morphology of the PL materials, Fig. 2i and Figs. S9-S11 (Supporting information) have shown that the secondary particles of the PL material appear to be slightly coarse and bound together, which makes the internal particles less vulnerable to be attacked by the electrolyte.
Figure 2
Figure 2.
The Rietveld refinements of XRD patterns for (a) PL-4, (b) PL-8, (c) PL-12, and (d) PL-16 materials. XRD patterns of enlarged view around the main peaks for (e) IE materials and (f) PL materials. The IE-4, IE-8, IE-12 and IE-16 materials were pre-lithiated and donated as PL-4, PL-8, PL-12, and PL-16, respectively. (g) The Li/Ni disorder and the residual Na stoichiometry as the function of the molar ratio of Li+/Na+. (h) The TTMO6 and TLiO6 as the function of the molar ratio of Li+/Na+. (i) The SEM image of PL-4 materials. Note that the IE-4, IE-8, IE-12 and IE-16 were treated by heat treatment was donated as PL-4, PL-8, PL-12 and PL-16, respectively.
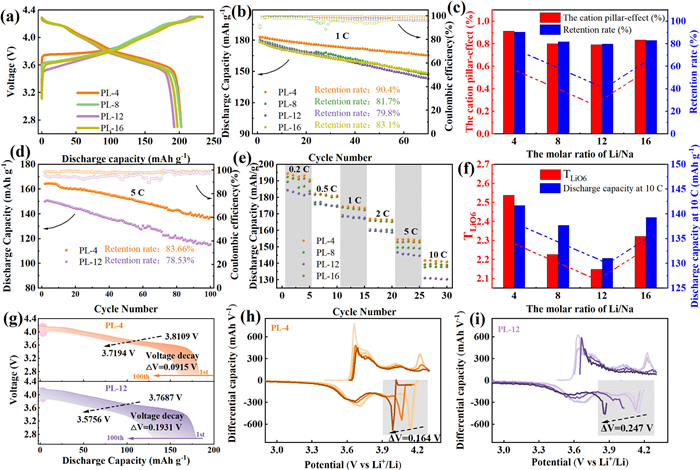
The crystal structure is closely related to the performance of materials. Thus, we performed a detailed electrochemical performance test on the Ni2+/Na+-substituted Ni-rich materials under different reaction driving forces. The initial charge/discharge curves show the typical redox plateau of ternary materials (Fig. 3a). As the reaction driving force increases, the cycling performance (Fig. 3b) tends to decrease and then increase (the capacity retention after 70 cycles: PL-4, 90.4%; PL-8, 81.7%; PL-12, 79.8%; PL-16, 83.1%). By analyzing the electrochemical performance and structural parameters, we have resolved the pillar effects of Ni2+ and Na+ by fitting. Initially, we propose an analytical equation: Cationic pillar effect (the capacity retention) = x[Ni2+] + y[Na+]. The formula parameters for the four groups of materials are given below: PL-4, [Ni2+] = 0.77, [Na+] = 0.513; PL-8, [Ni2+] = 0.63, [Na+] = 0.612; PL-12, [Ni2+] = 0.52, [Na+] = 0.978; PL-16, [Ni2+] = 0.43, [Na+] = 1.455. The parameter for x is set to 1, the calculation formula is shown below:
0.904 = 0.77 + yPL-4 × 0.513
(1)
0.817 = 0.63 + yPL-8 × 0.612
(2)
0.798 = 0.52 + yPL-12 × 0.978
(3)
0.831 = 0.43 + yPL-16 × 1.455
(4)
Figure 3
Figure 3.
(a) Initial charge/discharge curves of PL cathodes. (b) The cycling performance of PL cathodes at a constant rate of 1 C. (c) The cation pillar effect and retention rate of PL cathodes as the function of the molar ratio of Li+/Na+. (d) The cycling performance of PL-4 and PL-12 cathodes at a constant rate of 5 C over 100 cycles. (e) The rate performance of PL cathodes at 0.2, 0.5, 1, 2, 5 and 10 C. (f) The TLiO6 and discharge capacity of PL cathodes at 10 C as the function of the molar ratio of Li+/Na+. (g) The discharge curves of PL-4 and PL-12 from 1st to 100th cycle. The dQ/dV curves from 1st to 100th cycle of (h) PL-4 and (i) PL-12 cathodes.
The calculation gives that yPL-4 = 0.261, yPL-8 = 0.305, yPL-12 = 0.284, yPL-16 = 0.276. This fitting means that Ni2+ is approximately ∼3.5 times more effective as a pillar than Na+. According to the parameters for the cationic pillar effect, the pillar effect of Ni2+ and Na+ reaches to the maximum when the Li+/Na+ molar ratio is 4 and to the minimum when the Li+/Na+ molar ratio is 12 (Fig. 3c). This is further supported by the differences in rate performance, as shown in Fig. 3d (capacity retention after the 100 cycles at 5 C: PL-4, 83.66%; PL-12, 78.53%) and Fig. 3e (specific capacity at 10 C: PL-4, 141.7 mAh/g; PL-8, 137.7 mAh/g; PL-12, 131 mAh/g; PL-16, 139.3 mAh/g).
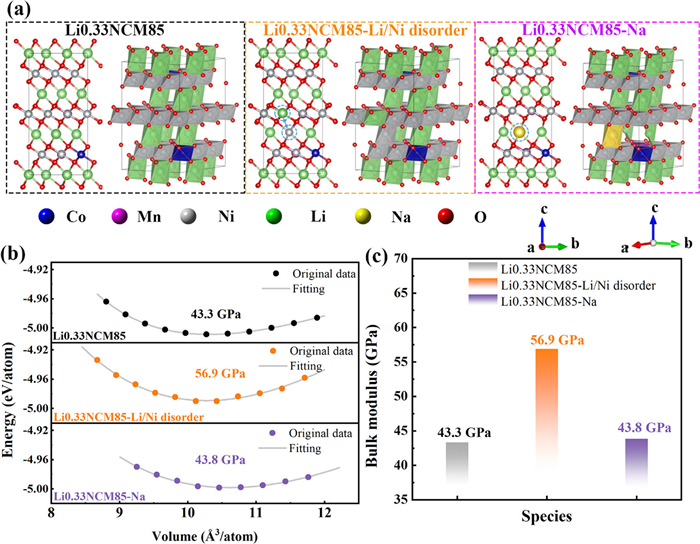
To further obtain insight into the pillar effect of Ni2+ and Na+ in Li slab, density functional theory (DFT) calculation was used to evaluate the structural properties of deeply delithiated state of NCM before and after modification with Ni2+/Na+ (Fig. 4 and Figs. S12-S14 in Supporting information). The Li stoichiometry of 33.3% in the DFT model corresponds to a delithiated state at 4.3 V, at which ∼67% Li is extracted during charging (Fig. 3a). This value aligns with both experimental charge states and computational conventions for studying mechanical stability in deeply delithiated layered oxides. The bulk modulus, computed from DFT-predicted equations of state, quantifies the mechanical resilience of the delithiated lattice. Higher values correlate with suppressed phase transitions and microcracking. The calculation of the bulk modulus of Li0.33NCM85, Li0.33NCM-Li/Ni disorder and Li0.33NCM-Na is 43.3, 56.9 and 43.8 GPa, respectively. This result means that Ni2+ in Li slab provides the higher mechanical strength than Na+. Therefore, Ni2+ plays a more prominent pillar effect on the structural stability during the NCM cycle. The bulk modulus of Li0.33NCM85 (43.3 GPa), Li0.33NCM-Li/Ni disorder (56.9 GPa), and Li0.33NCM-Na (43.8 GPa) confirms that Ni2+ provides substantially stronger mechanical reinforcement than Na+ due to its covalent bonding with oxygen. However, Na+’s pillar efficacy primarily derives from interlayer spacing stabilization (larger ionic radius expands the Li layers), which reduces phase transition strain but minimally enhances bulk modulus. This mechanistic distinction explains why electrochemical fitting (∼3.5 × efficacy ratio) and DFT (bulk modulus) capture complementary aspects of pillar effects.
Figure 4
Figure 4.
(a) The structural models of Li0.33NCM85, Li0.33NCM-Li/Ni disorder and Li0.33NCM-Na materials with [100] direction and [111] direction. (b) Equation of states and fitting bulk modulus for delithiated NCM materials (the baseline NCM, Li/Ni disordered NCM, and Na-residual are donated as Li0.33NCM85, Li0.33NCM-Li/Ni disorder, and Li0.33NCM-Na, respectively). (c) The fitting bulk modulus of Li0.33NCM85, Li0.33NCM-Li/Ni disorder and Li0.33NCM-Na materials. Note that the delithiated NCM is represented by a Li stoichiometry of 33.3% for DFT calculations, given that the state of charge at 4.3 V is roughly 67% at 1 C.
Subsequently, we carried out an in-depth analysis of the effect of the cation pillar on the reaction kinetics of Li+ ions. The discharge curves of the PL-12 cathode show a rapid decay in capacity and a sharp drop in voltage, whereas the discharge curves of the PL-4 materials with high cation pillar effect almost overlap, showing a little voltage decay (Fig. 3g and Fig. S15 in Supporting information, ∆V = 0.0915, 0.1634, 0.1931, and 0.1188 V for PL-4, PL-8, PL-12, and PL-16, respectively). The slower voltage decay implies fewer deleterious phase transformation [18], so the PL-4 material has a stable structure due to the strongest cation pillar effects. The dQ/dV curves (Figs. 3h and i, Fig. S16 in Supporting information) allow for more sensitive detection of voltage decay and phase transformation during change and discharge [19]. PL-12 experiences severe phase transformation and voltage decay as shown by the maximum offset of its characteristic peaks (∆V, gray area), whereas PL-4 exhibits the most stable structure due to the smallest ∆V (PL-4, 0.164 V; PL-8, 0.219 V; PL-12, 0.247 V; PL-16, 0.216 V).
To analyze the Li+ ion transport rate in PL materials caused by the cation pillar effect, we performed the galvanostatic intermittent titration technique (GITT) to study the Li-ion diffusion kinetics [20,21]. As shown in Fig. S17a (Supporting information), the Li-ion diffusion rates are in descending order of PL-4 > PL-16 > PL-8 > PL-12, which are closely related to the LiO6 spacing. This observation is due to the fact that the PL-4 material has the largest LiO6 layer spacing and the robust layered structure during cycling, because of the optimized pillar effect of Ni2+ and Na+ in the Li layer.
Electrochemical polarization can be assessed by analyzing selected points on the charging plateau (∼4.2 V, Figs. S17b-e in Supporting information). The PL-4 shows the lowest ΔEτ (0.0403 V), while the PL-12 has the highest ΔEτ (0.0583 V), where ΔEτ refers to the voltage difference from transient charge voltage. This result indicates the lowest polarization for the PL-4 and the highest for the PL-12. The cyclic voltammetry (CV) experiments further show the differences in the degree of polarization and cycle reversibility of the PL materials. In Fig. S18 (Supporting information), PL samples shows three reversible redox pairs during the charge and discharge process in the CV curves [22]. The potential interval (ΔV) represents the extent of the polarizations. Evidently, PL-4 has the lowest ΔV and PL-12 has the highest (ΔV: PL-4, 0.266 V; PL-8, 0.312 V; PL-12, 0.331 V; PL-16, 0.277 V), which represents the high degree of electrochemical reversibility and low degree of polarization of the PL-4 cathode.
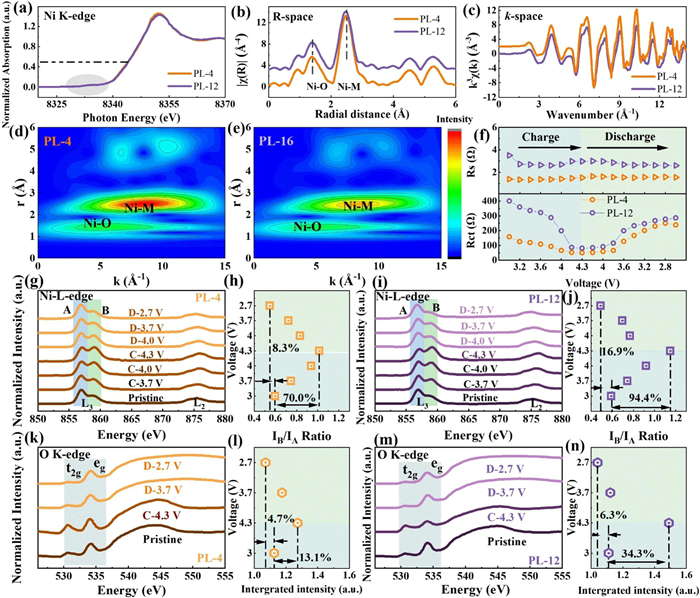
To analyze the coordination environment of transition metals in the PL materials with different degrees of cation pillar effect, we collected X-ray absorption fine structure (XAFS) spectra of the PL-4 and PL-12 materials (Figs. 5a-e). As shown in Fig. 5a, the X-ray absorption near edge structure (XANES) spectra of the Ni K-edge in PL-4 and PL-12 overlap, and the pre-edge peak (gray area) shows a high degree of overlap, indicating the PL-4 and PL-12 have a similar oxidation state of the Ni cation [23]. The k3-weighted Fourier transform magnitudes of R-space and k-spacing in the extended X-ray Absorption Fine Structure (EXAFS) spectra show that PL-4 and PL-12 have similar local environments around the Ni atoms (Figs. 5b and c), given the similar layered structure of Ni-rich oxides. However, wavelet transform (WT) plots in Figs. 5d and e exhibit that the PL-4 material has a stronger central intensity than PL-12, demonstrating that PL-4 has stronger lattice energy and a more stable structure than PL-12 [24], which is due to the high cation pillar effect for PL-4.
Figure 5
Figure 5.
(a) The XANES curves of Ni K-edge of PL-4 and PL-12 cathodes. (b) EXAFS curves of PL-4 and PL-12 cathodes at R space. (c) EXAFS curves of PL-4 and PL-12 cathodes at k space. The EXAFS WT images of (d) PL-4 and (e) PL-12 cathodes. (f) The evolution of Rct and Rs impedance of PL-4 and PL-12 cathodes during the discharge/charge processes. The ex-situ sXAS spectra of the Ni L-edge of (g) PL-4 and (i) PL-12 cathodes, along with the corresponding IB/IA ratio of (h) PL-4 and (j) PL-12 cathodes. The ex-situ sXAS spectra of the O k-edge of (k) PL-4 and (m) PL-12 cathodes, along with the corresponding integrated intensity of the gray region in k,m of (l) PL-4 and (n) PL-12 cathodes.
The in-situ impedance spectra (EIS) were performed to study the charge transfer impedance during charging/discharging process (Figs. S19 and S20 in Supporting information). The Rs of PL-4 were smaller than those of PL-12, indicating better electrical conductivity on the surface of the PL-4 electrode. Compared with PL-12, the Rct of the PL-4 electrode changes more gently, corresponding to a lower range of contraction and expansion of the c-axis lattice during change/discharge progress (Fig. 5f), suggesting a more stable crystal structure and faster charge transfer [25], which is consistent with the results of GITT.
The ex-situ soft X-ray absorption spectroscopy (sXAS) was used to evaluate the chemical states of elementals, reversibility and stability of the crystal structures for PL-4 and PL-12 with different cationic pillar effects. In the Ni L-edge (Figs. 5g-j), the IB/IA ratio increases continuously during charge, which corresponds to the oxidation of Ni, whereas a continuously decrease in the IB/IA ratio during discharge indicates a continuously reduction of Ni. During the 4.0-4.3 V charging period, the IB/IA ratio of PL-4 increased from 0.94 to 1.02, which is a smaller increase than that of PL-12 from 0.91 to 1.15. This result implies that PL-4 experienced less H2-H3 phase transition. During the 4.3-4.0 V discharge, the IB/IA ratio of PL-4 decreased from 1.02 to 0.83, whereas that of PL-12 decreased from 1.15 to 0.77. This smaller decrease in IB/IA ratio for PL-4 was attributed to the better cation pillar effect of the PL-4 material than PL-12, which promotes the reversible phase transition of H2-H3. Besides, the amount of Ni4+ in the PL-12 material is unstable, causing a serious side reaction with the electrolyte and resulting in the generation of an irreversible phase transition. This in turn leads to a series of structural degradation and capacity decay [26]. In addition, when discharged to 2.7 V, the oxidation state of Ni in PL-4 is closer to the open-circuit voltage (OCV) state (Δ = 8.3%) compared to PL-12 (Δ = 16.9%), indicating that the PL-4 material has higher surface stability and structural reversibility due to the good cation pillar effect. In addition to the Ni L-edge, O K-edge SXAS spectra were also collected to analyze the stability of PL-4 and PL-12 cathodes. The pre-edge peak (grey region) in the O K-edge SXAS spectra (Figs. 5k-n) indicate the excitation of the O 1s electrons to the unoccupied hybridized states between O 2p and TM 3d orbitals [27-29], which can be used to quantify the amount of lattice oxygen. The change in the integrated intensities of the TM 3d-O 2p hybridization region of the PL-4 cathode (charge to 4.3 V, Δ = 13.1%; discharge to 2.7 V, Δ = 8.3%) is smaller than that of the PL-12 cathode (charge to 4.3 V, Δ = 34.3%; discharge to 2.7 V, Δ = 6.3%) during charging and discharging, demonstrating that the PL-4 cathode has stable lattice oxygen. Based on the O K-edge and Ni L-edge spectra, it can be concluded that PL-4 shows excellent structural stability and reversibility due to the high cationic pillar effect.
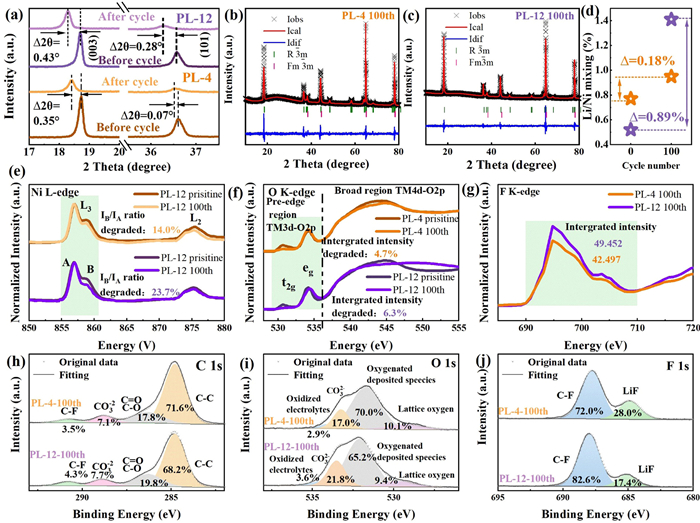
To further investigate the excellent structural stability due to the high cation pillar effect in PL-4 after long cycling, we have performed structural characterization of PL-4 and PL-12 after 100 cycles. As shown in Fig. S21 (Supporting information), the PL-cycled materials maintain the layered structure. Nevertheless, PL-4 showed a much less shift in the main peak than PL-12 after cycling (PL-4, Δθ(003) = 0.35 °; Δθ(101) = 0.07 °; PL-12, Δθ(003) = 0.43 °, Δθ(101) = 0.28 °), indicating that the PL-12 materials experienced more severe structural damage (Fig. 6a). Also, PL-4 shows a smaller increment of Li/Ni disorder (0.18%) when compared to PL-12 (0.89%), according to Rietveld refinement results (Figs. 6b-d), which was attributed to the stable structure of PL-4 with a high cationic pillar effect. Besides, the PL-4 shows a smaller decrease in the average valence of Ni of 14.0% and a smaller decrease in the integrated intensity of TM3d-O2p of 4.7% (Figs. 6e and f), compared to the PL-12 (23.7% and 6.3%, respectively). This result shows that the PL-4 maintains a good structure, whereas the structure of the PL-12 is disrupted. The integrated intensity in the F K-edge of Fig. 6g (green area) represents the degree of the surface degradation by the electrolyte. The integrated intensity of PL-4 is 42.5, which is lower than that of PL-12 (49.5). This result indicates the better stability of the surface structure of PL-4 than PL-12, which is further supported by XPS (Figs. 6h-j and Fig. S22 in Supporting information). According to the C 1s spectra, the quantity of products derived from the carbonate and electrolyte decomposition in cycled PL-4 (CO32-, 7.1%; C-F, 3.5%) was lower than in cycled PL-12 (CO32-, 7.7%; C-F, 4.3%). And the noticeable O 1s peaks at 533 eV in PL-12 imply the large presence of Li2CO3, which is responsible for the rapid capacity decay and retarded Li diffusion [30]. In contrast, the cycled PL-4 exhibits the presence of lattice oxygen as well as fewer CO32- species, implying a cleaner surface and a more stable lattice structure. This finding is further confirmed by the F 1s XPS spectra, where larger amounts of LiF from the decomposition of the electrolyte are identified in the cycled PL-12 than in the cycled PL-4 [31]. The pillar effect of cations plays an important role in stabilizing the structure of the lithium layer, which ensures an effective diffusion channel for Li+ ions during cycling and increases the reversibility of the structure. Therefore, the adjustment of Li/Ni disorder and residual Na+ by ion exchange can optimize the pillar effect of cations, resulting in a stable crystal structure of the prepared materials, which leads to excellent cycling performance.
Figure 6
Figure 6.
(a) XRD patterns of enlarged view around the main peaks of PL-4 and PL-12 cathodes before and after cycling. The Rietveld refinements of XRD patterns for cycled (b) PL-4 and (c) PL-12 cathodes. (d) The plot of Li/Ni mixing as the function of the cycle numbers of the PL-4 and PL-12 cathodes. The sXAS spectra of the (e) Ni L-edge, (f) O K-edge and (g) F K-edge of the before and after cycled PL-4 and PL-12 materials. The XPS spectra of (h) C 1s, (i) O 1s, (j) F 1s of the cycled PL-4 and PL-12 cathodes.
In summary, we systematically investigated the pillar effect contributed by Ni2+ and Na+ on the enhanced structural stability of ion-exchanged Ni-rich materials. By adjusting the reaction driving force (the molar ratio of Li+/Na+) during ion exchange, we modulated the cation pillar effects of Ni-rich products. Correlating the structure with electrochemical performance, we found that Ni2+ is approximately 3.5 times more effective as pillar than Na+, which is further supported by theoretical calculations that Ni2+ in Li slab provides stronger structural strength than Na+ in the deeply delithiated state of NCM. The PL-4 cathode with 0.77% Ni2+ and 0.153% Na+ in Li layer achieves the best structural stability with a high lattice energy, which is supported by XAFS, SXAS, and HAADF-STEM. At the same time, the PL-4 cathode gets the widest Li-ion interlayer spacing and the highest lithium-ion diffusion kinetics. The structural evolution during charging/discharging also show that a moderate amount of Ni2+ occupies the lithium layer, which plays a greater role in stabilizing the structure and improving the lattice energy compared to Na+. This work provides design principles for the synthesis of layered oxides with high structural stability via ion exchange, potentially leading to the development of advanced cathode materials for high-energy lithium batteries.
The authors declare that they have no known competing financial interests or personal relationships that could have appeared to influence the work reported in this paper.
Acknowledgments
This work was supported by the National Natural Science Foundation of China (Nos. 52272261 and 52402330), The Science and Technology Innovation Program of Hunan Province (Nos. 2024RC1021 and 2024RC3038), Hunan Provincial Natural Science Foundation of China (No. 2024JJ4062), and The Science and Technology Program of Changsha City (No. kq2402211). This work was supported by the High Performance Computing Center of Central South University. The authors would like to thank DanFeng Yu from Shiyanjia Lab (www.shiyanjia.com) for the XPS and HAADF-STEM analysis. This work was supported by the Beamlines MCD-A and MCD-B (Soochow Beamline for Energy Materials) at NSRL and the Beamlines 1W1B-XAFS at BSRF.
Supplementary materials
Supplementary material associated with this article can be found, in the online version, at doi:10.1016/j.cclet.2025.111700.
Figure 1
(a) The XRD patterns of ion-exchanged layered oxides. (b) XRD patterns of enlarged view around the main peaks in (a). The Rietveld refinements of XRD patterns for (c) IE-4, (d) IE-8, (e) IE-12, and (f) IE-16 materials. The layered oxides obtained by ion exchange under different driving forces with Li/Na molar ratio of 4, 8, 12, 16 are donated as IE-4, IE-8, IE-12 and IE-16, respectively. The ICP results of (g) the Li stoichiometry and (h) the residual Na stoichiometry of ion-exchanged layered oxides. (i) The SEM image of IE-4 materials. Note that the materials obtained by ion exchange under different driving forces with Li/Na molar ratios of 4, 8, 12, 16 are donated as IE-4, IE-8, IE-12 and IE-16, respectively.
Figure 2
The Rietveld refinements of XRD patterns for (a) PL-4, (b) PL-8, (c) PL-12, and (d) PL-16 materials. XRD patterns of enlarged view around the main peaks for (e) IE materials and (f) PL materials. The IE-4, IE-8, IE-12 and IE-16 materials were pre-lithiated and donated as PL-4, PL-8, PL-12, and PL-16, respectively. (g) The Li/Ni disorder and the residual Na stoichiometry as the function of the molar ratio of Li+/Na+. (h) The TTMO6 and TLiO6 as the function of the molar ratio of Li+/Na+. (i) The SEM image of PL-4 materials. Note that the IE-4, IE-8, IE-12 and IE-16 were treated by heat treatment was donated as PL-4, PL-8, PL-12 and PL-16, respectively.
Figure 3
(a) Initial charge/discharge curves of PL cathodes. (b) The cycling performance of PL cathodes at a constant rate of 1 C. (c) The cation pillar effect and retention rate of PL cathodes as the function of the molar ratio of Li+/Na+. (d) The cycling performance of PL-4 and PL-12 cathodes at a constant rate of 5 C over 100 cycles. (e) The rate performance of PL cathodes at 0.2, 0.5, 1, 2, 5 and 10 C. (f) The TLiO6 and discharge capacity of PL cathodes at 10 C as the function of the molar ratio of Li+/Na+. (g) The discharge curves of PL-4 and PL-12 from 1st to 100th cycle. The dQ/dV curves from 1st to 100th cycle of (h) PL-4 and (i) PL-12 cathodes.
Figure 4
(a) The structural models of Li0.33NCM85, Li0.33NCM-Li/Ni disorder and Li0.33NCM-Na materials with [100] direction and [111] direction. (b) Equation of states and fitting bulk modulus for delithiated NCM materials (the baseline NCM, Li/Ni disordered NCM, and Na-residual are donated as Li0.33NCM85, Li0.33NCM-Li/Ni disorder, and Li0.33NCM-Na, respectively). (c) The fitting bulk modulus of Li0.33NCM85, Li0.33NCM-Li/Ni disorder and Li0.33NCM-Na materials. Note that the delithiated NCM is represented by a Li stoichiometry of 33.3% for DFT calculations, given that the state of charge at 4.3 V is roughly 67% at 1 C.
Figure 5
(a) The XANES curves of Ni K-edge of PL-4 and PL-12 cathodes. (b) EXAFS curves of PL-4 and PL-12 cathodes at R space. (c) EXAFS curves of PL-4 and PL-12 cathodes at k space. The EXAFS WT images of (d) PL-4 and (e) PL-12 cathodes. (f) The evolution of Rct and Rs impedance of PL-4 and PL-12 cathodes during the discharge/charge processes. The ex-situ sXAS spectra of the Ni L-edge of (g) PL-4 and (i) PL-12 cathodes, along with the corresponding IB/IA ratio of (h) PL-4 and (j) PL-12 cathodes. The ex-situ sXAS spectra of the O k-edge of (k) PL-4 and (m) PL-12 cathodes, along with the corresponding integrated intensity of the gray region in k,m of (l) PL-4 and (n) PL-12 cathodes.
Figure 6
(a) XRD patterns of enlarged view around the main peaks of PL-4 and PL-12 cathodes before and after cycling. The Rietveld refinements of XRD patterns for cycled (b) PL-4 and (c) PL-12 cathodes. (d) The plot of Li/Ni mixing as the function of the cycle numbers of the PL-4 and PL-12 cathodes. The sXAS spectra of the (e) Ni L-edge, (f) O K-edge and (g) F K-edge of the before and after cycled PL-4 and PL-12 materials. The XPS spectra of (h) C 1s, (i) O 1s, (j) F 1s of the cycled PL-4 and PL-12 cathodes.


 DownLoad:

 下载:


 下载:

