Citation:
Jiawei Ge, Hao Wan, Feng Gao, Heyuan Tian, Jiangying Qu, Xian Wang, Junjie Ge. B and Sr co-doping suppressed Pt oxidative passivation enables fast water oxidation in PEMWE[J]. Chinese Chemical Letters,
2026, 37(10): 111657.
doi:
10.1016/j.cclet.2025.111657
B and Sr co-doping suppressed Pt oxidative passivation enables fast water oxidation in PEMWE
English
B and Sr co-doping suppressed Pt oxidative passivation enables fast water oxidation in PEMWE
Dongguan Key Laboratory of Low-Carbon Recycling and Utilization, School of Environment and Civil Engineering, Dongguan University of Technology, Dongguan 523808, China
b.
School of Chemistry and Materials Science, University of Science & Technology of China, Hefei 230026, China
Received Date:
19 May 2025 Accepted Date:
30 July 2025 Revised Date:
18 July 2025 Available Online:
15 October 2026
Abstract:
The large-scale deployment of proton-exchange membrane water electrolysis (PEMWE) is plagued by the exclusively rely on Ir for anode water oxidation. Platinum (Pt), as one of the few acid stable elements, has long been ignored as a possible alternative due to its surface oxidation and passivation. In this study, we incorporate boron (B) and strontium (Sr) into Pt to achieve notable promotion in catalytic activity and long-term anti-passivation feature. While B serves as an electron reservoir by donating charge to Pt sites, Sr induces compressive strain to suppress lattice oxygen formation. The synergistic effects of B and Sr effectively modulate Pt-O orbital coupling from oxidative passivation and confer the best water oxidation activity and stability. Notably, the B,Sr-Pt catalyst achieves a low overpotential of 308 mV at 10 mA/cm2 in 0.5 mol/L H2SO4, approaching those of the Ir based catalysts. In PEMWE devices, B,Sr-Pt exhibits an operating voltage of 2.061V at 1 A/cm2 and operate stably for 240h at 1 A/cm2. These findings offer a promising strategy for enhancing the OER efficiency and durability of Pt-based catalysts by effectively addressing Pt site passivation.
Proton-exchange membrane water electrolysis (PEMWE) is the only mature hydrogen production technology that can directly utilize intermittent renewable energy sources such as solar and wind. However, the widespread adoption of PEMWE is hindered by its exclusive reliance on expensive iridium (Ir) at the anode. Given that global Ir production is limited to only 7–8 tons per year, the high Ir loadings required (typically 1–2 mg Ir/cm2) for terawatts scale integration pose a major challenge [1-3]. Meanwhile, the harsh operating conditions, especially the highly acidic working condition and the strong oxidative electrode potential, further complicate the search for catalysts that can balance activity and durability.
Platinum (Pt), with 25-fold higher crustal abundance and a cost reduction of over 80% compared to Ir, is a critically acid-stable catalyst under industrially relevant anodic conditions [4]. However, Pt faces significant limitations in the oxygen evolution reaction (OER) due to its susceptibility to oxidation and surface passivation at anodic potentials [5,6]. Unlike Ir- and Ru-based catalysts, where oxides act as the active sites towards OER, the formation of PtOx film on the surface is electronically insulating that impedes both charge transport and reaction kinetics [7-10]. Tobias Reier et al. [11] compared Pt nanoparticles with bulk Pt, demonstrating that nanoparticles exhibit lower OER activity due to their increased oxophilicity and more pronounced PtOx formation under anodic conditions. In spite that theoretical analysis that Pt near the vertex of the OER activity volcano plot [6], its OER activity legs far behind that of Ir- and Ru-based catalysts. The Pt surface oxidation proceeds through the following path: H2O molecules firstly adsorb on the Pt surface to form adsorbed OH* sites at specific anodic potentials (>0.7V); as the potential increases, oxygen species penetrate deeper into the Pt sublayer, creating a stable three-dimensional oxide structure [9]. We envision that by suppressing the Pt oxidation layer formation, we might be able to unleash the catalytical potential of Pt, making it a promising candidate to replace Ir based catalysts.
We herein tackle the longstanding challenge of Pt via introducing boron (B) and strontium (Sr) co-doping to regulate the oxidation behavior of Pt-based catalysts and improve OER performance. Boron functions as an electron reservoir, supplying additional charge to alleviate Pt oxidation and enhance charge transfer. Meanwhile, Sr doping induces compressive stress in the Pt lattice, downshifting the Pt d-band and suppressing the formation of lattice oxygen. The synergistic effect of electron donation and lattice compression minimizes Pt oxidation while optimizing the catalytic reaction kinetics towards OER. The B,Sr-Pt catalyst exhibits a low overpotential of 308 mV at 10 mA/cm2 and demonstrates excellent stability. When evaluated in PEMWE devices, B,Sr-Pt reaches 2.061V at 1 A/cm2 and remains stable for 240h at 1 A/cm2. These findings offer new insights into the degradation mechanisms of Pt-based catalysts in OER and provide a promising strategy for designing efficient, durable Pt-based anodes for PEMWE systems.
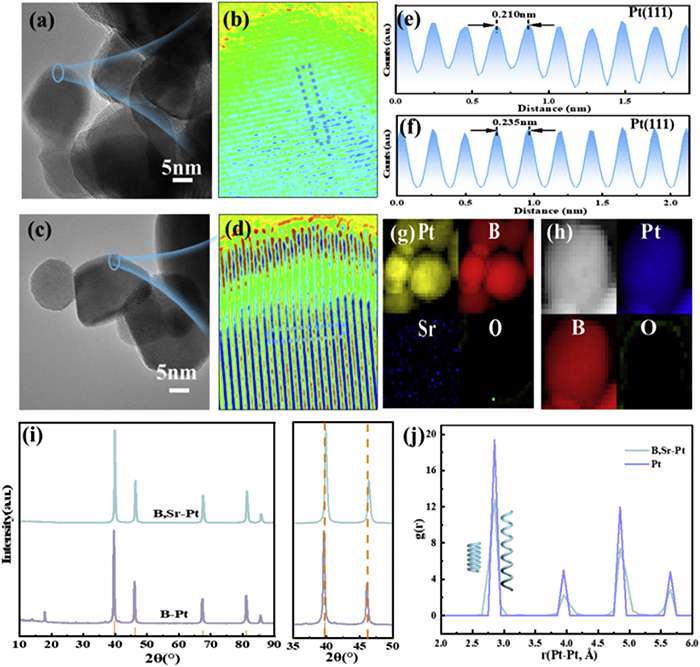
A simple chelation reaction was employed to synthesize B- and Sr-co-doped Pt catalysts (see Supporting information for experimental details). The prepared samples are characterized for comparison. According to high-angle annular dark-field scanning transmission electron microscopy (HAADF-STEM) in Figs. 1a and c, obtained samples consist of well-dispersed nanoparticles with diameters ranging from 11 nm to 24 nm. Figs. 1b and d-f suggest distinctive lattice expansion and suppression upon B and B,Sr co-doping, respectively. Specifically, the standard fringe lattice spacing of the Pt (111) plane is 0.226 nm (PDF #04–0802). Upon B doping, the lattice fringe expanded to 0.235 nm (Fig. 1f), corresponding to 4.0% tensile strain thus achieved. Given the much smaller B radius (~87 pm) in comparison to Pt (~139 pm), the lattice expansion corroborates the successful B incorporation via interstitial doping. After Sr incorporation, however, the interplane distance contracted substantially to 0.210 nm (Fig. 1e), suggesting a 7.1% compressive strain due to B and Sr co-doping. The obvious shrinkage in lattice parameter implies that Sr replaced the Pt sites, and the distinct compressive strain leads to enhanced Pt-Pt d-orbital interaction. The lattice effect of the B and Sr doping on lattice parameter is further verified from XRD patterns (Fig. 1i), with slight negative and positive shifts in Pt diffraction peaks noticed, respectively. Elemental mapping in Figs. 1g and h further verified the uniform distribution of B and Sr in the Pt particles, well aligning with the ICP-MS results (Table S1 in Supporting information). We then further resorted to density functional theory (DFT) calculations to understand the structural modifications induced by B and Sr doping [12-14]. The overall doping, however, is dominated by compressive strain, with the calculated center at ~2.827Å in comparison to Pt (~2.85Å), in line with the experimental results.
Figure 1
Figure 1.
Preparation and characterization of B-Pt and B,Sr-Pt. HAADF-STEM images of (a) B,Sr-Pt, and (c) B-Pt with (b, d) their corresponding magnified image. Line-scanning intensity profile for (e) B,Sr-Pt and (f) B-Pt, respectively. Element mapping dispersion of (g) B,Sr-Pt, and (h) B-Pt. (i) XRD patterns with their magnified images. (j) The radial distribution function.
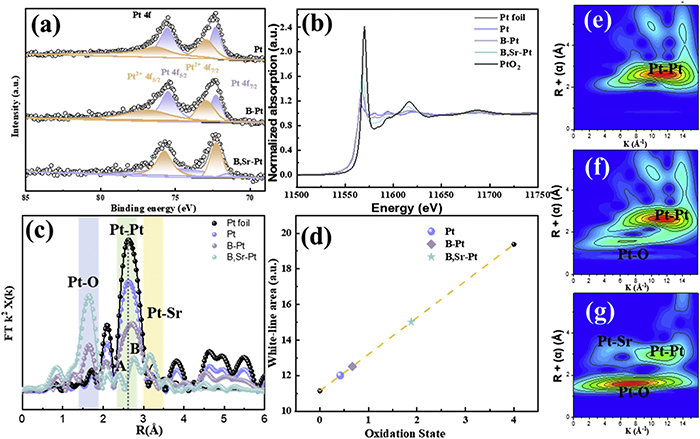
We then resorted to XPS to probe into the surface status of the different catalysts (Fig. 2a). The Pt 4f7/2 spectra exhibit peaks [15-17] at 71.4 and 72.3 eV, while the Pt 4f5/2 spectra show peaks at 74.8 eV and 75.6 eV, with the 71.4 eV/74.8 eV and 72.3 eV/75.6 eV peaks attributed to Pt0 and Pt2+ species, respectively. From the integral area ratio of Pt0 and Pt2+ species, it is evident that B, Sr-Pt exhibits the highest oxidation state among the three catalysts, corresponding to the oxygen species adsorption on the catalyst surface. The B and Sr co-doping enhances Pt nanoparticle oxidation, particularly due to Sr, which strongly interacts with oxygen-containing species during annealing.
Figure 2
Figure 2.
Electronic property characterization of the obtained samples. (a) Pt 4f XPS spectra before reaction. (b) Pt L3-edge XANES spectra and (c) FTs of Pt L3-edge EXAFS for B,Sr-Pt, B-Pt, and Pt. (d) The oxidation state of Pt obtained from Fig. 2b. (e-g) WT the Pt L-edge EXAFS signals of Pt, B-Pt, and B,Sr-Pt, respectively.
To further investigate the oxidation state and electronic structure, X-ray absorption near-edge structure (XANES) spectra of the Pt L3-edge for Pt, B-Pt, and B,Sr-Pt catalysts are shown in Fig. 2b. First, the Pt catalyst represent white line intensity resembles that of Pt foil, indicative similar metallic state that of metallic Pt [5,18,19]. The B-Pt sample lies between those of Pt and B,Sr-Pt, and the higher valence state than pristine Pt nanoparticles may be ascribed to the tensile strain exerted by B, which decreased the Pt-Pt orbital interaction and thereby the stronger interaction with the oxygen species. The B,Sr-Pt sample shows the highest white line intensity among the three samples, indicative the highest oxidation state. The calculated Pt valences (Fig. 2d) for Pt, B-Pt, and B,Sr-Pt are +0.42, +0.67, and +1.88, sequentially, aligns well with the XPS analysis. The peak at 1.9Å in Fourier transforms (FTs, Fig. 2c), corresponding to the first shell Pt-O scattering path, is observed in both B-Pt and B,Sr-Pt catalysts. In contrast, the Pt catalyst exhibits characteristic Pt-Pt metallic scattering path resembles that of the Pt foil (2.48–2.79Å), further corroborating its metallic state [18]. The B-Pt catalyst, however, presents a dominate Pt-Pt bonding peak at 2.77Å, indicative of tensile strain. In B,Sr-Pt, the obvious Pt-Pt bonding peaks for the first coordination shell are determined at 2.38 and 2.73Å, respectively, suggesting dominant compressive strain for B,Sr-Pt catalyst. Further, the fitting of Fourier transformed k2-weighted EXAFS (Fig. S3 and Table S2 in Supporting information) shows that B,Sr-Pt has an average bond length of 1.99 and 3.07Å for Pt-O and Pt-Pt bonds, respectively, corresponding to the coordination number (CN) of 5.8 and 2, respectively. Due to high oxygen CN, Pt and B-Pt deliver a higher CN for Pt-Pt bonds (Table S2) than that of B,Sr-Pt. Meanwhile, wavelet transform (WT) analysis further verifies the findings from EXAFS, and provides direct visualization of Pt-Sr bond formation in the B,Sr-Pt catalyst. The results above suggest that B and Sr are doped into Pt while their surface is covered with oxide (H2O/OH).
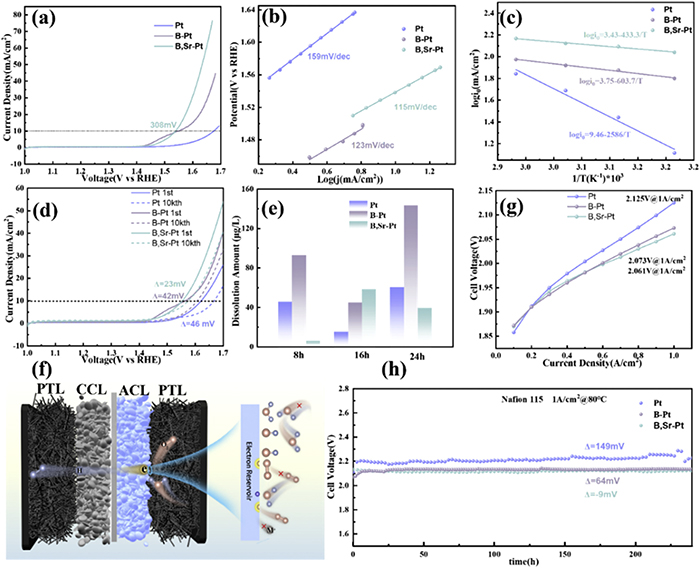
The OER performance of the as-prepared catalysts was assessed in a three-electrode setup in 0.5 mol/L H2SO4 electrolyte. The linear sweep voltammetry (LSV) curves (Fig. 3a) show that B,Sr-Pt catalyst exhibits an overpotential of 308 mV, significantly lower than that of Pt catalyst (~445 mV). Although B-Pt catalyst delivers an overpotential of 322 mV, it features a distinct plateau region at ~10 mA/cm2, indicating kinetic limitations [20]. The intrinsic activity is calculated via normalizing electrochemical active surface areas (ECSA) as shown in Fig. S4b (Supporting information) [21,22]. B,Sr-Pt reaches 0.00311 A/cmECSA2 at 1.7V RHE, slightly higher than that of Pt and B-Pt, indicating the highest intrinsic activity for B,Sr-Pt among them. Furthermore, B,Sr-Pt catalyst demonstrates a Tafel slope of 115 mV/dec, slightly lower than a previously reported value (~120 mV/dec) [3,11,20], suggesting superior catalytic kinetics. Tafel slopes of B-Pt and Pt catalysts are 123 and 159 mV/dec, respectively. To further understand the intrinsic activity, Arrhenius plots were used to evaluate the activation energy (Ea) at different temperatures (Fig. S5 in Supporting information and Fig. 3c) [23]. The calculated Ea values for B,Sr-Pt, B-Pt, and Pt catalysts are 8.3, 11.6, and 49.5kJ/mol, respectively, demonstrating that B,Sr-Pt exhibits the most favorable kinetics for OER among the three samples. The durability of the catalysts was evaluated through accelerated aging tests (AST) over 10,000 cycles within a voltage window of 1.0–1.7V vs. RHE (Fig. 3d). The Pt catalyst shows a significant increase in overpotential of 46 mV, while B-Pt exhibits a slightly lower increase of 42 mV. In contrast, the B,Sr-Pt catalyst displays only a 23 mV increase, indicating much enhanced stability compared to the other catalysts. To further investigate elemental dissolution and structural stability, inductively coupled plasma mass spectrometry (ICP-MS) was conducted coupled with chronopotentiometry (CP) measurements at 10 mA/cm2 over different time intervals (Fig. 3e and Fig. S6a in Supporting information). For the B,Sr-Pt catalyst, the Pt dissolution concentrations at 8, 16, and 24h were 5.8, 58.4, and 39.5µg/L, respectively, indicating that the catalyst reaches a stable state after 16h. In contrast, Pt and B-Pt catalysts exhibited accelerated Pt dissolution beyond 16h, although Pt showed relatively lower dissolution compared to B-Pt. Interestingly, the dissolution concentrations of B and Sr elements remained unchanged from 8h to 24h, suggesting that the initial structural reconstruction (in the first 8h) accounts for the elemental dissolution. Their practical performance was assessed in a proton exchange membrane water electrolyzer (PEMWE) device (Figs. 3f and g). The B,Sr-Pt||Pt/C configuration reached 2.061V at 1 A/cm2, surpassing the performance of B-Pt (2.073V at 1 A/cm2) and Pt (2.125V at 1 A/cm2). Remarkably, the B,Sr-Pt catalyst demonstrated outstanding stability, maintaining steady operation at 1 A/cm2 for over 240h (-∆9 mV), outperforming both B-Pt (∆64 mV) and Pt (∆149 mV). Meanwhile, via comparing the elemental dissolution amounts operated for 10 and 100h in PEMWE at 1 A/cm2 (Fig. S6b in Supporting information), B, Sr and Pt dissolution amounts get alleviated, in good agreement with ultrastable operation performance. These results highlight the exceptional activity and stability of the B,Sr-Pt catalyst in comparison with these catalysts reported in previous literature (Table S3 in Supporting information).
Figure 3
Figure 3.
Electrocatalytic activity evolution. (a) LSV curves with iR correction and (b) Tafel plots. (c) Arrhenius plots. (d) LSV curves before and after AST. (e) The dissolution of Pt element. (f) Schematic illustration of the PEMWE device with anodic interface reaction. (g) Polarization curves of the PEMWE device and (h) their Chronopotentiometry curves.
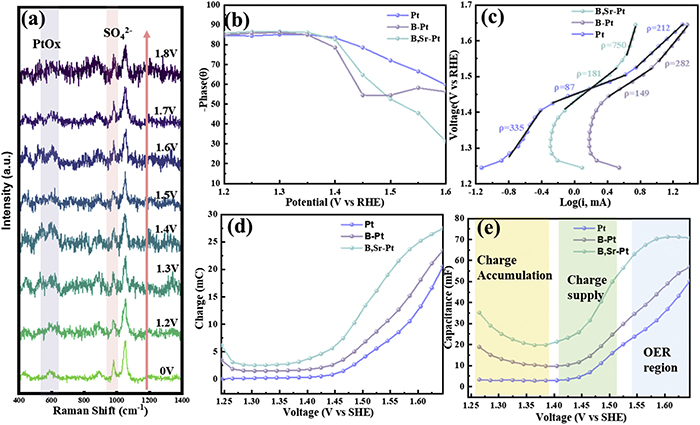
Raman signals (Fig. S8 in Supporting information and Fig. 4a) in the range of 400–700 cm-1 corresponds to the formation of PtOx phase, which could be observed at elevated potentials [24-26]. Interestingly, both Pt and B-Pt catalysts demonstrate gradually intensified peak signal at ~593 cm-1 with electrode potential increases from 1.2V to 1.8V, indicative of progressive oxidation. However, B,Sr-Pt catalyst does not get further oxidized at high overpotential. Therefore, to quantify the oxidation degree, the intensity ratio of the PtOx peak (~593 cm-1) to the sulfate peak (~980 cm-1) was evaluated (Fig. S9 in Supporting information), revealing that the B,Sr-Pt catalyst experiences the least oxidation among the three catalysts.
Figure 4
Figure 4.
OER mechanism of B,Sr-Pt. (a) In-situ Raman spectra of B,Sr-Pt. (b) Response of the phase angle peak to the applied potential. (c) Tafel plot from pulse voltammetry. (d) Anodic charge and (e) capacitance versus potential obtained from pulse voltammetry.
Cyclic voltammetry (CV) curves were recorded to further elucidate the reaction mechanism (Fig. S4a in Supporting information). During the anodic scan, all samples exhibit an oxidation region between 1.0V and 1.38V, followed by OER-dominated regions with further oxidation of active sites at 1.38–1.56V [24,27,28]. Notably, an intense reduction peak at ~1.45V is observed for the B,Sr-Pt catalyst during the cathodic scan, suggesting that it is more readily reduced compared to Pt and B-Pt, even under high potentials. Therefore, Pt electronic structures of these samples after AST are characterized (Fig. S10 in Supporting information). Obviously, B,Sr-Pt represents the lowest valence state among three samples after AST, indicative of the inhibited Pt oxidation and passivation. Moreover, the Pt catalyst even shows the presence of Pt4+ species at the surface, suggestive the formation of insulated PtO2 phase, and well explained the fast deterioration in OER activity during AST and constant current test.
Electrochemical impedance spectroscopy (EIS) was employed to assess the charge transfer kinetics via Nyquist and Bode plots (Fig. S11 in Supporting information and Fig. 4b) [29,30]. The Nyquist plots reveal that B,Sr-Pt exhibits the lowest charge transfer resistance at the catalyst-electrolyte interface, indicating superior charge transport properties [31]. Bode plots, derived from the Nyquist data, further highlight differences in charge conduction and interfacial charge transfer upon structural reconstruction [29]. In the high-frequency region, all three catalysts exhibit stable phase angles, suggesting similar charge transfer resistance within the inner layer. However, in the low-frequency region, the phase angles and peak positions differ significantly, with B,Sr-Pt displaying the smallest phase peak, indicative of faster interfacial charge transfer [29,32]. For the Pt catalyst, the phase angle peak decreases as the potential increases, but remains higher than those of B-Pt and B,Sr-Pt (Fig. 4b). Under anodic conditions, Pt undergoes severe oxidation and O2 evolution. The B-Pt catalyst exhibits a plateau at 1.45 V, associated with severe oxidation and surface reconstruction. In sharp contrast, the phase angle peak for B,Sr-Pt gradually decreases with increasing potential, indicating optimal kinetics throughout the OER process.
Since applied potential modulates charge injection and extraction, thereby influencing charge storage, transfer, extraction and intermediate transformation, pulse voltammetry (PV) was conducted to examine charge dynamics during OER (Figs. S12a–c in Supporting information). The current response to pulse voltage can be divided into steady-state and transient-state regions, corresponding to intermediate transport and dynamic equilibrium, respectively. During cathodic potentials, charge is injected into the catalyst for reduction, while under anodic potentials, charge is extracted for oxidation [33]. The anodic current response to PV measurements is shown in Fig. S12d (Supporting information), and the corresponding Tafel slopes are calculated in Fig. 4c. For the as-prepared catalysts, the Tafel slopes exhibit a multi-linear trend, indicating that the rate-determining step changes under different potentials. In the Pt catalyst, below 1.4 V, the anodic charge remains balanced between oxidation under anodic potentials and reduction under cathodic potentials (Figs. 4d and e). As the potential increases to 1.4–1.5 V, Tafel slope decreases, suggesting that applied potentials facilitate the reduction of oxidized Pt, enhancing activity at higher anodic potentials. However, at potentials exceeding 1.5V, mass transfer limitations and severe oxidation hinder OER performance due to the presence of relatively low-valence Pt sites. Similar trends are observed for B-Pt and B,Sr-Pt catalysts. Further, the anodic charge is used to determined interfacial electron storage, extraction and transfer. The integrated charge of B,Sr-Pt and B-Pt catalyst at the corresponding potentials suppresses that of Pt catalyst, indicating that B acts as electron reservoir to promote the electron extraction and transfer from the as-prepared catalysts. In the initial potential region (<1.4 V), total capacitance gradually decreases for B-Pt and B,Sr-Pt, indicating that injected electrons (reduction reaction) are over the extracted electrons (oxidation reaction). Upon applying cathodic potentials, charge is stored within the catalysts via reduction, compensating for charge extracted during anodic oxidation. The doped B enables to provide rich electrons to Pt sites for enhanced OER and relieved oxidation. Furthermore, the introduced Sr promotes the electron reservoir effect. In the 1.4–1.5 V region, total capacitance progressively increases due to charge release from pre-stored electrons and applied cathodic potentials, optimizing OER process. Finally, OER and Pt oxidation reach a balance for B,Sr-Pt catalyst, in agreement with a capacitance plateau in the OER region. However, the progressive Pt oxidation can be observed in the whole PV curve. Among all catalysts, B,Sr-Pt exhibits the highest charge storage/capacitance, suggesting that OER performance is not hindered by charge transfer limitations. This behavior can be attributed to the strong electron reservoir effect of B,Sr-Pt, which enhances charge storage and supply, thereby facilitating superior catalytic activity.
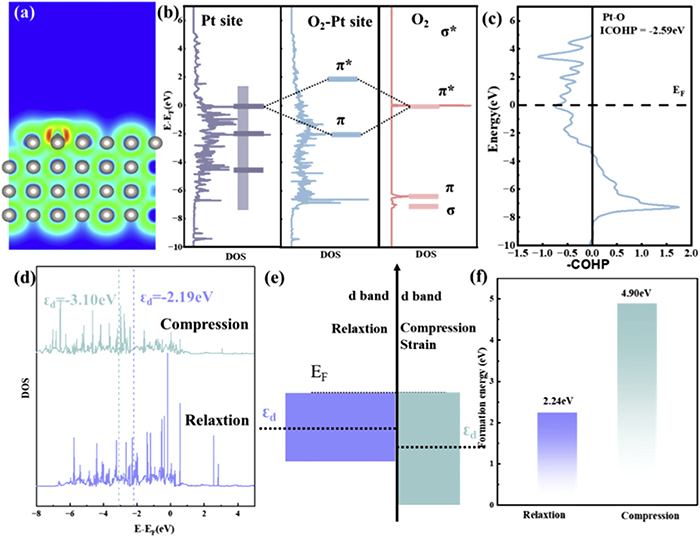
To explore the effect of doped B on active Pt sites, we utilize a B atom to dope as catalyst model as shown in Fig. S17 (Supporting information) and Fig. 5a. As the electron localization function (ELF) is displayed in Fig. 5a, electrons are localized around the B atom to supply rich electrons to Pt atoms. In the meanwhile, the charge is redistributed between B and Pt atoms in the differential charge density mapping (Fig. S17a). The Bader charge analysis reveals Pt atom seizes 0.12|e| from the B atom, indicating that B acts as an electron reservoir to supply charge to Pt atoms. The electrostatic potential in Fig. S17b also demonstrates that the introduced B affects the energy redistribution for the superior charge transfer. Furthermore, we explore the oxidation mechanism of Pt by analyzing the orbital coupling of the Pt site and O atoms. As the model is displayed in Figs. S18c and d (Supporting information), O2 delivers a π* orbital around EF, which is beneficial to couple with Pt orbital at the energy level of ~EF. The O2 energy gets effectively lowered via orbital overlapping, indicating Pt site tends to be oxidized. As COHP is shown in Fig. S18b (Supporting information), the value of iCOHP is as high as −2.92 eV, indicating a strong bonding between Pt and O atom. Fig. S19a (Supporting information) also displays an obvious electron localization between O and Pt atoms, corresponding to a strong bonding. After the coupling of O and Pt atoms, the Pt atom loses 0.56|e| (Fig. S19b in Supporting information). In comparison, the introduced B lowers Pt d band orbital (Fig. S22 in Supporting information), especially at the fermi level, thus not favorable for the bonding of O (π* orbital) and Pt atoms (Fig. 5b) as the model is shown in Fig. S20 (Supporting information). The value of iCOHP is −2.59 eV for B-Pt (Fig. 5c), lower than that of Pt, indicating a weak bonding between Pt and O atoms for B-Pt. Apart from electron localization between Pt and O atoms, ELF in Fig. S21a (Supporting information) also reveals the rich charge around the B atom to supply charge to Pt atoms. And, differential charge density in Fig. S21b (Supporting information) indicates Pt atom only loses 0.34|e| for B-Pt after the bonding of O and Pt atoms, lower than that of Pt, namely a lower oxidation for B-Pt.
Figure 5
Figure 5.
(a) ELF of B-Pt. (b) DOS of O2 with Pt site from B-Pt catalyst before and after bonding. (c) Calculated COHP diagrams for Pt-O bond of B-Pt catalyst. (d) The DOS under relaxation and compression stress and (e) the corresponding energy band structure. (f) Bulk oxygen formation energy from surface oxygen under relaxation and compression stress.
Given that the introduced Sr results in the slight lattice compression, we apply a 5% compression stress on Pt to determine the roles of doping Sr in Pt. As the Pt d band is shown in Fig. 5d, Pt under compression stress delivers the Pt d band center of −3.10 eV, far lower than that under relaxation (−2.19 eV). As a schematical illustration is displayed in Fig. 5e, compression stress broadens the Pt d band, leading to the decrease of the Pt d band center. Therefore, the Pt orbital under compression stress is lowered, not favorable for the coupling of Pt and O atoms. Further, we calculate the formation energy from surface oxygen to lattice oxygen as the model is shown in Fig. S23 (Supporting information). The formation energy under compression stress is as high as 4.90 eV (Fig. 5f), higher than that under relaxation (2.24 eV), indicating compression stress enables to relieve the oxidation of Pt atoms. In conclusion, Pt is a promising candidate for OER, yet confused by the charge conduction and transfer from its heavy oxidation under anodic potential. As shown in Fig. 5g, the introduced B can act as electron reservoir to supply charge to Pt atoms; additionally, compression stress lowers Pt d band orbitals to relieve the oxidation of Pt atoms.
This work presents a B and Sr co-doped Pt catalyst that efficiently facilitates OER by mitigating the oxidation of Pt sites. The introduced B acts as an electron reservoir, supplying charge to suppress local oxidation of Pt sites. Additionally, the compressive stress induced by Sr incorporation into Pt modulates the Pt d band, leading to weaker bonding between O and Pt atoms. This synergistic effect of electron reservoir and compression stress significantly reduces Pt site oxidation, promoting fast charge transfer. Notably, the B,Sr-Pt catalyst exhibits an overpotential of 308 mV at 10 mA/cm2 and a long lifespan. In PEMWE devices, B,Sr-Pt demonstrates a low voltage of 2.061V at 1 A/cm2 and maintains stable performance for 240h at 1 A/cm2.
The authors declare that they have no known competing financial interests or personal relationships that could have appeared to influence the work reported in this paper.
Acknowledgments
The work was supported by the National Natural Science Foundation of China (Nos. U22A20396, 22209168), and Natural Science Foundation of Anhui Province (No. 2208085UD04), the Liaoning Binhai Laboratory (No. LBLF-2023–04), the Shandong Energy Institute (No. SEI U202307), the Fundamental Research Funds for the Central Universities (No. WK2090000056), and General Project of Guangdong Provincial Natural Science Foundation (No. 2025A1515011741). We thank the USTC supercomputing center for providing computational resources for this project.
Supplementary materials
Supplementary material associated with this article can be found, in the online version, at doi:10.1016/j.cclet.2025.111657.
[1]
J.T. Ren, L. Chen, H.Y. Wang, et al., Energy Environ. Sci. 17 (2024) 49–113. doi: 10.1039/d3ee02467a
[2]
H.B. Tao, H. Liu, K. Lao, et al., Nat. Nanotechnol. 19 (2024) 1074–1076. doi: 10.1038/s41565-024-01699-x
[3]
M. Chatenet, B.G. Pollet, D.R. Dekel, et al., Chem. Soc. Rev. 51 (2022) 4583–4762. doi: 10.1039/d0cs01079k
L. Wu, W. Huang, D. Li, et al., Angew. Chem. Int. Ed. 64 (2025) e202413334. doi: 10.1002/anie.202413334
[31]
X. Wang, Z. Li, H. Jang, et al., Adv. Energy Mater. 15 (2024) 2403388.
[32]
L. Deng, S.F. Hung, Z.Y. Lin, et al., Adv. Mater. 35 (2023) e2305939. doi: 10.1002/adma.202305939
[33]
H.N. Nong, L.J. Falling, A. Bergmann, et al., Nature 587 (2020) 408–413. doi: 10.1038/s41586-020-2908-2
Figure 1
Preparation and characterization of B-Pt and B,Sr-Pt. HAADF-STEM images of (a) B,Sr-Pt, and (c) B-Pt with (b, d) their corresponding magnified image. Line-scanning intensity profile for (e) B,Sr-Pt and (f) B-Pt, respectively. Element mapping dispersion of (g) B,Sr-Pt, and (h) B-Pt. (i) XRD patterns with their magnified images. (j) The radial distribution function.
Figure 2
Electronic property characterization of the obtained samples. (a) Pt 4f XPS spectra before reaction. (b) Pt L3-edge XANES spectra and (c) FTs of Pt L3-edge EXAFS for B,Sr-Pt, B-Pt, and Pt. (d) The oxidation state of Pt obtained from Fig. 2b. (e-g) WT the Pt L-edge EXAFS signals of Pt, B-Pt, and B,Sr-Pt, respectively.
Figure 3
Electrocatalytic activity evolution. (a) LSV curves with iR correction and (b) Tafel plots. (c) Arrhenius plots. (d) LSV curves before and after AST. (e) The dissolution of Pt element. (f) Schematic illustration of the PEMWE device with anodic interface reaction. (g) Polarization curves of the PEMWE device and (h) their Chronopotentiometry curves.
Figure 4
OER mechanism of B,Sr-Pt. (a) In-situ Raman spectra of B,Sr-Pt. (b) Response of the phase angle peak to the applied potential. (c) Tafel plot from pulse voltammetry. (d) Anodic charge and (e) capacitance versus potential obtained from pulse voltammetry.
Figure 5
(a) ELF of B-Pt. (b) DOS of O2 with Pt site from B-Pt catalyst before and after bonding. (c) Calculated COHP diagrams for Pt-O bond of B-Pt catalyst. (d) The DOS under relaxation and compression stress and (e) the corresponding energy band structure. (f) Bulk oxygen formation energy from surface oxygen under relaxation and compression stress.


 DownLoad:

 下载:
下载:


 下载:
下载:

