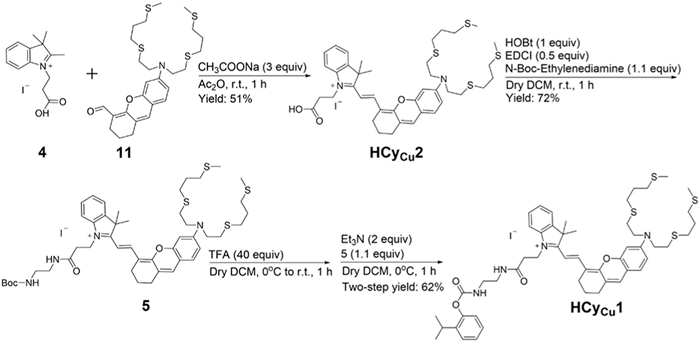
Scheme 1.
Synthesis routes for HCyCu1 and HCyCu2.
A covalent targeted small-molecule probe for fluorescence and photoacoustic dual-modality imaging of Cu(Ⅰ) in tumors
Hang Liu , Qian Sun , Mengxi Dong , Xiaoqing Wang , Zhipeng Liu

Copper, an essential trace element in the human body, plays a vital role in a range of physiological and pathological processes through its redox activity [1]. In particular, the disruption of Cu(Ⅰ) homeostasis has attracted considerable attention in recent years, owing to the discovery of copper-related molecular mechanisms such as copper accumulation and cuproptosis [2–5]. The dual role of copper dysregulation in tumorigenesis and cancer therapy has emerged as a major focus in oncology research [6–8]. Consequently, the dynamic imaging of Cu(Ⅰ) in living tumor tissues is crucial for elucidating its pathological roles in tumor initiation and progression, and for advancing early diagnostic and therapeutic strategies.
Fluorescence imaging, with its non-invasive nature, high sensitivity, and real-time visualization capabilities, has become a powerful tool for the dynamic imaging of Cu(Ⅰ) [9–15]. Numerous high-performance fluorescent probes have been developed, enabling precise imaging of Cu(Ⅰ) at the cellular level and in superficial tissues, and offering critical insights into the underlying physiological and pathological mechanisms [16–25]. Notably, the Chang group developed the ratiometric Cu(Ⅰ) probe FCP-1, which facilitated the exploration of the connection between labile intracellular Cu(Ⅰ) pools, glutathione metabolism, and oncogenic transformation [26]. This probe provides a precise tool for investigating the role of Cu(Ⅰ) in cancer progression. The Howell research group employed the CS3 probe to monitor the dynamic fluctuations of Cu(Ⅰ) in a human epithelial cancer cell model, demonstrating its potential as a novel tool for studying Cu-dependent anticancer therapies [27]. However, fluorescence imaging faces inherent limitations such as poor penetration into deep tissues and interference from tissue autofluorescence [28], which hampers its application for high-resolution imaging of Cu(Ⅰ) within live tumors. Addressing this challenge remains a significant objective in the field of molecular probe design Scheme 1.
Photoacoustic (PA) imaging, a non-invasive technique that offers deep tissue penetration and high spatial resolution, has garnered significant attention in biomedical imaging [29–32]. A range of small-molecule PA probes have been developed for imaging of various biological targets within deep living tissues [33,34]. Recent studies have demonstrated the immense potential of small-molecule PA probes for high-resolution, dynamic in vivo imaging of Cu(Ⅰ)/Cu(Ⅱ) [35–40]. For instance, the Chan group reported Cu(Ⅰ)-responsive PA probe, enabling in situ imaging of Cu(Ⅰ) levels in a Wilson's disease mouse model [38]. Our group has further advanced the field by designing a ratiometric PA probe capable of crossing the blood-brain barrier, which, combined with three-dimensional (3D) PA imaging techniques, allowed high-resolution mapping of Cu(Ⅱ) distribution in the brains of Parkinson's disease model mice [39].
Nevertheless, PA probes continue to face challenges such as long signal acquisition times and relatively low sensitivity compared to fluorescence imaging, limiting their utility for real-time imaging. Integrating the high sensitivity of fluorescence imaging with the deep-tissue, high-resolution capabilities of PA imaging offers a promising strategy to overcome the limitations of single-modality approaches [41–45]. Therefore, the development of Cu(Ⅰ) probes with fluorescence and PA dual-modality imaging capabilities represents a promising solution for the sensitive and high-resolution imaging of Cu(Ⅰ) within living tumors. In this study, we designed and synthesized a small molecular probe, HCyCu1, which integrates dual fluorescence and PA imaging functionalities. By introducing a tumor-targeting moiety, we achieved in situ high-resolution imaging of Cu(Ⅰ) within living tumor tissues (Fig. 1).
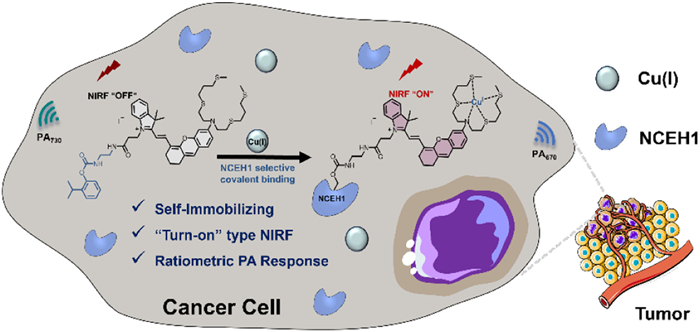
To realize the dual-modal fluorescence and PA imaging capabilities of the probe, we selected a hemicyanine platform, which offers a balanced performance in both fluorescence and PA properties in the near-infrared (NIR) region [41,46]. An open-chain thia-crown ether, capable of selectively coordinating with Cu(Ⅰ), was introduced at the 6-position of the xanthene unit [18]. Upon coordination with Cu(Ⅰ) via the nitrogen atom at the 6-position and the sulfur atoms of the thia-crown ether, the electron-donating ability of the nitrogen atom is diminished, leading to suppression of the intramolecular charge transfer (ICT) effect. Consequently, the absorption maximum (λabs) of the probe undergoes a blue shift, enabling ratiometric PA response to Cu(Ⅰ). In parallel, Cu(Ⅰ) coordination mitigates the fluorescence quenching effect typically induced by the thia-crown ether, resulting in fluorescence enhancement [47]. The changes in ratiometric PA signal and fluorescence intensity upon Cu(Ⅰ) binding collectively endow the probe with tunable dual-modality imaging capabilities.
Given that neutral cholesterol ester hydrolase 1 (NCEH1) is highly overexpressed in malignant tumors, targeting NCEH1 represents an effective strategy for tumor-specific imaging [48,49]. To this end, we functionalized the 1-position of the indolium moiety with an O-2-isopropylphenyl group, a ligand known for its specific affinity toward NCEH1. Notably, upon binding to NCEH1, the O-2-isopropylphenyl group can undergo a nucleophilic cascade reaction initiated by the hydroxyl group of the active-site serine, leading to the cleavage of the carbonate linkage and covalent anchoring of the probe to NCEH1 [50,51]. This covalent binding mechanism effectively minimizes false-positive signals arising from free probe diffusion. The synthetic routes for the probe is outlined in Scheme 1 and Scheme S1 (Supporting information).
We initially characterized the photophysical properties of HCyCu1 and HCyCu2 in ethanol/MOPS buffer (20 mmol/L, pH 7.0, 1:9, v/v). Both probes displayed similar photophysical profiles, with λabs at 715 nm and molar extinction coefficients (ε) of 8.6 × 10⁴ L mol−1 cm−1, respectively (Fig. S1 in Supporting information). Upon excitation at 540 nm, maximum emission (λem) was observed at 727 nm, with fluorescence quantum yields (Φf) of 2.1% and 1.9%. These data suggest that the introduction of the targeting moiety at the indolium position exerts minimal influence on the optical properties of the hemicyanine core.
Upon addition of Cu(Ⅰ), the absorption of HCyCu1 and HCyCu2 at 715 and 680 nm diminished, while new peaks emerged at 699 and 665 nm, with intensities increasing proportionally to Cu(Ⅰ) concentration (Fig. 2a and Fig. S2 in Supporting information). The observed hypsochromic-shifts in absorption indicate that Cu(Ⅰ) coordination involves the 6-position nitrogen atom, inhibiting the ICT effect. The appearance of clear isosbestic points at 645, 678, and 707 nm further confirmed a clean, stoichiometric transformation to a single probe+Cu(Ⅰ) complex. The ratio of absorbance at 670 and 730 nm (Abs670/730) also increased linearly with Cu(Ⅰ) concentration, plateauing at a 1:1 stoichiometry.
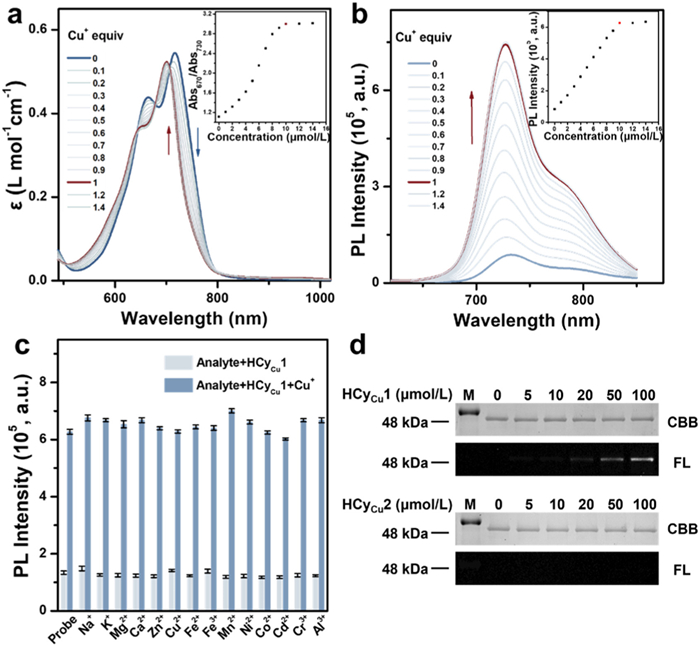
Fluorescence titration studies revealed a concentration-dependent enhancement in emission at 727 nm, with approximately 15-fold and 5-fold increases for HCyCu1 and HCyCu2, respectively (Fig. 2b and Fig. S3 in Supporting information). This behavior corroborates the 1:1 Cu(Ⅰ) binding model. Notably, unlike the absorption shift, the λem remained unchanged after Cu(Ⅰ) binding, likely due to Cu–N bond dissociation at the excited state. Upon binding with Cu(Ⅰ), the Φf of HCyCu1 and HCyCu2 increase to 8.2% and 6.8%, respectively. This enhancement significantly improves their fluorescent properties and contributes to a more balanced performance between fluorescence and PA imaging, thereby making the probes more suitable for dual-modal imaging applications.
The dissociation constants (Kd) of HCyCu1 and HCyCu2, determined via a thiourea competitive assay, were found to be 1.68 × 10⁻¹³ and 1.65 × 10⁻¹³ mol/L, respectively (Fig. S4 in Supporting information). Although these values reflect strong Cu(Ⅰ) binding, they remain higher than the Kd values of endogenous Cu(Ⅰ)-binding proteins under physiological conditions (~10–18 mol/L) [20], suggesting that the probes do not compete with tightly bound Cu(Ⅰ) pools. Therefore, they are well-suited for selectively responding to labile Cu(Ⅰ) under pathological conditions. We further conducted 1H nuclear magnetic resonance (NMR) titration experiments to provide further evidence for Cu(Ⅰ) binding (Fig. S5 in Supporting information). Gradual addition of Cu(Ⅰ) to HCyCu1 in CD3CN resulted in a progressive downfield shift of the proton signals corresponding to the ethylene groups within the thia-crown ether unit, from 2.02, 2.55, and 2.74 ppm to 2.04, 2.58, and 2.80 ppm upon reaching 1 equiv. of Cu(Ⅰ). Concurrently, the proton signals at the 5- and 7-positions of the xanthene moiety shifted from 6.67 to 6.82 ppm to 6.69 and 6.84 ppm, suggesting that the nitrogen atom at the 6-position was involved in Cu(Ⅰ) coordination. This coordination event led to a decrease in electron density around the 5- and 7-positions, resulting in downfield shifts of their corresponding proton resonances. These NMR titration experiments further confirmed the formation of the probe+Cu(Ⅰ) complex.
We next assessed probe selectivity by incubation HCyCu1 and HCyCu2 with a variety of biologically relevant species, including metal ions, anions, reactive oxygen species (ROS), and reactive sulfur species (RSS). Only Cu(Ⅰ) triggered significant changes in Abs670/730 and fluorescence intensity, demonstrating excellent selectivity even under complex biological conditions (Fig. S6 in Supporting information). Meanwhile, we further examined the response behavior of HCyCu1 and HCyCu2 to Cu(Ⅰ) in the presence of various biological species. Encouragingly, the results demonstrated that these analytes did not interfere with the response behavior of HCyCu1 and HCyCu2 to Cu(Ⅰ) (Fig. 2c, Fig. S7 in Supporting information). Moreover, both the absorption and emission spectra of HCyCu1 and HCyCu2 maintained stability across the physiological pH range and consistent Cu(Ⅰ) responsiveness (Fig. S8 in Supporting information).
We further evaluated the selective NCEH1-targeting ability of HCyCu1 using sodium dodecyl sulfate–polyacrylamide gel electrophoresis (SDS-PAGE) analysis. As shown in Fig. 2d, HCyCu1 exhibited a concentration-dependent fluorescence enhancement at the NCEH1 band, whereas no fluorescence signal was detected for HCyCu2. These results demonstrate that HCyCu1 possesses superior labeling efficiency compared to HCyCu2, underscoring that the introduction of the O-2-isopropylphenyl group significantly enhances the covalent targeting ability of HCyCu1 toward NCEH1.
The highly selective response to Cu(Ⅰ) and the excellent NCEH1 covalent targeting ability of HCyCu1 promoted us to further investigate the in vitro and in vivo imaging ability. Before the imaging studies, we first evaluated the cytotoxicity of HCyCu1 and HCyCu2 in multiple cell lines via standard MTT (3(4,5-dimethylthiazol-2-yl)-2,5-diphenyl tetrazolium bromide) assays (Fig. S9 in Supporting information). Both HCyCu1 and HCyCu2 showed negligible effects on the viability of HepG2, HeLa, 293T and AML12 cell with the concentration up to 20 µmol/L, which affirm the biosafety profile these probes.
Next, we performed the fluorescent imaging capability of HCyCu1 and HCyCu2 in HepG2 cells (Fig. 3, Figs. S10 and S11 in Supporting information). Following direct incubation of the probes with cells for 30 min (Ctrl+probe group), weak intracellular fluorescence was observed (Fig. 3a and Fig. S11a), suggesting that both probes possess good membrane permeability. Under identical conditions, cells pretreated with the copper chelator ammonium tetrathiomolybdate (ATTM) (ATTM+probe group) exhibited markedly reduced fluorescence compared to the Ctrl+probe group (Fig. 3b and Fig. S11b), indicating that labile Cu(Ⅰ) was effectively captured by ATTM, thereby preventing its coordination with the probes.
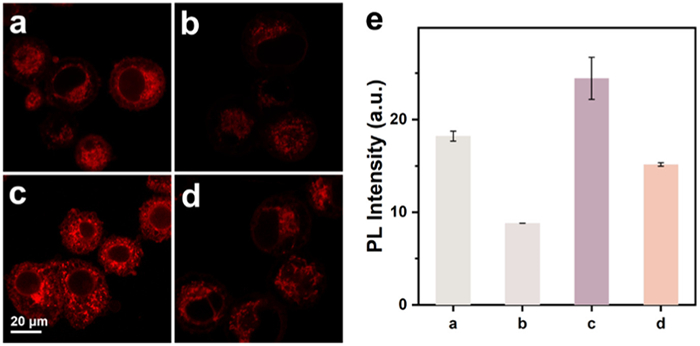
Notably, cells treated with CuCl2 and the probes (CuCl2+probe group) showed a significant fluorescence increase compared to the ATTM+probe group, 3.02-fold for HCyCu1 and 4.68-fold for HCyCu2 (Figs. 3c and e, Fig. S11c). This fluorescence enhancement was subsequently reversed upon further incubation with ATTM (Fig. 3d and Fig. S11d). Collectively, these results confirm that the fluorescence responses of HCyCu1 and HCyCu2 in cells are driven by Cu(Ⅰ) levels and demonstrate their capability for dynamic monitoring of intracellular Cu(Ⅰ) fluctuations.
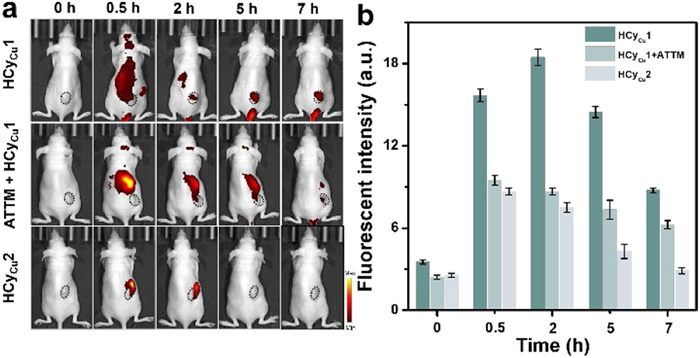
To further evaluate the in vivo fluorescence imaging performance of the probes, HCyCu1 and HCyCu2 were administered via tail vein injection into 4T1 tumor-bearing mice. All animals were treated according to the Guide for Care and Use of Laboratory Animals, approved by the Animal Experimentation Ethics Committee of Nanjing University. In the control group receiving saline, no significant fluorescence signals were observed at the tumor sites. Following injection of the probes, the accumulation of HCyCu1 and HCyCu2 in the tumor regions was monitored over time (Fig. 4a). The results revealed that fluorescence at the tumor site in the HCyCu1 group gradually increased, reaching a maximum at 2 h post-injection. In contrast, the fluorescence signal in the HCyCu2 group decreased significantly over time, nearly disappearing by 5 h. These observations demonstrate the superior tumor-targeting and accumulation capability of HCyCu1 and HCyCu2 (Fig. 4b). To avoid possible interference from other biological factors, ATTM was pre-injected into the tumor site 30 min before the tail vein injection of HCyCu1. Fluorescence imaging showed that the tumor fluorescence intensity in the ATTM-treated group was markedly lower than that in the untreated HCyCu1 group across all time points, confirming that the observed fluorescence signal primarily originated from elevated Cu(Ⅰ) levels in the tumor. These results suggest that HCyCu1 enables effective tumor targeting and in vivo imaging of Cu(Ⅰ) dynamics.
To evaluate the in vivo PA imaging performance of the probes, HCyCu1 and HCyCu2 were administered via tail vein injection into 4T1 tumor-bearing mice, followed by 2D PA imaging (Fig. S12a in Supporting information). Over the course of 2 h, a gradual increase in PA signal intensity was observed at the tumor site in the HCyCu1 group. In contrast, the HCyCu2 group exhibited no significant PA signal enhancement in the tumor region. These results further confirm that the introduction of the O-2-isopropylphenyl group significantly improves tumor retention of HCyCu1, consistent with the fluorescence imaging data (Fig. S12b in Supporting information).
To obtain higher-resolution and more comprehensive spatial distribution data, 3D dual-channel PA imaging was employed. Following tail vein injection of HCyCu1, the spatiotemporal distribution of Cu(Ⅰ) within the tumor was monitored over a 2-h period. The PA signal ratio (PA670/730) steadily increased with time, indicating progressive accumulation of the probe and elevated Cu(Ⅰ) levels (Figs. 5a and b).
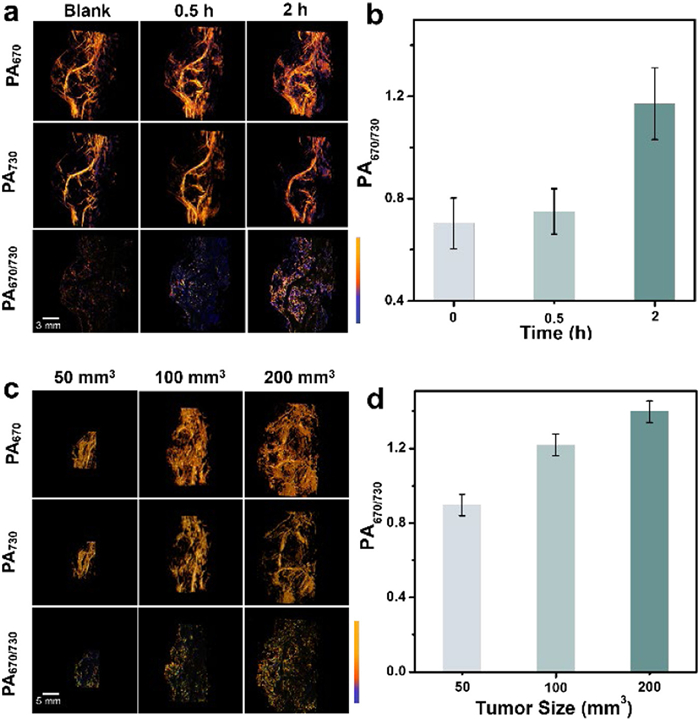
As previously reported, tumors exhibit an increased demand for copper due to their high rates of proliferation and angiogenesis. To further examine the relationship between tumor progression and Cu(Ⅰ) accumulation, we conducted dynamic PA imaging in tumors of varying sizes (50–200 mm3) after HCyCu1 injection. A positive correlation was observed between tumor volume and PA signal ratio, suggesting that Cu(Ⅰ) levels rise in tandem with tumor growth. These findings demonstrate the capability of HCyCu1 to monitor Cu(Ⅰ) dynamics and its potential utility in tumor diagnosis and progression tracking (Figs. 5c and d). In addition, the abdominal vessels are clearly visible in the 730 nm PA channel, with a signal-to-noise ratio (SBR) of 3.91 dB in 3D visualization (Fig. S13a in Supporting information). Therefore, the significant increase in signal ratio and good SBR contribute to clearer tumor imaging as well as more accurate Cu(Ⅰ) distribution information.
In conclusion, we developed HCyCu1, a dual-modality imaging probe for in vivo Cu(Ⅰ) imaging in tumors. This probe exhibits well-balanced NIR fluorescence and PA properties. Upon Cu(Ⅰ) coordination, HCyCu1 shows highly selective NIR fluorescence enhancement and a ratiometric PA response, even in complex biological environments. By incorporating a covalent crosslinking group, the probe gains tumor-targeting capability and significantly improved intratumoral retention. In vitro fluorescence imaging in HepG2 cells confirmed the ability of the probe to image intracellular Cu(Ⅰ) dynamics. Furthermore, validation in a 4T1 tumor-bearing mouse model demonstrated the excellent tumor targeting and dual-modality imaging performance of HCyCu1 for Cu(Ⅰ). These findings position HCyCu1 as a promising tool for Cu(Ⅰ) dual-modal imaging in tumors, offering valuable insights into the role of Cu(Ⅰ) played in tumor progression and potentially aiding in the development of new cancer diagnostic and therapeutic strategies.
The authors declare that they have no known competing financial interests or personal relationships that could have appeared to influence the work reported in this paper.
Hang Liu: Writing – original draft, Methodology, Investigation, Formal analysis, Data curation. Qian Sun: Methodology, Investigation, Formal analysis, Data curation. Mengxi Dong: Methodology, Investigation. Xiaoqing Wang: Writing – review & editing, Supervision, Funding acquisition, Conceptualization. Zhipeng Liu: Writing – review & editing, Supervision, Funding acquisition, Conceptualization.
We thank the National Natural Science Foundation of China (Nos. 22371124 and 22377057), and Natural Science Foundation of Jiangsu Province (Nos. BK20231298 and BK20221333) for financial support.
Supplementary material associated with this article can be found, in the online version, at doi:
S.J. Lippard, J.M. Berg, Principles of Bioinorganic Chemistry, University Science Books, Mill Valley, 1994.
S. Solier, S. Müller, T. Cañeque, et al., Nature 617 (2023) 386–394. doi: 10.1038/s41586-023-06017-4
E. Gaggelli, H. Kozlowski, D. Valensin, G. Valensin, Chem. Rev. 106 (2006) 1995–2044. doi: 10.1021/cr040410w
V. Desai, S.G. Kaler, Am. J. Clin. Nutr. 88 (2008) 855S–858S. doi: 10.1093/ajcn/88.3.855S
B.E. Kim, T. Nevitt, D.J. Thiele, Nat. Chem. Biol. 4 (2008) 176–185. doi: 10.1038/nchembio.72
Y. Yang, M. Li, G. Chen, et al., Coord. Chem. Rev. 495 (2023) 215395. doi: 10.1016/j.ccr.2023.215395
D.L. Tang, G. Kroemer, R. Kang, Nat. Rev. Clin. Oncol. 21 (2024) 370–388. doi: 10.1038/s41571-024-00876-0
E.J. Ge, A.I. Bush, A. Casini, et al., Nat. Rev. Cancer 22 (2022) 102–113. doi: 10.1038/s41568-021-00417-2
J.J.A. Cotruvo, A.T. Aron, K.M. Ramos-Torres, C.J. Chang, Chem. Soc. Rev. 44 (2015) 4400–4414. doi: 10.1039/C4CS00346B
C.J. Fahrni, Curr. Opin. Chem. Biol. 17 (2013) 656–662. doi: 10.1016/j.cbpa.2013.05.019
M.C. Heffern, H.M. Park, H.Y. Au-Yeung, et al., Proc. Natl. Acad. Sci. U. S. A. 113 (2016) 14219–14224. doi: 10.1073/pnas.1613628113
Y. Chen, H. Jiang, T. Hao, Chem. Biomed. Imaging 1 (2023) 590–619. doi: 10.1021/cbmi.3c00029
W. Mao, P. Dong, W. Du, H. Wu, Chem. Biomed. Imaging 3 (2025) 1–4. doi: 10.1021/cbmi.4c00095
A. Sharma, P. Verwilst, M. Li, Chem. Rev. 124 (2024) 2699–2804. doi: 10.1021/acs.chemrev.3c00778
A. Yu, X. He, T. Shen, Chem. Soc. Rev. 54 (2025) 2984–3016. doi: 10.1039/d3cs00520h
R. Cheng, Y. Nishikawa, T. Wagatsuma, et al., ACS Chem. Biol. 19 (2024) 1222–1228. doi: 10.1021/acschembio.4c00011
M. Priessner, P.A. Summers, B.W. Lewis, et al., Angew. Chem. Int. Ed. 60 (2021) 23148–23153. doi: 10.1002/anie.202109349
H.X. Xu, S.K. Yao, Y.C. Chen, et al., Inorg. Chem. 60 (2021) 18567–18574. doi: 10.1021/acs.inorgchem.1c01779
S. Lee, C.Y. Chung, P. Liu, et al., J. Am. Chem. Soc. 142 (2020) 14993–15003. doi: 10.1021/jacs.0c05727
M.T. Morgan, D. Bourassa, S. Harankhedkar, et al., Proc. Natl. Acad. Sci. U. S. A. 116 (2019) 12167–12172. doi: 10.1073/pnas.1900172116
T. Xiao, C.M. Ackerman, E.C. Carroll, et al., Chem. Biol. 14 (2018) 655–663. doi: 10.1038/s41589-018-0062-z
C. Shen, J.L. Kolanowski, C.M.N. Tran, et al., Metallomics 8 (2016) 915–919. doi: 10.1039/C6MT00083E
J. Liu, J. Karpus, S.V. Wegner, P.R. Chen, C. He, J. Am. Chem. Soc. 135 (2013) 3144–3149. doi: 10.1021/ja3106779
T. Hirayama, G.C. Van de Bittner, L.W. Gray, S. Lutsenko, C.J. Chang, Proc. Natl. Acad. Sci. U. S. A. 109 (2012) 2228–2233. doi: 10.1073/pnas.1113729109
S.C. Dodani, D.W. Domaille, C.I. Nam, et al., Proc. Natl. Acad. Sci. U. S. A. 108 (2011) 5980–5985. doi: 10.1073/pnas.1009932108
C.Y. Chung, J.M. Posimo, S. Lee, et al., Proc. Natl. Acad. Sci. U. S. A. 116 (2019) 18285–18294. doi: 10.1073/pnas.1904610116
C.P. Huang, M. Fofana, J. Chan, C.J. Chang, S.B. Howell, Metallomics 6 (2014) 654. doi: 10.1039/c3mt00331k
C. Li, G. Chen, Y. Zhang, F. Wu, Q. Wang, J. Am. Chem. Soc. 142 (2020) 14789–14804. doi: 10.1021/jacs.0c07022
L.V. Wang, S. Hu, Science 335 (2012) 1458–1462. doi: 10.1126/science.1216210
K. Haedicke, L. Agemy, M. Omar, et al., Nat. Biomed. Eng. 4 (2020) 286–297. doi: 10.1038/s41551-020-0527-8
S. Na, J.J. Russin, L. Lin, et al., Nat. Biomed. Eng. 6 (2022) 584–592.
X. Zhang, Y. Wu, L. Chen, J. Song, H. Yang, Chem. Biomed. Imaging 1 (2023) 99–109. doi: 10.1021/cbmi.3c00009
Y. Liu, L. Teng, B. Yin, et al., Chem. Rev. 122 (2022) 6850–6918. doi: 10.1021/acs.chemrev.1c00875
K. Song, H. Gao, X. Wang, Z. Liu, ChemPhotoChem 9 (2025) e202400335. doi: 10.1002/cptc.202400335
S. Wang, Z. Sheng, Z. Yang, et al., Angew. Chem. Int. Ed. 58 (2019) 12415–12419. doi: 10.1002/anie.201904047
H. Li, P. Zhang, L.P. Smaga, R.A. Hoffman, J. Chan, J. Am. Chem. Soc. 137 (2015) 15628–15631. doi: 10.1021/jacs.5b10504
L. Zeng, G. Ma, H. Xu, et al., Small 15 (2019) e1803866. doi: 10.1002/smll.201803866
M.Y. Lucero, Y.Q. Tang, C.J. Zhang, et al., Proc. Nat. Acad. Sci. U. S. A. 118 (2021) e2106943118. doi: 10.1073/pnas.2106943118
Z. Jiang, C. Zhang, X. Wang, et al., Angew. Chem. Int. Ed. 63 (2024) e202318340. doi: 10.1002/anie.202318340
Q. Sun, H. Liu, Y. Yang, et al., Chem. Biomed. Imaging 3 (2025) 260–266. doi: 10.1021/cbmi.4c00115
S.P. Zhang, H. Chen, L.P. Wang, et al., Angew. Chem. Int. Ed. 61 (2022) e202107076. doi: 10.1002/anie.202107076
C. Zhang, Z. Qiu, L. Zhang, et al., Anal. Chem. 94 (2022) 6251–6260. doi: 10.1021/acs.analchem.2c00041
S.Y. Ong, C.Y. Zhang, X. Dong, S.Q. Yao, Angew. Chem. Int. Ed. 60 (2021) 17797–17809. doi: 10.1002/anie.202101964
S. Yao, Z. Wu, Y. Zhang, et al., CCS Chemistry 7 (2025) 596–609. doi: 10.31635/ccschem.024.202404092
Y. Zhang, S. Lei, Y. Pan, et al., Chin. Chem. Lett. 37 (2026) 110977. doi: 10.1016/j.cclet.2025.110977
S. Yao, Y. Chen, W. Ding, et al., Chem. Sci. 14 (2023) 1234–1243. doi: 10.1039/d2sc05982g
L. Zeng, E.W. Miller, A. Pralle, E.Y. Isacoff, C.J. Chang, J. Am. Chem. Soc. 128 (2006) 10–11. doi: 10.1021/ja055064u
J.W. Chang, D.K. Nomura, B.F. Cravatt, Chem. Biol. 18 (2011) 476–484. doi: 10.1016/j.chembiol.2011.02.008
D.A. Bachovchin, T. Ji, W. Li, et al., Proc. Nat. Acad. Sci. U. S. A. 107 (2010) 20941–20946. doi: 10.1073/pnas.1011663107
J.W. Chang, M. Bhuiyan, H.M. Tsai, et al., Angew. Chem. Int. Ed. 59 (2020) 15161–15165. doi: 10.1002/anie.202004762
J.W. Chang, R.E. Moellering, B.F. Cravatt, Angew. Chem. Int. Ed. 51 (2011) 966–970.

Figure 2 (a) The absorbance titration spectra of HCyCu1 (10 µmol/L) in MOPS buffer. (b) The fluorescence titration spectra of HCyCu1 (10 µmol/L) in MOPS buffer. (c) The fluorescence intensity of HCyCu1 (10 µmol/L) determined in the presence of Cu(Ⅰ) and other analytes. Data are mean ± SEM (n = 3). (d) SDS-PAGE analysis of NCEH1 with HCyCu1–2 were performed with using 10% acrylamide running gel. Fluorescence images of the gels were obtained on a Bio-Rad Chemidoc MP at DyLight 680 channel. The gels were stained with Coomassie brilliant blue (CBB) solution.

Figure 3 Confocal fluorescence imaging of HCyCu1 in HepG2 cells. Scale bar: 20 µm. (a) Cells incubated with HCyCu1 (10 µmol/L, 30 min) followed by imaging. (b) Cells pretreated with ATTM (500 µmol/L, 30 min), then incubated with HCyCu1 (10 µmol/L, 30 min) followed by imaging. (c) Cells pretreated with CuCl2 (200 µmol/L, 30 min) and then incubated with HCyCu1 (10 µmol/L, 30 min) followed by imaging. (d) Cells pretreated with CuCl2 (200 µmol/L, 30 min), then treated with ATTM (500 µmol/L, 30 min), followed by incubation with HCyCu1 (10 µmol/L, 30 min) and imaging. (e) Average fluorescence intensity from Figs. 3a–d. Data are expressed as mean ± SEM (n = 3).

Figure 4 (a) Fluorescence images of 4T1 tumor-bearing mice with HCyCu1, HCyCu2 by i.v. injection. (b) Average fluorescence intensity of the tumor region from (a). Data are presented as mean ± SEM (n = 3).

Figure 5 (a) Ratiometric 3D PA imaging (PA670/730) of the 4T1 tumor-bearing mice by injection of HCyCu1. Scale bar: 3 mm. (b) Average PA670/730 ratio from (a). (c) Ratiometric 3D PA imaging (PA670/730) of 4T1 tumor mice with different tumor volumes by injection of HCyCu1. Scale bar: 5 mm. (d) Average PA670/730 ratio from (c).

 扫一扫看文章

扫一扫关注我们
 DownLoad:

 下载:
下载:

 下载:
下载: