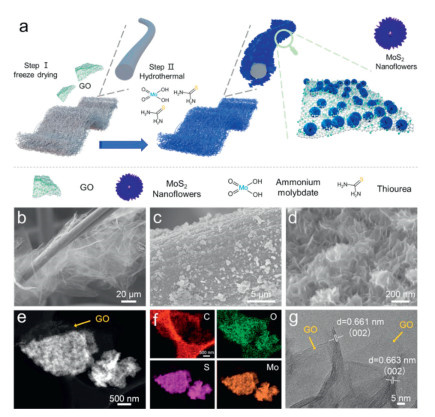
Figure 1.
(a) Scheme diagram for the VS-MoS2@GO/GF synthetic process. (b) SEM image of GO/GF. (c) SEM and (d) magnified images of VS-MoS2@GO/GF. (e) HAADF-STEM, (f) EDX, (g) HRTEM images of VS-MoS2@GO.

Sulfur vacancy-rich MoS2 anchored oxidized graphene as advanced catalysts for polysulfide-iodine redox flow battery
Guolong Lu , Jingwen Zhang , Zhiwei Wang , Zhigui Wang , Yanhong Feng , Cejun Hu , Longchao Zhuo , Xijun Liu


Renewable energy technology has undergone rapid development, thereby accelerating the progress of large-scale energy storage technology. This, in turn, has given rise to a need for a more flexible and cost-effective energy storage solution [1–3]. Aqueous redox flow batteries (RFBs) have garnered attention for their high scalability, design flexibility, capability to decouple power and energy, and enhanced safety [4–6]. The redox couple S2−/Sx2− and I−/I3− could be designed as SIRFBs because of their low cost, excellent security, and high solubility [7]. However, the efficiency of SIRFBs is hindered by predominant charge transfer reactions within the polysulfides and the severe shuttle effect, resulting in elevated electrode polarization resistance and poor kinetic reversibility [8]. Consequently, it is necessary to design efficient electrode materials tailored for practical deployment in SIRFBs to enhance cost-effectiveness and power density and to stabilize energy efficiency (EE).
Recently, metal sulfides [9–15] have emerged as promising candidates due to their unique structural features and exceptional catalytic activity toward the S2−/Sx2− and I−/I3−. Despite their proven advantages in boosting catalytic performance, their application in the SIRFBs remains limited. Two-dimensional transition metal dichalcogenides have garnered significant interest due to their excellent electrocatalytic properties and simple preparation methods [16,17]. Specifically, molybdenum disulfide (MoS2) has garnered considerable attention due to its adjustable lateral size, exposure of active edge sites, and augmented specific surface area [18–20]. The edge structure of MoS2 exhibits high catalytic activity, while the larger substrate area exhibits limited activity. In order to enhance the catalytic activity, it is necessary to activate the inert substrate, thereby acquiring additional active sites [21,22]. Graphene oxide (GO) possesses a considerable specific surface area and a high density of polar functional groups, garnering significant attention [23,24]. The incorporation of GO into MoS2 has been shown to result in the creation of additional catalytic sites. This phenomenon is believed to be facilitated by van der Waals forces and a synergistic effect [25]. This approach aims to address the limitations of conventional SIRFBs, including limited kinetics, low conductivity, and suboptimal performance, presenting a valuable opportunity to contribute novel insights to the research field. Despite the notable advancements in this method for enhancing catalytic performance, its application in SIRFBs remains undocumented at this point.
In this work, a novel approach was employed to design a combination of GO with rich sulfur vacancies MoS2 catalytic attached graphite felt electrodes (VS-MoS2@GO/GF) in the SIRFB system. The in-situ growth VS-MoS2@GO/GF exhibits a multitude of active sites, with the unsaturated edge Mo atom forming a bridge with the hydroxyl group on the surface of graphene oxide (C-O-Mo), thereby ensuring a smooth electronic pathway between the catalyst and the substrate. The experiments and theoretical calculations demonstrated that the formation of the C-O-Mo bond can expedite the electron transport rate. The combination of VS has been shown to effectively enhance the catalytic activity, accelerating the redox reaction kinetics and thus improving the EE. The SIRFB employing VS-MoS2@GO/GF achieved a remarkable EEs of 95.4%, 90.2%, and 75.6% at 10, 20, and 50 mA/cm2 with a 50% state of charge (SOC), respectively. Furthermore, the device exhibits an exceptional power density of 93.2 mW/cm2, ultralow overpotential of 100 mV, and a remarkably extended cycle life of approximately 500 cycles during continuous operation at 10 mA/cm2 with a 10% SOC.
The VS-MoS2@GO/GF hybrids were synthesized by a one-step solvothermal in-situ growth method. Prior to the initiation of the hydrothermal reaction, the GF underwent an acid activation process, which served to augment the number of active sites. In addition, the GO was loaded onto the GF through the process of freeze-drying and the utilization of H2O2 etching to stimulate S-vacancies (VS) in the MoS2. Subsequently, all raw materials were introduced into a Teflon tank containing the pretreated GF. Annealing, a process that occurs after the conclusion of the hydrothermal reaction with deionized (DI) water, serves to activate the material’s structural integrity. The synthesis process for VS-MoS2@GO/GF is illustrated in Fig. 1a, and further detailed information can be found in the method section.
Scanning electron microscopy (SEM) images of GO/GF, VS-MoS2@GO/GF, and GF are depicted in Figs. 1b and c and Fig. S1 (Supporting information), respectively. These images reveal the GO as spun yarn adhere in the GF (Fig. 1b) and the VS-MoS2@GO/GF uniform distribution on the GF surface (Fig. 1c). VS-MoS2@GO/GF has been observed to form a flaky nanoflower structure, coating vertically aligned nanosheets (Fig. 1d). Further morphological analyses of VS-MoS2@GO using high-angle annular dark-field scanning transmission electron microscopy (HAADF-STEM) and energy-dispersive X-ray spectroscopy (EDX) mapping are presented in Figs. 1e and f. These images demonstrate a uniformly dispersed sheet material with C, O, S, and Mo elements, which is consistent with the morphology of VS-MoS2@GO. The transmission electron microscopy (TEM) image of VS-MoS2@GO is displayed in Fig. S2 (Supporting information), revealing folium and slice aggregate morphology, which resembles nebulous cloud flowers with a lateral size ranging from approximately 500–1000 nm.
Furthermore, high-resolution transmission electron microscopy (HRTEM) analysis of VS-MoS2@GO (Fig. 1g) revealed a layered lattice structure adhered to the GO. The presence of clear lattice fringes was measured, and the lattice spacing was found to be 0.661 nm and 0.663 nm, which is higher than that of MoS2 (0.616 nm). This corresponds to the d values of the (002) plane (PDF #37-1492). The increase in the lattice of VS-MoS2@GO is attributed to the interaction between VS-MoS2 and GO, a hypothesis that will be validated through XRD and Raman analysis.
X-ray powder diffraction (XRD) measurements, Raman characterizations, and Fourier transform infrared spectroscopy (FTIR) were simultaneously conducted on MoS2, VS-MoS2, and VS-MoS2@GO, and the results are shown in Figs. 2a-c. As illustrated in Fig. 2a, the XRD peaks of the three materials exhibit similar characteristic diffraction peaks at 14.4°, 33.5°, and 60.1°, which are consistent with the peaks of pristine MoS2 (PDF #37-1492). This observation indicates that the XRD peaks of the three materials are analogous to the peaks of pristine MoS2, suggesting that the materials are consistent in their crystal structure and diffraction patterns. The crystal structure of MoS2 remains unchanged by the etching of H2O2 and the introduction of GO. As illustrated in Fig. 2a, the (002) planes of the characteristic peak (14.4°) in VS-MoS2@GO appear to be shifted to the left, indicating that the interlayer spacing of S-Mo-S has increased, while that of VS-MoS2 remains relatively unchanged [21,26]. This observation aligns with the results reported in the HRTEM study (Fig. 1g), suggesting a consistent pattern in the underlying mechanisms.
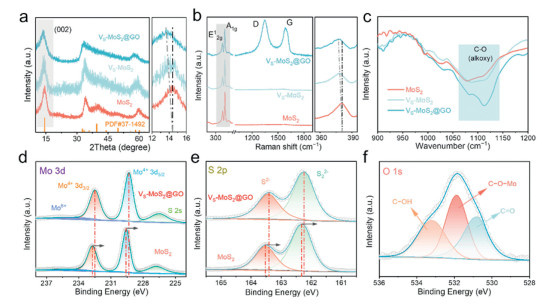
As illustrated in Fig. 2b (left graph), the Raman spectra of the samples reveal the characteristic peaks E2g1 (379 cm−1) and A1g (407 cm−1) in MoS2, VS-MoS2, and VS-MoS2@GO, corresponding to the vibration modes in-plane and out-of-plane of MoS2 [27]. However, only the VS-MoS2@GO sample exhibits these two obvious peaks at 1351 and 1591 cm−1, which is consistent with the characteristics of disordered carbon (D peak) and graphitic carbon (G peak) of GO. This observation indicates that VS-MoS2@GO was successfully constructed. As illustrated in Fig. 2b, the enlarged figure reveals the characteristic peaks E2g1 of VS-MoS2 and VS-MoS2@GO, which exhibit a left shift and broadening. This observation indicates that the Mo-S phonon pattern on the base plane has undergone a softening process. This softening can be attributed to a gradual decrease in Mo-S chemical bonds and an increase in VS bonds within the plane [28,29]. In addition, the FTIR (Fig. 2c) demonstrates that the absorption peak (1050–1150 cm−1) of C-O in VS-MoS2@GO is evidently greater than that of VS-MoS2 and MoS2. This further suggests that a C-O-Mo bond is formed in the VS-MoS2 combined with GO [21].
The X-ray photoelectron spectroscopy (XPS) images pertaining to MoS2, VS-MoS2, and VS-MoS2@GO are presented in Figs. 2d-f and Fig. S3 (Supporting information). The purpose of this presentation is to further investigate the chemical compositions and bonding states of the MoS2, VS-MoS2, and VS-MoS2@GO material. XPS provides direct evidence to explore the effect of VS and GO condition. As illustrated in Fig. S3, a comparison is made between the XPS spectra of high-resolution Mo 3d and S 2p XPS spectra of MoS2 and VS-MoS2. As illustrated in Fig. S3a, the spectrum exhibits two distinctive (red and blue) characteristic peaks at 229.9 and 232.8 eV, corresponding to Mo4+ 3d5/2 and Mo4+ 3d3/2, respectively [30]. Concurrently, two predominant (purple and green) peaks at 236.3 and 227.2 eV corresponding to Mo6+ and S 2s are observed [21,31]. Furthermore, the peaks of 163.5 and 162.2 eV could be assigned to S2− and S22− (Fig. S3b). A comparative analysis of the VS-MoS2 spectrum reveals a pronounced left shift in the main peaks of Mo 3d and S 2p. This shift can be attributed to the loss of electron cloud density around Mo and S, as well as a decrease in binding energy. The former is associated with the presence of an unsaturated Mo atom in MoS2, while the latter is a consequence of the presence of a rich hydroxyl group bond on GO (C-O-Mo). As demonstrated in Fig. S4 (Supporting information), the EDX mapping of VS-MoS2@GO is consistent with the signals of Mo, S, C, and O. The atomic ratio of Mo and Co species in VS-MoS2@GO is documented in Table S1 (Supporting information). As illustrated in Figs. 2d and e, the high-resolution Mo 3d and S 2p XPS spectra of MoS2 and VS-MoS2@GO, respectively, demonstrate a shift in the convolution peak of VS-MoS2@GO toward lower binding energy (right shift). This shift can be attributed to the increased electron cloud density resulting from the VS in VS-MoS2, which exceeds the C-O-Mo bond shift. The superposition of these two effects, in addition to the shift of the peaks toward lower binding energy, is a key factor in understanding the observed phenomena [28]. Concurrently, the O 1s high-resolution spectrum (Fig. 2f) of the VS-MoS2@GO sample was deconvolved into three peaks (530.8, 531.9, and 533.2 eV), corresponding to the C=O, C-O-Mo, and C-OH bonds, respectively. This result indicates a C-O-Mo connection between VS-MoS2 and GO [32], which is consistent with the findings from XRD, Raman, and FTIR analyses. Besides, the sulfur vacancy of VS-MoS2@GO was verified by EPR spectrum (Fig. S5 in Supporting information), the symmetric signal in the range of 2.005 is observed, which is attributed to free electrons associated with S-vacancies. The higher peak intensity compared to bulk MoS2 indicates the abundance of S-vacancies in VS-MoS2@GO [33].
The adsorption behavior of redox species (Sx2− and I3−) onto electrodes plays a vital role in the electrocatalytic process. As depicted in Fig. 3a, the NaI3 aqueous solution in the presence of VS-MoS2@GO/GF and VS-MoS2/GF both exhibits more pronounced decolorization compared with solutions with GF and GO/GF, ultimately becoming a nearly colorless solution. However, in the ultraviolet-visible (UV-vis) absorption spectrum of the NaI3 solution after adsorption with VS-MoS2@GO/GF revealed a further marked reduction in the typical absorption peaks associated with I3− ions compared to VS-MoS2/GF. These stark differences underscore the remarkable adsorption efficacy of VS-MoS2@GO/GF toward iodide species. The adsorption capacity of the materials for polysulfides was also explored (Fig. 3b), displaying a sequence analogous to their absorptivity toward iodide solutions. The adsorbing effect of VS-MoS2@GO/GF was clearly greater than that of VS-MoS2/GF for the intuitive adsorption phenomena.
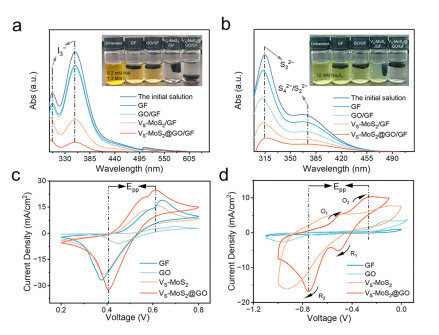
The impact of VS-MoS2@GO on the electrocatalytic activity of S2−/Sx2− and I−/I3− redox reactions was investigated and compared using GF, GO, VS-MoS2, and VS-MoS2@GO electrodes by cyclic voltammetry (CV). As shown in Fig. 3c, each curve manifests a pair of peaks that correspond to the redox reactions of I−/I3− couples when GF, GO, VS-MoS2, and VS-MoS2@GO electrodes are employed. The essential parameters for assessing the electrocatalytic properties of electrodes include peak-to-peak separation (Epp) and peak current density [34], as outlined in Table S2 (Supporting information). It is noteworthy that VS-MoS2@GO demonstrates the most minimal Epp (0.20 V) and the maximum peak current density, in contrast to VS-MoS2 (0.24), GO (0.25), and GF (0.27). This observation signifies that the GO bond with VS is notably effective in facilitating the redox reaction of I−/I3−. Furthermore, the JOx/|JRed| ratio of 0.761 for VS-MoS2@GO is higher than that of VS-MoS2 (0.678), GO (0.680), and GF (0.705), indicating higher reversible transformation and ingenious reactivity during the I−/I3− redox reaction, favoring the reduction of the I2 deposition. As illustrated in Fig. 3d, the VS-MoS2@GO electrode remarkably enhances the electrochemical reaction activity of the S2−/Sx2− couple, resulting in multiple polysulfide redox peaks. In contrast, other electrodes manifest unintegrated and broad asymmetric peaks, such as two oxidation peaks and one reduction peak in the VS-MoS2, one oxidation peak and one reduction peak in the GO, while the oxidation peaks and reduction peaks exhibit weakness and almost no response in GF. The analysis of multiple electron transfers within the voltage range of −1.0 V ~ 0.1 V versus Ag/AgCl reveals the presence of two oxidation peaks and two reduction peaks, suggesting the occurrence of more intricate electrochemical reactions involving various polysulfide species (e.g., Sx2−, where x ranges from 2 to 8). This behavior is consistent with observations in both aqueous and nonaqueous electrolytes [35,36]. The Epp (Table S3 in Supporting information) of VS-MoS2@GO is 0.48, as seen in the S2−/Sx2− reaction solution, which is smaller than that of VS-MoS2 (0.82), GO (0.84), and GF (0.91). Furthermore, the value of VS-MoS2@GO (0.604) indicates its superior reversibility to the S2−/Sx2− redox reaction in comparison to that of VS-MoS2 (0.474). The value of the JOx/|JRed| ratio for the GO and GF is not a reference value because the peak and redox reaction are excessively small. Therefore, the results demonstrate that the VS-MoS2@GO sample exhibits superior catalytic activity and reaction kinetics for S2−/Sx2− and I−/I3−. In addition, the linear sweep voltammetry (LSV) and Tafal slopes were shown in Fig. S6 (Supporting information), the VS-MoS2@GO exhibits the best reaction activity and smallest Tafel slope (130.4 and 60.1 mV/dec) than those of GF (284.7 and 154.7 mV/dec), GO (207.6 and 133.3 mV/dec), and Vs-MoS2 (258.1 and 83.9 mV/dec) in S2−/Sx2− and I−/I3− reaction system, showing the better reaction kinetics of the VS-MoS2@GO, according with the result of EIS.
Furthermore, the linear relationship between peak currents and the square root of the scan rate (ν1/2, Figs. S7 and S8 in Supporting information) manifests the S2−/Sx2− redox reaction of a diffusion-controlled process. The diffusion coefficient (D) of S2−, as determined by the Berzins–Delahay equation, exhibits a sequence of values that corresponds to the order GF < GO < VS-MoS2 < VS-MoS2@GO. This observation aligns with the sequence of electrode catalytic capacity. The VS-MoS2@GO sample also have been implemented the CV activity test in the I−/I3− redox reaction, which show that high-activity at the vary current density (Fig. S9 in Supporting information). Furthermore, the stability of VS-MoS2@GO, VS-MoS2 and MoS2@GO for the S2−/Sx2− and I−/I3− redox reactions is evident at 50 mV/s and 100 cycles (Fig. S10 in Supporting information). The VS-MoS2@GO shows remarkable stability and redox ability than that of VS-MoS2 and MoS2@GO, which further prove that synergistic effect of VS and C-O-Mo bond.
The enhancement in catalytic performance is attributed to the formation of a GO bond with VS, resulting in the formation of a C-O-Mo bond. The total density of states (DOS) of GO, VS-MoS2, and VS-MoS2@GO was calculated (Fig. 4a). It is evident that the combination of VS and GO induces spin polarization states, resulting in VS-MoS2@GO exhibiting the highest conductivity and affinity compared with VS-MoS2 and GO [29,37–39]. This phenomenon can augment the interfacial catalytic activity of VS-MoS2 for S2−/Sx2− and I−/I3− because of its accelerated charge transfer speed. Further, VS-MoS2@GO has lower adsorption energy toward I−, I2, I3−, S2−, S22−, S42−, S62−, and S82− intermediates as compared to those of VS-MoS2 and GO (Fig. S11 and Table S4 in Supporting information), demonstrating that VS-MoS2@GO present a higher affinity to those reaction intermediates. In addition, Fig. 4b presents the optimized geometry and differential charge density of VS-MoS2@GO. The yellow region and green region are indicative of the electron-rich region and electron-dispersion region, respectively. The electron cloud of VS-MoS2@GO undergoes a transformation, indicating that the C-O-Mo form facilitates electron transfer from VS-MoS2 to GO, thereby enhancing the electrical conductivity of VS-MoS2@GO. Furthermore, the generation of C-O-Mo, in conjunction with the presence of VS, gives rise to electron rearrangement on the base plane of MoS2. This electron-deficient state is more conducive to the adsorption of S2−/Sx2− and I−/I3− on VS-MoS2@GO. The calculated results are consistent with the previously obtained XPS results.
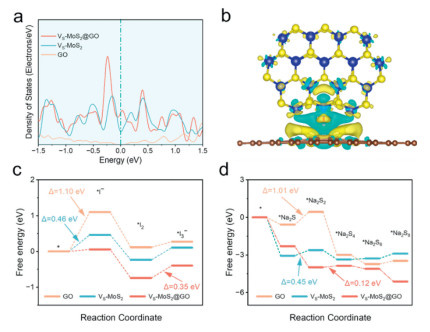
In addition, density functional theory (DFT) calculations were conducted to elucidate the exceptional polysulfide/iodide species transformation activity exhibited by the VS-MoS2@GO. The binding free energies (ΔG) for the active species, namely *I−, *I2, and *I3−, at the designated catalytic site were calculated (Fig. 4c). The ΔG values for *I−, *I2, and *I3− on GO were evident higher than those on VS-MoS2 and VS-MoS2@GO, implying the transformation of GO resistance is higher than that of other materials. Furthermore, the ΔG for *I− was found to be lower on VS-MoS2@GO than on VS-MoS2 and GO, suggesting the high catalytic activity of VS-MoS2@GO, thereby facilitating the more facile adsorption and transformation of * to *I−. This outcome suggests that the transformation performance has been enhanced and made more accessible. It is noteworthy that VS-MoS2@GO requires relatively low transformation energy, and the transformation of *I2 to *I3− was identified as the rate-determining step. With VS-MoS2@GO (0.35 eV), a lower reaction energy barrier was exhibited than with GO (1.10 eV) and VS-MoS2 (0.46 eV), whose rate-determining step was identified as * to *I−. A similar trend was observed for the standard Gibbs free energy (ΔG) values associated with *, *Na2S, *Na2S2, *Na2S4, *Na2S6, and *Na2S8 on GO, VS-MoS2, and VS-MoS2@GO (Fig. 4d). All sulfide species underwent spontaneous transformation, with VS-MoS2@GO facilitating a more accessible transformation process. Specifically, the transformation of polysulfide species, namely the conversion of *S2− to *S22− (on GO and VS-MoS2) and *S22− to *S42− (on VS-MoS2@GO), was promoted by VS-MoS2@GO with a lower Gibbs free energy (ΔG) of 0.12 eV compared with GO (1.01 eV) and VS-MoS2 (0.45 eV). As illustrated in Fig. S12 (Supporting information), a comprehensive array of molecular reaction simulations has been delineated. Consequently, the total density of states and the binding free energies of VS-MoS2@GO are greater than those of GO and VS-MoS2, suggesting that S2−/Sx2− and I−/I3− interact more readily with VS-MoS2@GO, leading to enhanced conversion efficiency and reaction kinetics. This finding is in alignment with the prior visual outcomes observed in UV-vis and CV experiments. It has been demonstrated that the presence of the better ensures that the collision between the active substance and the electrode is more probable, thereby facilitating the gain and loss of electrons in the active substance and reducing the polarization of the SIRFB. A comprehensive review of the extant literature reveals a consistent pattern in the findings of experimental studies employing DFT simulations. These studies consistently demonstrate that the C-O-Mo bond coupling of VS effectively facilitates the activity of I−/I3− and S2−/Sx2− redox, thereby favoring the SIRFB performance.
Fig. 5a presents a schematic simulation representation of the proposed SIRFB construction. The assembly of SIRFBs was conducted by employing GF, GO/GF, VS-MoS2/GF, and VS-MoS2@GO/GF as anodic and cathodic electrodes (Fig. S13 in Supporting information). The anolyte utilized was 2.0 mol/L Na2S2, while the catholyte comprised 2.0 mol/L NaI and 0.5 mol/L I2. A two-layer separator, consisting of G115 and K117, has been used to enhance the transportation of Na+ cations and to restrict the cross-over of active species [40]. Fig. S14 (Supporting information) predominantly illustrates the initial deep charge and discharge curves of SIRFB based on the GF, GO/GF, VS-MoS2/GF, and VS-MoS2@GO/GF electrodes at 15 mA/cm2 with deep charge and discharge (100% SOC). It is noteworthy that the VS-MoS2@GO/GF electrode exhibited the highest capacity at 111.6 mAh, surpassing the capacities of VS-MoS2/GF (85.1 mAh), GO/GF (82.8 mAh), and GF (70.2 mAh). Moreover, the polarization voltage difference for VS-MoS2@GO/GF is also evidently smaller than that observed for VS-MoS2/GF, GO/GF, and GF. Additionally, Fig. 5b illustrates a current density of 20 mA/cm2 with 50% SOC, providing further insight into the remarkably small polarization voltage difference exhibited by VS-MoS2@GO/GF. It is evident that the initial charge and discharge polarization voltage difference of VS-MoS2@GO/GF (100 mV) is considerably lower than that of VS-MoS2/GF (212 mV), GO/GF (571 mV), and GF (620 mV). The low overpotential is indicative of the effective restraint of the side reaction, thereby reducing the generation of O2/H2. Concurrently, the reaction kinetics undergo a substantial acceleration [41]. Furthermore, the relationship curves of discharge polarization and power density for SIRFB are demonstrated in Fig. 5c, which indicates that the VS-MoS2@GO/GF electrode attains the maximum power density of 93.2 mW/cm2, thereby surpassing GF (76.4 mW/cm2), GO/GF (78.6 mW/cm2), and VS-MoS2/GF (83.1 mW/cm2).
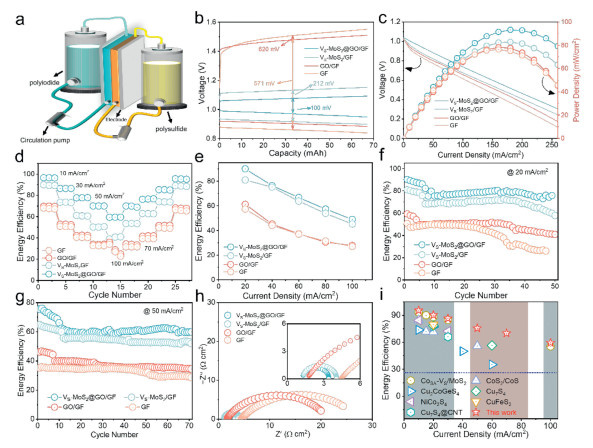
The EEs of the SIRFB based on VS-MoS2@GO/GF, VS-MoS2/GF, GO/GF, and GF electrode with increasing current densities (10, 30, 50, 70, and 100 mA/cm2) at the 50% SOC are shown in Fig. 5d. Conversely, an increase in the current density has been observed to result in an increase in the overpotentials and a concomitant decrease in the EEs of the SIRFB. The EEs of VS-MoS2@GO/GF show 96.5%, 86.4%, 77.8%, 69.9%, and 59.4%, respectively, which are all visibly higher than those of VS-MoS2/GF, GO/GF, and GF. This phenomenon can be attributed to the enhanced active surface area and reduced mass transport and ohmic resistances of the VS-MoS2@GO/GF in comparison with alternative electrodes [42]. A subsequent examination of the trends in coulombic efficiency (CE), voltage efficiency (VE), and EE across successive various current densities (20, 40, 60, 80, and 100 mA/cm2) for SIRFB is depicted in Fig. 5e and Figs. S15-S17 (Supporting information). The VE, representing the derivative of the CE and EE values (VE = EE/CE), consistently exhibits higher values than other at all current densities, thereby conforming to the variation trend of CE and EE (Figs. S15 and S16). The CE consistently maintains approximately 100% at employed current densities (Fig. S16). Concurrently, EE of VS-MoS2@GO/GF exhibits a decline, ranging from 90.1% at 20 mA/cm2 to 49.0% at 100 mA/cm2. This phenomenon is attributed to the augmented cell overpotential at elevated current densities (Fig. S17). As illustrated in Fig. 5f, the galvanostatic cycling performance of the SIRFB is demonstrated when operated at 20 mA/cm2 with 50% SOC. The electrode composed of VS-MoS2@GO/GF exhibits the highest EE relative to other electrodes at the same charge/discharge current density, which is attributed to reduced charge/discharge overpotentials. Specifically, the SIRFB using VS-MoS2@GO/GF attains an initial EE of 90.2% at 20 mA/cm2, accompanied by 84.0% capacity retention after 50 cycles. In addition, the VE and CE of the SIRFB, employing VS-MoS2@GO/GF electrodes with 50% SOC at 20 mA/cm2, are replenished in Fig. S18 (Supporting information). The VS-MoS2@GO/GF electrode exhibited an initial VE of 90.2%, along with an exceptional CE of 100% in the first cycle. Notably, even after 50 cycles, VE and CE remained relatively high at 79.4% and 92.7%, respectively. The initial EE performance of VS-MoS2@GO/GF electrode exhibited superiority over that observed with bare GF and GO/GF electrodes, which yielded a lower EE of 50.7% and 59.3%, respectively. In contrast, the SIRFB employing VS-MoS2/GF as the electrode material exhibits an EE of 80.9% at 20 mA/cm2, accompanied with a capacity retention of 57.8% after 50 cycles. This result further assesses the superior performance resulting from the synergistic effect of GO and abundant VS. In addition, the durability of VS-MoS2@GO/GF was evaluated after the galvanostatic cycling test, the I-side electrodes were examined (Fig. S19 in Supporting information), and the results reveal that yellow substance is clearly observed on GF. By contrast, there is no I2 residue exist on the surface of VS-MoS2@GO/GF, corroborating that VS-MoS2@GO/GF exhibits better activity towards I−/I3− transformation and thus inhibits the I2 production. As illustrated in Fig. S20 (Supporting information), the charge/discharge voltage profiles of the SIRFB, and the VS-MoS2@GO/GF electrode demonstrate a conspicuously diminished charge/discharge overpotential in comparison to that of alternative electrodes. Furthermore, the charge and discharge polarization curves further reveal that the open-circuit voltage condition of the VS-MoS2@GO/GF cell, which is consistent with the theoretical value of 1.02 V (Fig. S21 in Supporting information) [9,43].
Fig. 5g depicts the performance of SIRFB with regard to galvanostatic cycling EE of GF, GO/GF, VS-MoS2/GF, and VS-MoS2@GO/GF electrodes with 50% SOC at 50 mA/cm2, and Fig. S22 (Supporting information) provides VE and CE regarding the VS-MoS2@GO/GF electrode. As the current density increases, the VS-MoS2@GO/GF electrodes exhibit a notable initial EE of 75.6%, with an EE of 60.0% after 70 cycles. Furthermore, the EE retention was found to be 75.8%, while the CE decreased from 100% to 96.7% over the course of 50 charge/discharge cycles. The collective presentation of results underscores the notable power densities and superior long-term cycling stability of the VS-MoS2@GO/GF electrode.
An investigation was conducted to ascertain the charge transfer resistance (Rct), solution resistance (Rs), and electrode activity. This investigation utilized the technique of electrochemical impedance spectroscopy (EIS). The EIS plots for SIRFBs with different electrodes (Fig. 5h) with those simulated curves are shown in Fig. S23 (Supporting information), and the more detailed results are recorded in Table S5. The Nyquist plot revealed a semicircle corresponding to Rct at the electrolyte–electrode interface. Specifically, the Rs values were determined to be 4.42, 1.61, 1.42, and 1.29 Ω/cm2 for the GF, GO/GF, VS-MoS2/GF, and VS-MoS2@GO/GF electrodes, respectively. In accordance with these observations, the Rct values were determined to be 22.97, 19.77, 2.70, and 2.11 Ω/cm2 for the GF, GO/GF, VS-MoS2/GF, and VS-MoS2@GO/GF electrodes, respectively. These results underscore the ability of VS-MoS2@GO/GF to facilitate charge transfer and enhance diffusion dynamics, which is consistent with the findings of the CV experiments. Besides, the SIRFB catholyte, which employs GF, GO/GF, VS-MoS2/GF, and VS-MoS2@GO/GF electrodes, underwent extensive testing with multiple electrolyte refreshments to assess the long-term cycling stability of the electrodes (Fig. S24 in Supporting information). It is noteworthy that the VS-MoS2@GO/GF electrode demonstrated the highest initial EE of 95.4% when operated at 10 mA/cm2. Furthermore, the EE demonstrated a capacity to regain a high value approaching the initial EE after refreshing the electrolyte in the 180th (94.7%) and 350th (94.1%) cycles, thereby substantiating the practical application value of the VS-MoS2@GO/GF electrode. Furthermore, EE was found to be stable at 62.1% after 500 cycles of continuous operation at 10% SOC. In contrast, the VS-MoS2/GF electrodes exhibited substantial degradation prior to attaining 180 cycles, while the GO/GF and GF electrodes demonstrated faster deterioration before reaching 100 cycles. Besides, the overall performance of GF, GO/GF, VS-MoS2/GF, and VS-MoS2@GO/GF electrodes are summarized in Table S6 (Supporting information). These findings demonstrate and underscore the robust stability and superior performance of the VS-MoS2@GO/GF electrode. The decline in the performance of the VS-MoS2@GO/GF electrode was attributed to the adsorption of S2−/Sx2− and I−/I3− on the electrode surface, thereby hindering exposure of catalytically active sites.
In a comprehensive evaluation, the initial EE performance of VS-MoS2@GO/GF in different current densities (Fig. 5i), was compared with that of other recent sulfide electrode materials used in SIRFBs [9–11,13–15,43–46]. Besides, the integrated comparative analysis including maximum power density, initial voltage efficiency, and energy efficiency retention, indicating that the performance of VS-MoS2@GO/GF surpasses that of other sulfides, particularly in terms of maximum power density [47,48], where it demonstrates superiority (Fig. S25 and Table S7 in Supporting information). These findings substantiate the advantageous attributes of the electrode material with regard to the overall performance.
In this study, a self-supporting catalyst was successfully fabricated by combining GO into MoS2 with abundant VS. The catalyst, designated as VS-MoS2@GO/GF, was synthesized via a solvothermal method, resulting in the in-situ growth on a GF substrate. The bifunctional nature of VS-MoS2@GO/GF has been demonstrated to enhance the electrocatalytic activities of the S2−/Sx2− and I−/I3− redox reactions. The GO bond with VS facilitates the formation of abundant sites, thereby improving the adsorption of charged ions and promoting charge transfer. Experiment analysis and DFT calculations corroborate that the bond of C-O-Mo, in conjunction with VS, augments the catalytic activity and adsorption capacity. The introduction of GO and VS leads to a substantial reconstruction of the catalyst surface structure, resulting in activated GO and vacancy defects, and the formation of C-O-Mo bonds. This acceleration of the electron transport rate is accompanied by an improvement in catalytic activity, which in turn leads to enhanced rates of S2−/Sx2− and I−/I3− redox reactions. These effects contribute to an augmentation in EE. Consequently, the SIRFB employing VS-MoS2@GO/GF achieved a remarkable EEs of 95.4%, 90.2%, and 75.6% at 10, 20, and 50 mA/cm2 with a 50% SOC, respectively. Furthermore, the power density is measured at 93.2 mW/cm2, ultralow overpotential of 100 mV, and the long cycle life is approximately 500 cycles during continuous operation at 10 mA/cm2 with a 10% SOC. The innovative design involving GO and abundant-vacancy nanoparticle electrocatalysts presents an effective strategy for enhancing the performance and competitiveness of related research.
Guolong Lu: Writing – original draft. Jingwen Zhang: Data curation. Zhiwei Wang: Software. Zhigui Wang: Data curation. Yanhong Feng: Data curation. Cejun Hu: Supervision. Longchao Zhuo: Validation. Xijun Liu: Writing – review & editing, Supervision.
The authors declare that they have no known competing financial interests or personal relationships that could have appeared to influence the work reported in this paper.
This work was financially supported by the Guangxi Natural Science Fund for Distinguished Young Scholars (No. 2024GXNSFFA010008), and the National Natural Science Foundation of China (Nos. 22469002 and 22304028).
Supplementary material associated with this article can be found, in the online version, at doi:
J. Lei, Y. Zhang, Y. Yao, et al., Nat. Energy 8 (2023) 1355-1364. doi: 10.1038/s41560-023-01370-0
Z. Zhou, Y. Qian, X. Chen, et al., Adv. Funct. Mater. 34 (2024) 2404938. doi: 10.1002/adfm.202404938
S. Fu, Y. Li, Y. Wang, China Powder Sci. Technol. 30 (2024) 27-40.
D. Chao, W. Zhou, F. Xie, et al., Sci. Adv. 6 (2020) eaba4098. doi: 10.1126/sciadv.aba4098
G. Lu, Z. Wang, S. Zhang, et al., Nanoscale 15 (2023) 4250-4260. doi: 10.1039/d2nr07291b
X. Quan, W. Siyang, X. Chunming, et al., Chin. Chem. Lett. 34 (2023) 108188. doi: 10.1016/j.cclet.2023.108188
Z. Li, G. Weng, Q. Zou, et al., Nano Energy 30 (2016) 283-292. doi: 10.1016/j.nanoen.2016.09.043
L.F. Castañeda, F.C. Walsh, J.L. Nava, et al., Electrochim. Acta 258 (2017) 1115-1139. doi: 10.1016/j.electacta.2017.11.165
D. Ma, B. Hu, W. Wu, et al., Nat. Commun. 10 (2019) 3367. doi: 10.1038/s41467-019-11176-y
Y. Zhu, K. He, T.T. Tsega, et al., Sustain. Energy Fuels 4 (2020) 2892-2899. doi: 10.1039/c9se01201j
J. Zai, Y. Zhu, K. He, et al., Mater. Chem. Phys. 250 (2020) 123143. doi: 10.1016/j.matchemphys.2020.123143
M. Gao, S. Huang, F. Zhang, et al., Mater. Today Energy 18 (2020) 100540. doi: 10.1016/j.mtener.2020.100540
Y. Qin, X. Li, W. Liu, et al., Mater. Today Energy 21 (2021) 100746. doi: 10.1016/j.mtener.2021.100746
J. Liu, L. Ren, Y. Wang, et al., J. Power Sources 561 (2023) 232607. doi: 10.1016/j.jpowsour.2022.232607
T.T. Tsega, J. Zai, C.W. Lai, et al., Chin. J. Struct. Chem. 43 (2024) 100192.
Y. Cao, ACS Nano 15 (2021) 11014-11039. doi: 10.1021/acsnano.1c01879
Q. Fu, J. Han, X. Wang, et al., Adv. Mater. 33 (2021) 1907818. doi: 10.1002/adma.201907818
J. Kibsgaard, Z. Chen, B.N. Reinecke, et al., Nat. Mater. 11 (2012) 963-969. doi: 10.1038/nmat3439
B. Sun, X. Li, J. Zheng, Mater. Rep. Energy 4 (2024) 100248.
M. Yao, J. Yuan, B. Zhang, et al., Mater. Rep. Energy 4 (2024) 100251.
J. Zhang, G. Xu, Q. Zhang, et al., Adv. Sci. 9 (2022) 2201579. doi: 10.1002/advs.202201579
Z. Zhao, Q. Dai, S. Huang, et al., Chin. Chem. Lett. 35 (2024) 109231. doi: 10.1016/j.cclet.2023.109231
P. Kumari, A. Kumar, Y. Sabri, et al., Mater. Res. Bull. 180 (2024) 113037. doi: 10.1016/j.materresbull.2024.113037
D. Fengjun, Z. Tingyu, Z. Xiaochen, et al., Chin. Chem. Lett. 36 (2025) 109897. doi: 10.1016/j.cclet.2024.109897
B. Chen, T. Wang, S. Zhao, et al., Adv. Mater. 33 (2021) 2007090. doi: 10.1002/adma.202007090
K.J. Huang, L. Wang, J.Z. Zhang, et al., Energy 67 (2014) 234-240. doi: 10.1016/j.energy.2013.12.051
Q. Liu, Q. Fang, W. Chu, et al., Chem. Mater. 29 (2017) 4738-4744. doi: 10.1021/acs.chemmater.7b00446
X. Wang, Y. Zhang, H. Si, et al., J. Am. Chem. Soc. 142 (2020) 4298-4308. doi: 10.1021/jacs.9b12113
S. Najmaei, J. Yuan, J. Zhang, et al., Acc. Chem. Res. 48 (2015) 31-40. doi: 10.1021/ar500291j
T. Wang, M. Li, L. Qi, et al., Adv. Funct. Mater. 33 (2023) 2308470. doi: 10.1002/adfm.202308470
W. Ping, W. Ting, X. Ming, et al., Chin. Chem. Lett. 35 (2024) 108930. doi: 10.1016/j.cclet.2023.108930
N.A. Kumar, M.A. Dar, R. Gul, et al., Mater. Today 18 (2015) 286-298. doi: 10.1016/j.mattod.2015.01.016
Y. Gao, Y. Deng, S. Xia, et al., Small 20 (2024) 2402412. doi: 10.1002/smll.202402412
Q. Zou, Z. Liang, G.Y. Du, et al., J. Am. Chem. Soc. 140 (2018) 10740-10748. doi: 10.1021/jacs.8b04536
Q. Zou, Y.C. Lu, J. Phys. Chem. Lett. 7 (2016) 1518-1525. doi: 10.1021/acs.jpclett.6b00228
M. Yang, X. Ren, L. Hu, et al., Chem. Eng. J. 412 (2021) 128628. doi: 10.1016/j.cej.2021.128628
M. Niu, W. Xin, L. Zhang, et al., Inorg. Chem. Front. 11 (2024) 2272-2280. doi: 10.1039/d4qi00344f
X. Liu, M. Chen, J. Ma, et al., China Powder Sci. Technol. 30 (2024) 35-45.
J. Yang, F. Zhang, J. Chen, China Powder Sci. Technol. 30 (2024) 161-170.
Z. Li, Y.C. Lu, Nat. Energy 6 (2021) 517-528. doi: 10.1038/s41560-021-00804-x
J. Wang, L. Yu, L. Hu, et al., Nat. Commun. 9 (2018) 1795. doi: 10.1038/s41467-018-04213-9
M. Rahimi, A. Molaei Dehkordi, H. Gharibi, et al., Ind. Eng. Chem. Res. 60 (2021) 824-841. doi: 10.1021/acs.iecr.0c05768
Z. Wang, G. Lu, T. Wei, et al., Nat. Commun. 16 (2025) 2885. doi: 10.2147/ijwh.s528071
J. Li, R. Li, J. Liu, et al., Chin. Chem. Lett. 35 (2024) 110355. doi: 10.1016/j.cclet.2024.110355
S. Qiu, Y. Zhao, K. Wang, J. et al., Mater. Rep. Energy 4 (2024) 100293.
X. Zhao, X. Niu, X. Liu, et al., Mater. Rep. Energy 4 (2024) 100271.
L. Yang, X. Huang, H. Shan et al., China Powder Sci. Technol. 30 (2024) 113-121.
K. Duan, Y. Feng, Q. Liu, et al., ChemSusChem 18 (2025) 2500833.

Figure 1 (a) Scheme diagram for the VS-MoS2@GO/GF synthetic process. (b) SEM image of GO/GF. (c) SEM and (d) magnified images of VS-MoS2@GO/GF. (e) HAADF-STEM, (f) EDX, (g) HRTEM images of VS-MoS2@GO.

Figure 2 (a) XRD patterns, (b) Raman spectra, and (c) FTIR spectra of MoS2, VS-MoS2, and VS-MoS2@GO. (d) Mo 3d and (e) S 2p XPS spectra of MoS2 and VS-MoS2@GO. (f) O 1s XPS spectrum of VS-MoS2@GO.

Figure 3 UV-vis spectra of the (a) NaI + I2 and (b) Na2S2 initial solutions as well as the solutions after interaction with GF, GO/GF, VS-MoS2/GF, and VS-MoS2@GO/GF. Inset: visualized adsorption of NaI + I2 and Na2S2 with aqueous solutions on GF, GO/GF, VS-MoS2/GF, and VS-MoS2@GO/GF. CVs of the catalysts deposited on glassy carbon in (c) 0.1 mol/L NaI3 + 0.5 mol/L NaCl solution and (d) 0.06 mol/L Na2S + 0.02 mol/L S + 0.5 mol/L NaCl solution at a scan rate of 50 mV/s.

Figure 4 (a) DOS of GO, VS-MoS2, and VS-MoS2@GO by DFT calculations. (b) The structural model of VS-MoS2@GO. Free-energy diagram of (c) I and (d) S intermediates for GO (orange), VS-MoS2 (blue), and VS-MoS2@GO (red).

Figure 5 (a) Scheme of the proposed SIRFB configuration. (b) The first charge and discharge curves of the SIRFB based on GF, GO/GF, VS-MoS2/GF, and VS-MoS2@GO/GF electrodes at 20 mA/cm2 with 50% SOC. (c) Discharge polarization and power density curves of the SIRFB. (d) Rate performance with different current density. (e) Plots of EE at different operational current densities. Galvanostatic cycling EE of the SIRFB at (f) 20 mA/cm2 and (g) 50 mA/cm2 with 50% SOC. (h) EIS plots of the SIRFB with GF, GO/GF, VS-MoS2/GF, and VS-MoS2@GO/GF electrodes. (i) Comparison of properties with other sulfide electrode materials.

 扫一扫看文章


扫一扫关注我们
 DownLoad:
 下载:
下载:
 下载:
下载: