Scheme 1.
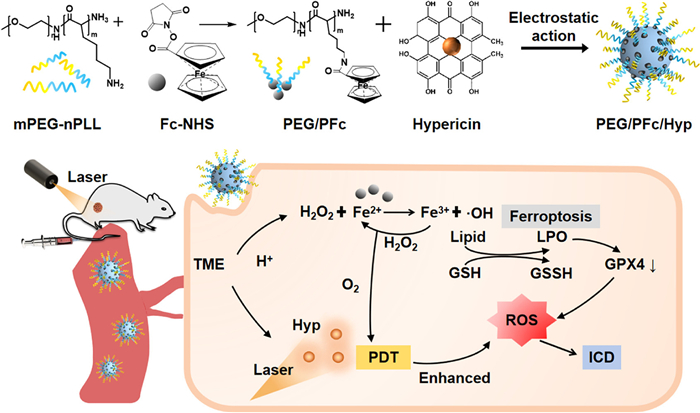
Schematic illustration of the synthesis and anti-tumor therapeutic process of PEG-PFc/Hyp.
Ferrocene-integrated hypericin self-assembly nanocomplex directs ferroptosis for enhanced cascade tumor photodynamic therapy and immune effects
Xiaoxuan Zhou , Qiuhui Hu , Chengbin He , Yue Qian , Xiaodan Xu , Jianbin Tang , Hongjie Hu

The treatment of solid tumors has encountered significant challenges due to the unfavorable tumor microenvironment, characterized by imbalanced oxidation–reduction properties and immune-suppressive mechanisms [1,2]. Traditional anti-tumor modalities primarily focused on tumor-cell killing via “physiological” apoptosis, which failed to alter the immune-suppressive tumor microenvironment. Recently, researchers have identified an apoptotic cell death subroutine that offers positive immune stimulatory effects, leading to the development of immunogenic cell death (ICD) [3–5]. The ICD pathway can induce cell death that is associated with immunogenicity and the release of damage-associated molecular patterns (DAMPs), such as surface-exposed calreticulin (ecto-CRT) and high mobility group box 1 (HMGB1), primarily released by dying tumor cells, which can send "eat me" signals and stimulate the antigen presentation function of dendritic cells [6,7]. Additionally, various treatments, including chemo-drugs, radiotherapy, and photodynamic therapy (PDT), have been shown to effectively induce practical ICD effects [8–10].
PDT is widely utilized in tumor treatment through the reaction of photosensitizers (PS) that accumulate in tumor areas when exposed to specific light irradiation, resulting in tumor cell death due to the generation of abundant reactive oxygen species (ROS) [11,12]. This approach offers significant advantages for non-invasive and on-demand drug release. Previous research has demonstrated that light-activated hypericin (Hyp) can produce high levels of ROS and calreticulin (CRT) exposure, which leads to strong ICD-associated immunotherapy effect in vitro [13,14]. However, the therapeutic impact of Hyp-based PDT is limited by the tumor's inherent redox homeostasis mechanisms and hypoxic microenvironment, which contribute to severe therapy resistance and cancer cell metastasis. Therefore, to enhance the therapeutic efficacy of PDT and its induced ICD effect, it is essential to regulate redox homeostasis in situ and increase the sensitivity of cancer cells to oxidative stress.
Ferroptosis is an iron-dependent programmed cell death caused by the inhibition of cellular antioxidative system, especially glutathione (GSH) and glutathione peroxidase 4 (GPX4), as well as the accumulation of lethal lipid peroxidation (LPO) [15–17]. Iron plays an essential role in ferroptosis therapy due to the production of toxic hydroxyl radicals (•OH) through Fenton reaction. Cancer cells generally exhibit high rates of metabolism and proliferation, leading to a greater demand for iron compared to normal cells, making them more susceptible to ferroptosis. It has been reported that the rate-limiting step of the Fenton reaction could be accelerated by light radiation [18,19]. Thus, we believe that combining PDT with ferroptosis could synergistically regulate tumor redox homeostasis, increasing the sensitivity of cancer cells to ROS and enhancing the ICD effects in tumors. As a typical Fenton reagent, ferrocene can donate electrons from its ferrocenyl group to H2O2 through its two parallel cyclopentadiene rings. This reaction generates highly toxic •OH in the tumor microenvironment, making ferrocene a promising candidate for effective cancer treatment in conjunction with PDT. Additionally, the ongoing generation of oxygen from Fenton reactions induced by Fe3+ transformed from ferrocene can alleviate the hypoxic conditions to cascade improve the effectiveness of PDT [20–23]. Based on above, developing a versatile and simple nanosystem combining ferrocenyl-induced ferroptosis and Hyp-induced PDT to improve anti-tumor efficacy by enhancing immune-stimulating ICD is of great significance.
Herein, we developed a complex nanoparticle (PEG-PFc/Hyp) with Hyp loaded in an amphiphilic copolymer micelle containing ferrocene moiety, possessing great kinetic stability, biocompatibility, and redox capability, for enhanced anti-tumor therapy (Scheme 1). Once PEG-PFc/Hyp is taken up by tumor cells, the Hyp-based PDT induced a substantial amount of ROS when exposed to light. Meanwhile, ferrocene serves as a source of Fe2+, which triggers tremendous increment of LPO via the Fenton reaction (H+ + Fe2+ + H2O2 → Fe3+ + H2O + •OH) by utilizing the excess cellular ROS, resulting in severe redox imbalance and cellular ferroptosis. Moreover, the transformed Fe3+ can be converted back to Fe2+ by H2O2, releasing O2 (2Fe3+ + H2O2 → 2Fe2+ + 2H+ + O2), which in turn further enhances the ability of PDT to generate more ROS. Furthermore, the cascade production of toxic ROS blocks the transport of GSH and inhibits the activity of GPX4, which breaks the balance of the antioxidant system in tumor cells, increasing the significant damage to tumor cells, leading to significant ICD initiation and DAMPs release. Consequently, the generation of ROS and peroxidation aid PEG-PFc/Hyp to achieve great anti-tumor efficacy in vivo through integrating ferrocene-based ferroptosis and Hyp-based PDT as well as the destruction of metastatic tumors, thus providing new therapeutic options for tumors that are resistant to PDT.
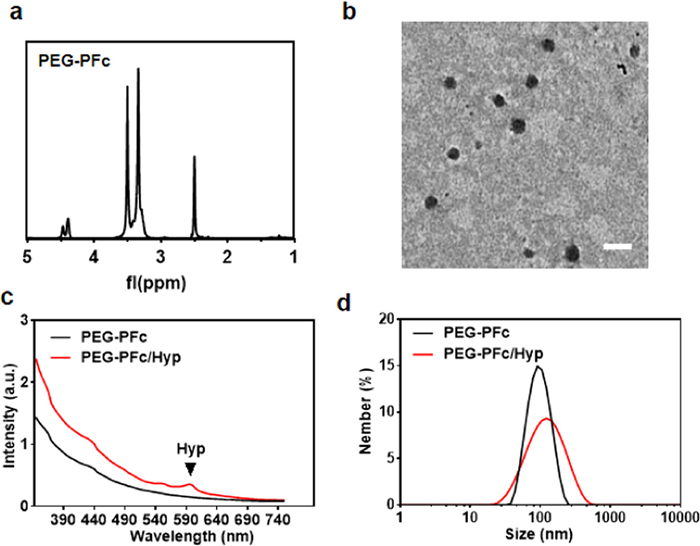
The glycol-b-poly-L-lysine (mPEG-nPLL) was synthesized by ring-opening polymerization of L-lysine N-carboxyanhydride with mPEG-NH2 as the initiator (Fig. S1 in Supporting information) [24]. PEG-PFc was synthesized by the reaction between PEG114-PLL10 and ferrocene carboxylic acid N-succinimidyl ester(ferrocene-NHS). Hyp was further encapsulated in the above fabricated amphiphilic polymer to form PEG-PFc/Hyp (Scheme 1). The nanoparticles with optimal particle size can be obtained by adjusting the content of PEG and PLL to 100 and 40. It can be seen from Table S1 (Supporting information) that the high proportion of PEG leads to the failure of the formation of nanoparticles, while the high proportion of PLL leads to an increase of particle size. Of note, the sizes of the PEG-PFc/Hyp could be easily tailored by tuning the mass ratio of the PEG-PLL, Hyp, and ferrocene (Fc) (Table S2 in Supporting information). For example, the average diameters of PEG-PFc/Hyp increased from 90 nm to 750 nm with the alteration in the mass ratio. Considering particle size to vessel wall pore size ratio and acceptably low clearance and extravasation in normal tissues, there is an optimal nanoparticle size range (50–200 nm) that provides efficient transvascular transport in many tumors [25]. Therefore, nanoparticles with a particle size greater than 200 nm were excluded. Given the loading rate of Hyp and Fc, PEG-PFc/Hyp made from PEG-PLL, Hyp, and Fc at a mass ratio of 10:1:8, whose average hydrodynamic diameter was 122 nm, was selected for further evaluation in this study. Fig. 1a showed the 1H nuclear magnetic resonance (NMR) spectrum of PEG-PFc/Hyp. For PEG-PFc/Hyp, the peaks of hydrogen groups in ferrocene appeared at 3.5 and 4.5 ppm, and the mPEG next to methylene appears between 2.48 ppm and 2.87 ppm, which indicated the ferrocene ether reacted with the PEG114-PLL10 amino groups. The transmission electron microscopy (TEM) image indicated that the PEG-PFc/Hyp nanoparticle has a relatively uniform spherical morphology with a diameter of 100 nm (Fig. 1b). The visible absorption at 595 nm suggested that Hyp was successfully loaded into the nanoparticle (Fig. 1c). Dynamic laser scattering (DLS) measurement exhibited that the average diameter of PEG-PFc/Hyp was about 122 nm (Fig. 1d). Moreover, elemental mapping images further demonstrated the existence of C, O, and Fe elements in PEG-PFc/Hyp (Fig. S2a in Supporting information). The size stability of PEG-PFc/Hyp (Hyp equivalent 0.5 mg/mL) dispersed in different media (saline, phosphate buffered saline (PBS), H2O and serum) was also tested on days 1, 2, 3, 5 and 7. As shown in Fig. S2b (Supporting information), there was no significant change in particle size with the extension of time, indicating the good colloidal stability of PEG-PFc/Hyp.
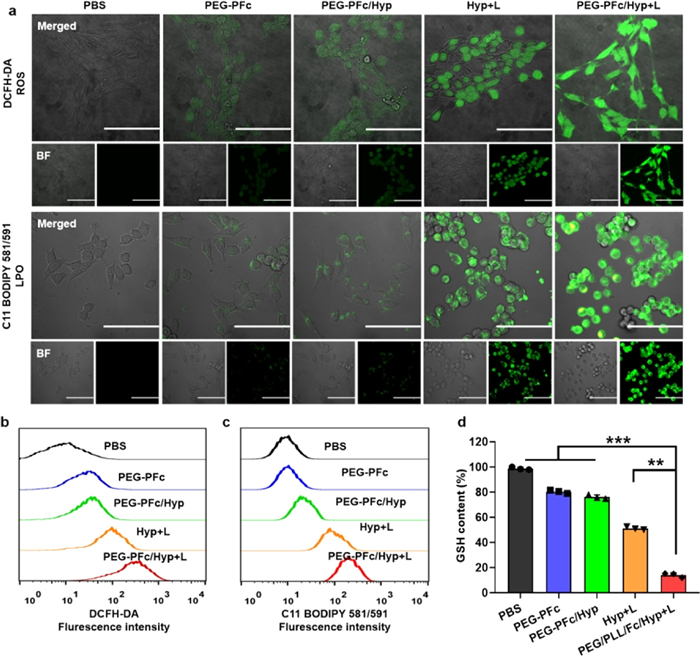
The 4T1 cells were co-cultured with free Hyp and PEG-PFc/Hyp (Hyp, 0.5 µg/mL) for 0.25, 0.5, 1, 2 and 4 h. Fig. S3a (Supporting information) showed that PEG-PFc/Hyp could be phagocytosed by 4T1 cells, and the phagocytic proportion increased with the extension of co-incubation time with PEG-PFc/Hyp, reaching 90.6% at 2 h and 99.8% at 4 h. Thus 2 h was selected as the optimal time point for PEG-PFc/Hyp endocytosis. As shown in Fig. S3b (Supporting information), PEG-PFc/Hyp and Hyp were respectively incubated with 4T1 cells for 2 h. The intracellular fluorescence of PEG-PFc/Hyp group was more obvious than that of free Hyp group and PBS group. This may be because modification of PEG/PLL significantly increased the biocompatibility of nanoparticles and promoted PEG-PFc/Hyp transfer to 4T1 cells [26]. The ROS, LPO, malondialdehyde (MDA), and GSH of 4T1 cells treated by free Hyp, PEG-PFc, and PEG-PFc/Hyp with or without laser irradiation (595 nm, 2.5 W/cm2, 5 min) were investigated in vitro. The 2,7-dichlorodihydrofluorescein diacetate (DCFH-DA), C11 boron-dipyrromethene (BODIPY) 581/591 and MDA staining assay were used to detect cellular ROS, LPO, and MDA contents, respectively. As shown in Figs. 2a–c, confocal laser scanning microscopy (CLSM) and flow cytometry (FCM) were applied to analyze the intracellular ROS and LPO generation after different treatments. The control groups (PBS) showed that only a small amount of ROS was produced. In contrast, cells treated with PEG-PFc/Hyp with light exhibited significantly stronger fluorescence than other groups, suggesting the increased ROS and LPO levels caused by the Fenton reaction and ferroptosis. The fluorescence intensity of ROS, LPO levels and MDA contents was statistically analyzed (Fig. S4 in Supporting information), and it was found that ROS LPO levels and MDA contents produced by the PEG-PFc/Hyp with light group were greater than that by PEG-PFc/Hyp and free Hyp with light group (the differences were statistically significant, P < 0.001). Compared with the ROS detection of PEG-PFc/Hyp and PEG-PFc/Hyp with light, it can be inferred that Hyp, as a selective anti-tumor PS, could enhance ROS production and consolidate the PDT efficiency of anti-tumor therapy. An excellent redox-reversible characteristic of the ferrocene molecule also made it a potential heterogeneous Fenton-like catalyst [27]. ROS production can significantly deplete GSH in tumor cells. As shown in Fig. 2d, with the increase of ROS in 4T1 cells, the production of GSH in 4T1 cells by PEG-PFc/Hyp with laser was significantly reduced than that by other groups. The electron donor–acceptor ability of ferrocene moiety endows it with good redox characteristics and high catalytic capacity as an excellent Fenton catalyst [28,29]. The 4T1 cells showed a round shape due to the toxicity of PEG-PFc/Hyp with laser due to ferroptosis (Fig. 2a). The combination of ferroptosis and Hyp-induced PDT generated oxidative ROS and caused impaired cell structure and integrity [30]. These results suggested that under the effect of Hyp-based PDT, PEG-PFc/Hyp promoted ROS and LPO generation and enhanced the impact of the Fenton reaction and ferroptosis.
The anti-tumor properties of PEG-PFc/Hyp were initially performed at a cellular level. As shown in Fig. S5a (Supporting information), even when incubated with 100 µmol/L of PEG-PFc/Hyp, the viability of NIH/3T3 cells remained above 80%, indicating negligible toxicity and good biocompatibility. To verify the anti-tumor efficiency of Fenton reaction and ferroptosis induced by PEG-PFc/Hyp with 595 nm laser, the cell counting kit-8 (CCK-8) assay was analyzed with 4T1, B10F10, and CT26 cells. As shown in Fig. 3a, the cytotoxicity of free Hyp with laser, PEG-PFc, and PEG-PFc/Hyp was limited at low concentrations (<0.1 µmol/L). As the concentration increased, the cytotoxicity of nanoparticles began to enhance. PEG-PFc/Hyp displayed dose-dependent cytotoxicity to tumor cells. At the same concentration, the cytotoxicity of PEG-PFc/Hyp to three types of tumor cells was remarkably enhanced under the illumination condition. It was calculated that the PEG-PFc/Hyp with 595 nm laser required for 4T1, CT26, and B16F10 cells growth inhibition of 50% (IC50) were 3.708, 1.577, 1.154 µmol/L, respectively.
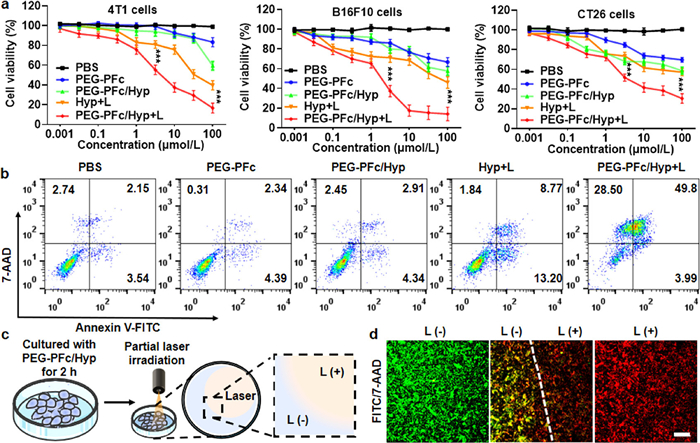
We next characterized the cell apoptosis through FCM staining by Annexin V-fluorescein isothiocyanate (FITC)/7-aminoactinomycin D (AAD) apoptosis kit more quantitatively. The apoptosis rates of cell groups treated with PBS, PEG-PFc, PEG-PFc/Hyp, free Hyp with laser and PEG-PFc/Hyp with laser were about 2.15%, 2.34%, 2.91%, 8.77%, and 49.8%, respectively (Fig. 3b). The quantitative data displayed in Fig. S5b (Supporting information) further confirmed that a distinct apoptosis rate was observed in PEG-PFc/Hyp with laser group higher than in other groups. In contrast, limited levels of late apoptosis of 4T1 cells were visualized in PEG-PFc/Hyp without laser, indicating that PEG-PFc/Hyp with laser greatly influenced cell activity. 4T1 cells were treated as shown in Fig. 3c, and the CLSM further verified the inhibition effect on tumor cells. 4T1 cells were exposed to partial 595 nm laser irradiation after being treated with PEG-PFc/Hyp, the irradiated area was predominantly filled with apoptotic cells, a result of singlet oxygen exposure (Fig. S6 in Supporting information), which were presented in red. In contrast, the non-irradiated area was dominated by living cells, as evidenced by green. The distinction between a light area and a non-light area could be observed in the CLSM images (Fig. 3d).
According to the mechanism of PDT-ferroptosis-ICD induced by PEG-PFc/Hyp with laser, the downregulation of GPX4 and accumulation of LPO were critical elements in the ferroptosis process. Besides, Hyp-PDT could trigger ICD, which released DAMPs, such as CRT and HMGB1. The expression of related markers in 4T1 cells was directly observed by immunofluorescence staining after different treatments. As shown in Fig. 4a, the fluorescence intensity of GPX4 on cells decreased obviously after PEG-PFc/Hyp with laser treatment, which could be ascribed to the oxidation from GSH to glutathione disulfide (GSSG), leading to depression of GPX4.
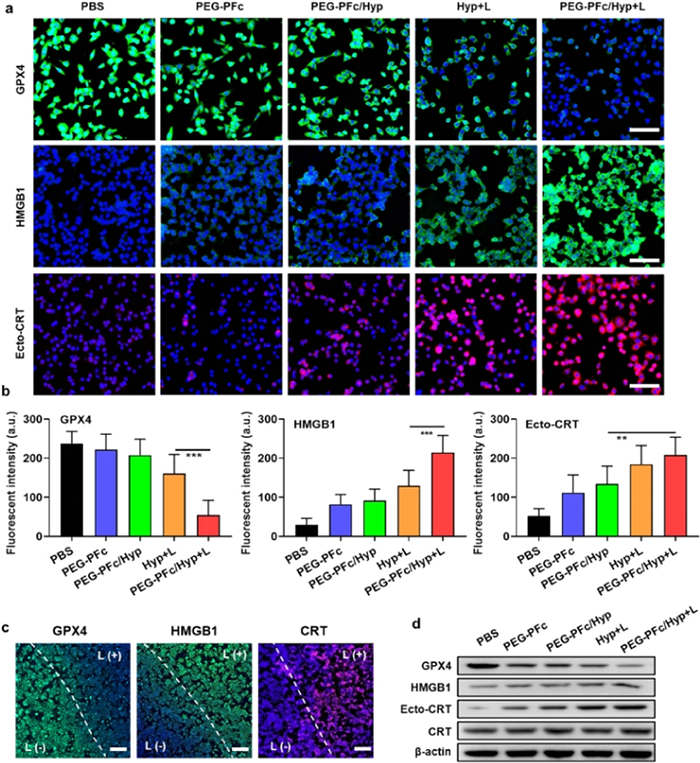
Meanwhile, the expression of HMGB1 and CRT in 4T1 cells significantly increased after treating PEG-PFc/Hyp with laser. Specifically, it could be observed that the expression of ecto-CRT on the cell membrane increased, illustrating the effective induction of ICD (Fig. S7 in Supporting information). Fig. 4b showed the quantitative analysis of fluorescence intensity of GPX4, HMGB1, and ecto-CRT on 4T1 cells after various treatments, respectively. Besides, as shown in Fig. 4c and Fig. S8 (Supporting information), the PEG-PFc/Hyp group with partial laser irradiation exhibited different expressions of GPX4, HMGB1, and CRT in regions with and without PDT. The Western blot results also showed that after being treated with PEG-PFc/Hyp and partial laser irradiation, the cellular GPX4 content decreased, HMGB1 and ecto-CRT range increased (Fig. 4d and Fig. S9 in Supporting information). At the same time, total CRT expression was unchanged, consistent with immunofluorescence results. The alterations of ICD-related markers confirmed that the PEG-PFc/Hyp could induce ecto-CRT expression by the Hyp-based PDT, promote the release of HMGB1 and enhance the treatment of PDT-ferroptosis-ICD.
The pharmacokinetics of PEG-PFc/Hyp was conducted via analyzing the changeable Fe content in blood after injecting PEG-PFc/Hyp (Hyp equivalent 0.5 mg/mL) intravenously. All animal studies followed standard Guidelines from the Experimental Animals Institute of Zhejiang University and were approved by the Institutional Ethical Committee of Animal Experimentation of Zhejiang University in China. The obtained blood circulation curve in Fig. S10 (Supporting information) was analyzed by a two-compartment model, and the first (t1/2(α)) and second (t1/2(β)) phases of circulation half-lives were calculated to be 0.5 and 4.6 h, respectively, which made PEG-PFc/Hyp possibly accumulate in tumors. The anti-tumor effect of PEG-PFc/Hyp was further analyzed on the orthotopic 4T1 models, as shown in Fig. 5a. Tumor-bearing mice were randomly divided into five groups (n = 5): PBS, PEG-PFc, free Hyp, PEG-PFc/Hyp with or without laser irradiation (Hyp equivalent 0.5 mg/mL). After five rounds of treatments, the tumor size and mouse weight were measured every other day. As depicted in Figs. 5b and c, the tumor volume of all groups kept increasing except the PEG-PFc/Hyp with laser. The control group (PBS) had almost no anti-tumor effect. In contrast, the PEG-PFc group only partially inhibited tumor growth. This may be due to the Fenton reaction triggered by Fe2+ among ferrocene and H2O2, leading to ferroptosis in the tumor site. In comparison, PEG-PFc/Hyp with laser group showed the most excellent tumor ablation effect, and the tumor volume was significantly reduced within 15 days. The tumor inhibition rate of the PEG-PFc/Hyp with laser group was calculated as 98.4%, which showed statistically significantly higher than PEG-PFc (13.0%), PEG-PFc/Hyp only (37.5%), and free Hyp with laser group (59.4%). Additionally, mice had no significant weight loss during anti-tumor therapy, indicating low systemic toxicity of PEG-PFc/Hyp (Fig. 5d). The hematoxylin-eosin (HE) staining analysis showed no inflammatory or obvious tissue damage in major organs, including the heart, liver, spleen, lung, kidney, and intestine (Fig. S11 in Supporting information). The above results demonstrated the outstanding biocompatibility and low therapeutic toxicity of PEG-PFc/Hyp.
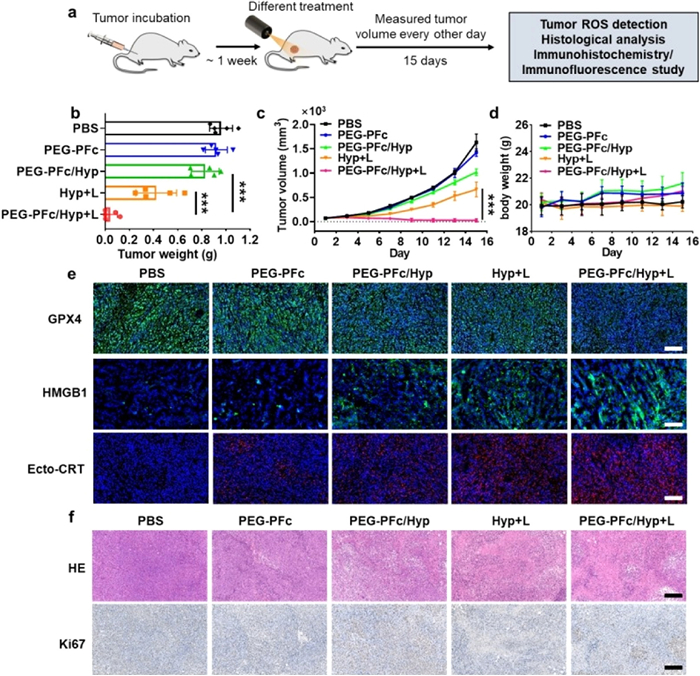
After the above treatments, tumors were collected for further study. The synergistic effect of ferroptosis and Hyp-based PDT would become a potent ICD-inducing strategy in the tumor microenvironment. Therefore, the ROS detection and immunofluorescence analysis of GPX4, ecto-CRT, and HMGB1 were detected to verify ferroptosis and ICD. As shown in Fig. 5e, the highest amount of ROS was produced as GPX4 consumed inside the tumors of the PEG-PFc/Hyp with light group, followed by Hyp with PDT, PEG-PFc/Hyp, PEG-PFc and PBS groups. The significant anti-tumor efficacy could be attributed to the depletion of GPX4 by PEG-PFc/Hyp after Hyp-PDT treatment. The ICD stimulated by PEG-PFc or PEG-PFc/Hyp without laser was stronger than PBS but lower than PEG-PFc/Hyp combined with PDT, confirmed by the highest level of ecto-CRT exposure and HMGB1 release. Furthermore, the immunogenic cytokines in both blood and tumors were tested to validate the induction of ICD. As shown in Fig. S12 (Supporting information), the pro-inflammatory cytokines interferon-gamma (IFN-γ), interleukin-6 (IL-6) increased, and anti-inflammatory IL-10, transforming growth factor beta (TGF-β) decreased in blood and tumors after PEG-PFc/Hyp with PDT treatment, suggesting a robust immune response. HE staining and Ki67 immunohistochemistry images showed that the tumor cells in PEG-PFc/Hyp with laser group were seriously necrotic, and the cell proliferation slowed down (Fig. 5f).
To assess the immune anti-tumor benefits of PEG-PFc/Hyp, we conducted further investigations into its therapeutic effects using a lung metastasis mouse model. We developed an orthotopic breast cancer model with 4T1 cells and subsequently treated the mice with either PBS or PEG-PFc/Hyp followed by 595 nm laser irradiation (Fig. S13 in Supporting information). After surgically removing the treated tumors, we established a lung metastasis model to evaluate the immune memory effect of PEG-PFc/Hyp. The HE staining images of the lung tissues revealed that the mice treated with PEG-PFc/Hyp and PDT exhibited a significant reduction in tumor formation in the lungs compared to those treated with PBS, which demonstrated the notable preventive effects of PEG-PFc/Hyp against lung metastases and highlighted a robust immune response.
In summary, we constructed a nanoplatform PEG-PFc/Hyp using the PDT-ferroptosis-ICD strategy to achieve efficient tumor treatment. The Fe in ferrocene can react with tumoral H2O2 produced by Hyp-induced PDT, triggering the Fenton reaction and generating ROS and LPO that induce tumor cell ferroptosis. Notably, GPX4 depletion and O2 supplied by Hyp-based PDT can increase excessive oxidative stress levels to promote ICD. This nanoplatform nearly eradicated subcutaneous tumors and exhibited potent anti-tumor activity against tumor metastases in vivo. The novel PDT-ferroptosis-ICD strategy inspired us to further study the relationship between ferroptosis, PDT, and tumor immune system responses, which has great potential for applying synergistic immune anti-tumor therapies.
The authors declare that they have no known competing financial interests or personal relationships that could have appeared to influence the work reported in this paper.
Xiaoxuan Zhou: Writing – original draft, Methodology, Investigation, Formal analysis, Data curation. Qiuhui Hu: Writing – original draft, Investigation. Chengbin He: Methodology, Investigation. Yue Qian: Software, Resources. Xiaodan Xu: Writing – review & editing, Supervision, Investigation, Conceptualization. Jianbin Tang: Writing – review & editing, Supervision, Funding acquisition. Hongjie Hu: Supervision, Funding acquisition.
This work was financially supported by the National Key R&D Program of China (No. 2024YFF1206700), the National Natural Science Foundation of China (No. T2293753), the Zhejiang Provincial Natural Science Foundation of China (No. LQ24H180006), and the Medical Health Science and Technology Project of Zhejiang Provincial Health Commission (Nos. 2023RC181, 2024KY1121).
Supplementary material associated with this article can be found, in the online version, at doi:
J. Yates, E.M. Van Allen, Cancer Cell 43 (2025) 708–727. doi: 10.1016/j.ccell.2025.03.018
D.J. Martini, C.J. Wu, Cancer Discov. 15 (2025) 1315–1324. doi: 10.1158/2159-8290.cd-25-0300
S. Sen, M. Won, M.S. Levine, et al., Chem. Soc. Rev. 51 (2022) 1212–1233. doi: 10.1039/d1cs00417d
S.W. Linderman, L. DeRidder, L. Sanjurjo, et al., Nat. Rev. Clin. Oncol. 22 (2025) 262–282. doi: 10.1038/s41571-025-01000-6
Y. Pan, J. Cheng, Y. Zhu, et al., Chem. Soc. Rev. 53 (2024) 6399–6444. doi: 10.1039/d2cs00968d
Z. Gao, X. Zheng, W. Liu, et al., Chin. Chem. Lett. 36 (2025) 109874. doi: 10.1016/j.cclet.2024.109874
Q. Zhang, D. Chen, X. Liu, et al., Small 21 (2025) e2403165. doi: 10.1002/smll.202403165
L. Jia, Y. Hong, X. He, et al., Chin. Chem. Lett. 36 (2025) 109957. doi: 10.1016/j.cclet.2024.109957
X. Zhang, C. He, Y. Chen, et al., Biomaterials 275 (2021) 120987. doi: 10.1016/j.biomaterials.2021.120987
H. Li, Y. Dou, H. Yang, et al., J. Nanobiotechnology 22 (2024) 100. doi: 10.1186/s12951-024-02346-2
T. Yang, Q. Zhang, Y. Miao, et al., Adv. Mater. 37 (2024) e2403756.
Y. Pei, Y. Pan, Z. Zhang, et al., Adv. Sci. 12 (2025) e2413879. doi: 10.1002/advs.202413879
C. Liang, X. Liu, J. Yu, et al., J. Adv. Res. 77 (2025) 669–688. doi: 10.1016/j.jare.2025.01.042
J. Fiegler-Rudol, N. Zięba, R. Turski, et al., Biomedicines 13 (2025) 181. doi: 10.3390/biomedicines13010181
S. Li, J. E, X. Zhao, et al., Adv. Mater. 37 (2025) e2417198. doi: 10.1002/adma.202417198
Y. Zhao, A. Linkermann, M. Takahashi, et al., Eur. Heart J. 46 (2025) 3247–3260. doi: 10.1093/eurheartj/ehaf374
Y. Fan, Y. Wang, W. Dan, et al., Nat. Cell. Biol. 27 (2025) 641–653. doi: 10.1038/s41556-025-01610-3
Y. Wang, C. Wu, C. Feng, et al., Chin. Chem. Lett. 36 (2025) 109902. doi: 10.1016/j.cclet.2024.109902
L. Deng, M. Liu, D. Sheng, et al., Biomaterials 271 (2021) 120710. doi: 10.1016/j.biomaterials.2021.120710
J. Wang, W. Zhang, Z. Xie, et al., Biomaterials 308 (2024) 122570. doi: 10.1016/j.biomaterials.2024.122570
Q. Xiang, X. Yang, Z. Zhang, et al., Adv. Mater. 37 (2025) e2419120. doi: 10.1002/adma.202419120
Y. Li, S. Han, Y. Zhao, et al., Small 21 (2024) e2404299.
L. Shi, F. Hu, Y. Duan, et al., ACS Nano 14 (2020) 2183–2190. doi: 10.1021/acsnano.9b09032
M.L. Patil, M. Zhang, T. Minko, ACS. Nano 5 (2011) 1877–1887. doi: 10.1021/nn102711d
M. Souri, M. Soltani, F.Moradi Kashkooli, et al., Mater. Today Bio. 13 (2022) 100208.
M.J. Mitchell, M.M. Billingsley, R.M. Haley, et al., Nat. Rev. Drug Discov. 20 (2021) 101–124. doi: 10.1038/s41573-020-0090-8
Y. Li, B. Zhang, X. Liu, et al., J. Hazard Mater. 353 (2018) 26–34. doi: 10.1016/j.jhazmat.2018.02.034
Y. Zhao, S. Zhang, Z. An, Angew. Chem. Int. Ed. 64 (2024) e202421851.
A. Straube, L. Useini, E. Hey-Hawkins, Chem. Rev. 125 (2025) 3007–3058. doi: 10.1021/acs.chemrev.4c00295
Z. Tang, P. Zhao, H. Wang, et al., Chem. Rev. 121 (2021) 1981–2019. doi: 10.1021/acs.chemrev.0c00977

Scheme 1 Schematic illustration of the synthesis and anti-tumor therapeutic process of PEG-PFc/Hyp.

Figure 1 (a) The 1H NMR spectra of PEG-PFc. (b) TEM image of PEG-PFc/Hyp. Scale bar: 200 nm. The ultraviolet (UV) absorption spectra (c) and hydrodynamic size (d) of PEG-PFc/Hyp and PEG-PFc.

Figure 2 The ROS and LPO generation by PEG-PFc/Hyp nanoplatform. CLSM images (a) and FCM analysis (b, c) of ROS and LPO generation in 4T1 cells treated by PBS, PEG-PFc, PEG-PFc/Hyp, free Hyp with 595 nm laser, and PEG-PFc/Hyp with laser. (d) GSH content of 4T1 cells after various treatments. Scale bar: 100 µm. Data presented as means ± SD, one-way ANOVA. **P < 0.01, ***P < 0.001.

Figure 3 Cell viability assays. (a) CCK-8 assays of 4T1, B16F10, and CT26 cells after different treatments. (b) Annexin V-FITC)/AAD analysis of 4T1 cell apoptosis after various treatments (n = 3). The schematic illustration (c) and CLSM images (d) of Annexin V-FITC (green, live cells) and propidium iodide (red, dead cells) co-stained cells after incubation with PEG-PFc/Hyp and laser irradiation. Laser-exposed areas were indicated. Scale bar: 100 µm. Data presented as means ± SD, one-way ANOVA. ***P < 0.001.

Figure 4 ICD induced by PEG-PFc/Hyp in vitro. (a) The CLSM images of GPX4, HMGB1, and ecto-CRT expression on 4T1 cells after different treatments. (b) The fluorescence intensity of (a) qualified by Image J software. (c) The immunofluorescence images of 4T1 cells after incubation with PEG-PFc/Hyp exposed to partial laser irradiation. (d) Western blot images of the expression of GPX4, HMGB1, Ecto-CRT, and total CRT in 4T1 cells after various treatments. Scale bar: 100 µm. Data presented as means ± SD, one-way ANOVA. **P < 0.01, ***P < 0.001.

Figure 5 PDT-ferroptosis-ICD anti-tumor efficacy mediated by PEG-PFc/Hyp. (a) The experimental illustration of treatment, histological analysis, immunohistochemistry, and immunofluorescence study of mice bearing 4T1 breast tumor. Tumor weight (b), volume profiles (c), tumor and body weight (d) in mice after different treatments (n = 5). (e) The immunofluorescence staining of GPX4, HMGB1 and ecto-CRT of tumors. Scale bar: 100 µm. (f) HE staining and Ki67 immunohistochemical staining of 4T1 tumors with various treatments. Scale bar: 200 µm. Data presented as means ± SD, one-way ANOVA. ***P < 0.001.

 扫一扫看文章

扫一扫关注我们
 DownLoad:
 下载:
下载:
 下载:
下载: