College of Physics and Optoelectronic Engineering, Faculty of Information Science and Engineering, Ocean University of China, Qingdao 266100, China
b.
School of Flexible Electronics, Sun Yat-sen University, Shenzhen 518107, China
c.
Engineering Research Center of Advanced Marine Physical Instruments and Equipment of Education Ministry of China & Key Laboratory of Optics and Optoelectronics of Qingdao, Ocean University of China, Qingdao 266100, China
d.
Shaanxi Institute of Flexible Electronics, Northwestern Polytechnical University, Xi’an 710072, China
e.
Institute of Precision Instrument and Quantum Sensing, Beihang University, Beijing 100191, China
f.
Boheng Technology (Hangzhou) Co., Ltd., Hangzhou 310016, China
Received Date:
12 March 2025 Accepted Date:
22 July 2025 Revised Date:
22 July 2025 Available Online:
15 April 2026
Abstract:
Carbohydrates play essential roles in the physiological and pathological functions of cells. However, carbohydrate structures involve numerous levels of isomerism, which has posed significant challenges to advancements in glycomics. The technique for carbohydrate recognition needs to be precise in determining all aspects of the stereodiversity for both fundamental research and practical applications. Via quantum tunneling simulations and model analysis, we show that a carbon nanotube based nanopore as a molecular tweezer to trap a single target analyte with controlled dwell time achieved through reversible flexoelectric gating. Under mechanical deformation, the pore walls act as dynamic electrostatic binding sites to capture analyte enabling ample but fast sampling. After establishing Fano resonance as the sensing mechanism to quantitatively evaluate the interaction between the pore wall and analyte, random forest classifier algorithm is employed to classify the quantum transport data. This sensing strategy provides a general discrimination accuracy of higher than 99.4% for identifying carbohydrate isomers. Our findings highlight the efficacy of this combined physics and machine learning-based method in addressing the stereochemical complexity of carbohydrates. The approach not only improves observation time per molecule but also operates in a high-throughput format, offering a powerful artificial intelligence (AI)-empowered biomolecule sensing tool for glycomics research.
Carbohydrates represent the main macronutrient in human diets and are responsible for essential biological activities in all life forms. Their significant diverse functions result from the delicate structures determined by the common isomerism phenomenon. Subtle changes to structural arrangements may cause a dramatic loss of bioactivity and may consequently cause relevant diseases. For example, there are twelve diastereomers of neutral hexoses in total and each composes D and L enantiomers [1]. The naturally occurring form D-glucose rather than the manufactured sugars (L-glucose) is fundamental in human metabolism, but L-glucose fluorescent probes can be useful for detecting cancer cells [2]. D-Mannose is a C-2 epimer of D-glucose and its α-anomer is better to stimulate insulin secretion than its β-anomer does [3]. D-Tagatose as a C-4 epimer of D-fructose and a ketose isomer of D-galactose, is an ideal substitute of sucrose for potential nutraceutical [4] due to its high sweetness and low calorific value [5]. Human glucose transporters 5 (GLUT5) demonstrates the sugar specific uptake of D-fructose rather than D-glucose [6]. Clarifying and elucidating the intricate nature of carbohydrate isomers is essential and crucial for understanding their roles in various biological processes. Despite the tremendous success in ion mobility mass spectrometry (IM-MS) [7], isomeric characterization of carbohydrates remains a challenge, especially for identifying the subtlest forms of sample isomerism at a low abundance concentration [8,9]. Toward this end, measurement of individual molecular targets as opposed to signals averaged across molecular ensembles may be promising alternative strategies and nano-confined sensing interface at the single-molecule level can greatly enhance the sensitivity and selectivity [10,11].
Riding on the current technology dedicated to single-molecule detection, three methodologies, nanopore [12], recognition tunneling (RT) [13] and mechanically controllable break junction (MCBJ) [14] have been successfully applied for isomeric characterization. The first tactic, nanopores have emerged as powerful and robust tools for DNA [15] and protein [16] sequencing. A straightforward extension of this approach to carbohydrates has been demonstrated by phenylboronic acid modified protein nanopores to discriminate monosaccharide [17] and disaccharide isomers [18]. The second approach, RT has been employed to differentiate the anomeric isomers, methyl α-D-glucopyranoside and methyl β-D-glucopyranoside, with 4(5)-(2-mercaptoethyl)-1H-imidazole-2-carboxamide functionalized the metal electrodes to capture the target molecules [19]. The third type, MCBJ with thiomethyl as anchoring groups could distinguish diketopyrrolopyrrole isomers by quantum interference effect [20] and recognize cis and trans isomers of azobenzene by Fano resonance [21]. The quantum transport phenomena [20,21] offer high sensitivity to resolve subtle differences between molecular isomers.
It is noticed that all three technical routes [17-21] employed functional group as binding sites to trap the analyte for prolonged anchoring. The specific interaction between the analyte and the capture group [17-21] plays an important role in the residence time enhancement allowing increased measurement accuracy and benefitting reliable data analysis. However, the fixed binding models offered by capture molecule or anchor group may present an undesirable hurdle preventing the molecular detection in the high-throughput format. Adjustable analyte-nanopore/electrode interactions are critical to address the trade-off between measurement precision and time for processing and analysis. Control over analyte transport dynamics in turn affects the throughput and resolving power of such recognition platforms. Technological innovation is required to overcome current limitations.
Inspired by the three aforementioned methods for isomer identification [17-21], our study here demonstrates a feasible solution of using flexoelectric gating to guide the fine tuning of analyte-nanopore interactions to overcome the challenge. In particular, we apply a carbon nanotube (CNT) nanopore as a molecular tweezer to trap/capture a single biomolecule and obtain a moderate-to-slow association and a fast dissociation of the analyte-nanopore complex (Table S1 in Supporting information). Following this route, we propose that it is possible to achieve the retarded analyte motion but meanwhile enhanced sensing throughput.
As demonstrated by ab initio quantum transport calculations, our nanopore tweezer represents a single-molecule probe that can be employed to reveal the stereochemistry feature of carbohydrates. In particular, the obtained asymmetric transmission line shapes are well described by the Fano resonance model. All transmission data (8400 spectra in total) satisfactorily verify the model. Our physical model applies to nanopore tweezer systems in general, reveals the interplay of flexoelectric gating and molecular gating, and facilitates the identification of critical parameters for related experiments. The established model for addressing the molecule-electrode interface properties is vital to building intelligent bioelectronic sensing systems. To provide an unambiguous assignment of the carbohydrate structure and maximize nanopore discrimination accuracy, an optimized of artificial intelligence (AI) model, random forest classifier (RFC), is adopted to process the multidimensional data. We show that this artificially intelligent nanopore tweezer is successful in accurately identifying six pairs of carbohydrate isomers similar in size, with a maximum specificity of 100%.
In short, herein a flexoelectric gating nanopore tweezer can be used to electromechanically trap and interrogate target analyte at the single-molecule level, which enables accurate and high throughput identification of a challenging series of closely related carbohydrate isomers.
All the calculations were performed within Perdew-Burke-Ernzerhof (PBE) density functional [22], as implemented in the QuantumATK U-2022.12 package [23]. The PseudoDojo pseudopotential was used for all transport calculation [24]. Van der Waals (vdW) corrections were included via the DFT-D3 method [25,26]. In order to accommodate the target molecules, we chose carbon nanotubes (8, 8) to build the transport junction, and the “tweezer” responsible for “clamping” the analytes was composed of two zigzag nanoribbons coupled to the carbon nanotubes. All the dangling bonds were stabilized by hydrogen atoms. Thus, a nanopore with a minimum size of 10.8 Å was formed between the two nanoribbons, which can accommodate all possible conformations of the molecule considered here. At least 15 Å vacuum spacing in the x and y directions was set between the adjacent images in the supercell model. With the energy cut-off of 125 Hartree and a Fermi-Dirac distribution function with an electronic temperature of 100 K, the atomic structures of molecular junction were relaxed until the force acting on each atom was <0.02 eV/Å.
The dipole moment calculation was based on the integral of the differential electron density ρdiff(r→)=ρ(r→)−∑ρatom(r→) along a certain direction r→. It can be calculated by the following equation (Eq. 1):
P→=−e∫r→ρdiff(r→)d3r→
(1)
Dwell time (τ) was calculated by Boltzmann’s relation (τ=ν0−1e(−ΔE/KBT)), where T is temperature, KB is the Boltzmann’s constant (8.62 × 10⁻⁵ eV/K), and ν0 is the attempt frequency (ν0 = 1012/s for all molecules to be measured). Binding energy ΔE was calculated by the following equation (Eq. 2) [27]:
ΔE=Etweezer+molecule−Etweezer−Emolecule
(2)
where Etweezer+molecule is the total energy of the system, Etweezer and Emolecule were energy values of isolated tweezer and isolated molecule, respectively.
First-principles transport calculations were performed based on density functional theory (DFT) combined with the nonequilibrium Green’s function (NEGF) formalism [28]. Three primitive layers of each electrode were included as buffer layers in the scattering region. The Brillouin zone was sampled with 1 × 1 × 150 Monkhorst meshes and the energy convergence values of electrons was set as 10−5 eV. In the case of spin polarization, the underestimation of electron localization for systems with localized π-electrons in the presence of magnetic field was rectified using the Hubbard U parameter [29]. Here, Ueff = 5 eV was used [30], which externally provides a coulomb correlation with the C 2p orbital.
As mentioned in our previous work [31], the model for a parallel double quantum dot (DQD) can be described by the following equation (Eq. 3):
where ε0 is effective energy, which is the arithmetic mean of the energy for quantum dot 1 (ε1) and the energy for quantum dot 2 (ε2). Linewidths Γi* are related to the coupling of the quantum dot i with the left and right electrodes. The effective coupling strength is defined as teff=(ε1−ε2)24+tc2, where tc is the strength of interdot coupling.
The preparation of datasets for implementation of AI is as follows. Eight typical molecules, α-fructofuranose (FF), adenine (AMP), β-glucose (β-Glc), uric acid (UA), thymine (TMP), urea, cytosine (CMP), guanine (GMP), six pairs of carbohydrate isomers, and six pairs of amino acid enantiomers were chosen as target molecules. To mimic the target molecular dynamics inside the nanopore, we considered the angular fluctuations (−15°, −7.5°, 0°, +7.5°, +15°) and position fluctuations (between −0.75 Å and +0.75 Å) of analytes in addition to the optimal configuration. In total, we obtained 8400 transmission spectra data and each spectrum contained 200 data points between −1.0 eV and 1.0 eV.
The performance metrics, accuracy, recall, F1-score (F1) and precision were used to evaluate the performance of machine learning (ML) classification, defined as follows (Eqs. 4–7):
Accuracy=TP+TNTP+TN+FP+FN
(4)
Recall=TPTP+FN
(5)
Precision=TPTP+FP
(6)
F1−score=2×Precision×RecallPrecision+Recall
(7)
where TP/TN represents the number of instances correctly predicted as positive/negative and FP/FN represents the number of instances incorrectly predicted as positive/negative.
The carbohydrates-recognition cycle comprises: (ⅰ) Target analyte molecule binds to the pore wall; (ⅱ) recorded electron tunneling transmission; (ⅲ) AI-powered data analysis and (ⅳ) analyte molecules release, the empty nanopore is ready for the next round of single-molecule analyses. The key aspects of the identification cycle will be introduced in the following order: Working platform (nanopore tweezer), sensing mechanism (Fano resonance), feature extraction and precise isomeric discrimination (AI powered data analysis).
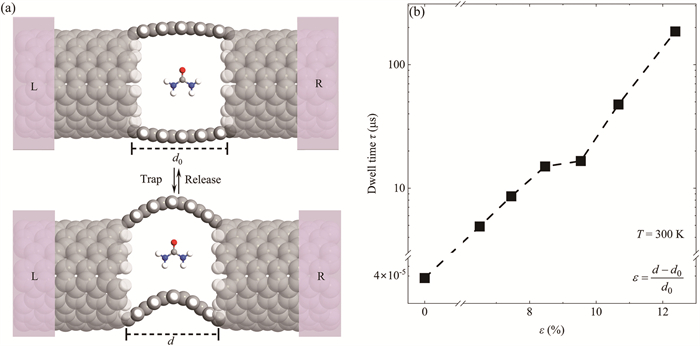
To pursue the two major goals, retarded analyte motion and enhanced sensing throughput, we propose a proof-of-principle nanopore tweezer to effectively control the dynamic interaction of target analyte molecules with the pore wall. Fig. 1a shows our nano-tweezer setup, which consists of two carbon nanotube (CNT) electrodes connected by a nanopore. We consider urea as a model analyte. Clamped molecules with dipole come to rest between the upper and lower rims of the nanopore upon flexoelectric gating effect. The flexoelectronic bias can be achieved by incorporating bending deformation at the pore wall [32]. Fig. 1b illustrates a dramatically increased dwell time of analyte spans orders of magnitude under a range of bending deformation. This active construct would be particularly useful for the single-molecule interrogation over extended time. Since the trapped analyte is not physically in contact with the pore wall but noncovalently docked inside the pore instead, the analyte can easily be released from the pore by simply removing the bending deformation, setting back the pore to the open state again [33]. The nanomechanical changes of pore wall enable reversibly regulating the analyte flux to fulfill the opposite demands, slow translocations (ample sampling) and high-throughput (faster sampling).
Figure 1
Figure 1.
A nanopore tweezer as sensing platform with controlled dwell time. (a) Schematic illustration of the electromechanical nanopore trapping process. L and R represent the electrodes. (b) The dwell time of urea trap in the nanopore as a function bending strain ε. Molecule-pore wall interactions under flexoelectric gating hold the key to tuning the resident time of analyte in the bending nanopore. The dwell time of the trapped urea is significantly increased with the increment of bending deformation.
The binding dynamics is associated with the electrostatic interactions (binding strength) between analyte and the nanopore walls. To detect the dynamic coupling of nanopore-analyte, we plot the re-distributions of charge at the pore wall in the presence of mechanical loads, shown tunable charge separation engineered at the rims of the pore (Fig. S1a in Supporting information). This creates/gives rise to a potential difference between upper and lower rims of pore (Fig. S1b in Supporting information). The ensuing flexoelectronic field, which acts as nano-tweezer exerting an attractive force on the analyte and squeezes it, is proportional to the potential difference intensity. The underlying binding energy reflects the trend of dwell time for urea trap in the nanopore (Fig. S1c in Supporting information), shedding light on the molecular mechanisms governing the translocation process.
In the present work, we explore the advances in flexoelectric gating which can be achieved through the nanomechanical changes of pore to reversibly regulate the analyte flux. The nanopore tweezer has the advantages of dynamic operating at the single molecule level. The convenient and electrostatic tuning of analyte capture and traffic can be tailored without the implantation of capture molecule or anchor group [17-21]. This CNT based sensing architecture can be constructed by current available experimental techniques, such as electron irradiation [34], surface catalysis [35], selective metal nanoparticles etching [36], dynamic magnetic flux template [37], sp3 configuration by carboxylic acids functional groups [38], controlled oxidation cleavage [39-41].
After rationalizing the analyte capture by tweezer, we proceed to investigate the single-molecule analyte-nanopore complexes interactions responsible for tunneling transmission at atomic scale. This is crucial for comprehending molecular recognition. A voltage applied across the nanopore causes electrons to tunnel through the nanopore (Fig. 1a), providing a measurable transmission spectrum.
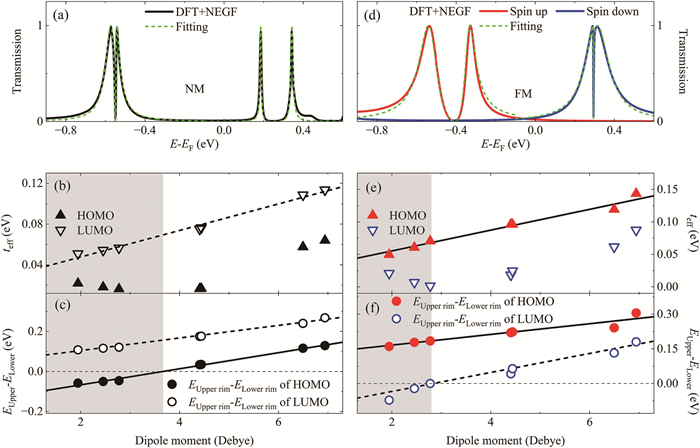
To probe the sensing mechanism, we conduct both first-principles transport calculations and model fitting. Typical transmission spectrum of urea noncovalently docked inside the nanopore at a fixed bending strain ε = 6.5% is shown in Fig. 2a and nonmagnetic (NM) configuration is adopted in this junction. The first-principles calculations display peculiar asymmetric and ultrasharp line shapes both above and below the Fermi level of the junction. The transport character of this testbed (Fig. 2a) is obtained as the sum of two independent external stimuli terms: molecular gating and flexoelectric gating. The modulatory effects exerted by the sole basis of each gating are still evident, featuring ultrasharp spectrum around the Fermi level in Figs. S2a and e (Supporting information).
Figure 2
Figure 2.
Fano resonance as sensing mechanism. Transmission spectrum of urea docked inside the nanopore for (a) NM state and (d) FM state. Related Fano factor teff for (b) NM state and (e) FM state as a function of molecular dipole moment. The black, red and blue solid lines represent first-principles transport data and green dashed lines refer to fitting data by Fano resonance model in (a) and (d), respectively. Each analyte trap encompasses molecular gating and flexoelectric gating (Bending strain is fixed at ε = 6.5%). Energy splitting of frontier orbitals between upper rim and lower rim of the pore for (c) NM state and (f) FM state as a function of molecular dipole moment.
Inspection of the projected density of states (PDOS) in Figs. S2b and f (Supporting information) reveals that the spectrum feature is correlated with the highest occupied molecular orbital (HOMO) and the lowest unoccupied molecular orbital (LUMO) of upper and lower rims of nanopore. The spatial arrangement of two rims results in degenerate electronic states of frontier orbitals and gives rise to two symmetric Breit-Wigner resonances above and below the Fermi level. Both types of gating could break such degeneracy, leading to asymmetric peak-and-dip line shape. In an attempt to qualitatively rationalize the findings, we resort to approximate models able to describe the modulation of electron through nanopore as a result of external gating stimuli. We treat the upper and lower rims as parallel quantum dots and invoke Fano resonance model to describe the spectrum feature based on previous efforts regarding the elucidation of external electric fields induced modulations of electron transport through parallel paths (a full description of this artificial Fano resonance platform can be found in Supplementary Materials of reference [31]). As shown in Fig. 2a, Figs. S2a and e, it is apparent that the fitting lines capture the essential features of first-principles transport results in a quantitative manner, justifying the employment of Fano resonance model.
To provide further evidences supporting the role of physical model in describing the interaction from the nanopore tweezer, we have considered 8400 transport calculations with respect to the magnetic configurations of the junction, different degrees of mechanical loads on the pore rims, 32 species of biomolecules, molecular rotation and translation. All ab initio transport data are fitted particularly well by this artificial Fano resonance model and thus grasps the major physics of nanopore-target molecule interaction.
The formation of nanopore-molecule interface is controlled by a combination of two external stimuli terms: molecular gating and flexoelectric gating. For the sake of completeness to assess the sensing capability of different molecules, we systematically vary the molecular dipole moment (α-fructofuranose, adenine, β-glucose, thymine, urea, cytosine and guanine, varied molecular gating) with nanopore at fixed ε = 6.5% (fixed flexoelectric gating for trapping purpose). The magnitude of the term teff is of fundamental importance in understanding and exploiting the sensing mechanism. This term is extracted from model analysis and boosted by the sum of two independent terms: molecular gating and flexoelectric gating [31], which can describe the effective coupling strength between the two rims of the nanopore. As depicted in Fig. 2b, teff of LUMO shows a linear correlation with molecular dipole moment, whereas that of HOMO displays a visibly different nonmonotonic trend. In concise terms, such results stem from the interplay of molecular gating and flexoelectric gating or a tug of war between them, the concomitant manifestations of two opposite phenomena: (i) The former breaks electron-hole symmetry [42,43]; (ii) the latter preserves electron-hole symmetry [31,44]. Both gating would synergistically but meanwhile competitively affect the trend of teff for HOMO (teff of HOMO varies in a linear fashion by each sole gating, Figs. S2d and h in Supporting information). Our data reveal that there is a dipole threshold for the molecular gating to attain a dominant role, as it needs to counteract the flexoelectric gating. At this point, the HOMO position of upper rim coincides with the one of lower rim (Fig. 2c). The kink in the curve teff (HOMO) at dipole = 3.67 Debye in Fig. 2b, divides the curve into two segments. The gray shaded area marks the region, where molecular gating and flexoelectric gating, counterbalance each other due to their different influences on electron-hole symmetry. Beyond this critical threshold, molecular gating overrides the flexoelectric term and predominantly governs the energy splitting of HOMO (teff).
By expanding such calculations to the spin-polarized state (Fig. 2d), ferromagnetic (FM) configurations, we arrived at two sets of dipole moment dependent teff, as shown in Fig. 2e. The qualitative picture is not changed (Fig. 2f), suggesting Fano resonance is a universal feature dominating the electron transport behavior through the nanopore.
Compared to graphene based nanojunction for sensing, where transmission nearly featureless [45-47], the particular attraction for employing Fano resonance model in our studies, stems from its intrinsic weak coupling quantity [48]. Analytical models are critical to understand the interaction between analyte and nanopore, as they can reveal the underlying physics that causes experimental observations and thus provide a testable link between the theory and the experiment. Within the framework of Fano resonance model, our results provide a comprehensive picture of the major physics in describing the interaction between analyte and pore walls. The quantum transport phenomena [20,21] offer high sensitivity to resolve subtle differences between molecular isomers. This helps to guide the experiment design and signal interpretation in nanopore experiments.
Furthermore, the established model related transmission spectra in the initial transport calculation would avoid the inherent overtraining effects that may occur from subsequent data analysis with an AI model solely based on data fitting.
We proceed to leverage the electronic fingerprint information from quantum transport sampling to discern carbohydrates isomers with minor structural differences in mixed form. The unique linear relationship between teff and dipole moments makes it feasible to identify the target analyte in nanopore with high precision. However, as shown in Fig. S3 (Supporting information), the inevitable position fluctuations (rotation and translation) of analyte around the optimal configuration and the nearly identical values of teff related with similar molecular dipole moments are the significant obstacle to the further application of nanopore tweezer to biomolecular recognition, especially for isomeric characterization.
In recent years, machine learning (ML) has been widely used for fast and inexpensive high-throughput molecular sensing and demonstrated the extremely high discrimination accuracy [49]. To alleviate the issue of relying on the sole parameter teff to identify molecules, we turn to ML assistance for deep analysis from the transmission signals.
By virtue of Random Forest Classifier (RFC) based on optimal hyperparameter (see Part 3 in Supporting information for the discussion of classification algorithm selection and hyperparameter setting) [50], we succeed in demonstrating the high performance of nano-tweezer for isomeric classification. We consider six pairs of carbohydrate isomers in total: β-D(L)-glucose (Glc); α-D(L)-fructofuranose (FF); α-D-glucosamine (GlcN) and α-D-galactosamine (GalN); α-D-glucose (Glc) and α-D-galactose (Gal); methyl α-D-glucopyranoside (α-Glc1Me) and methyl β-D-glucopyranoside (β-Glc1Me); α-D-glucuronic acid (GlcA) and β-L-iduronic acid (IdoA) (detailed atomic structures are shown in Fig. S6 in Supporting information).
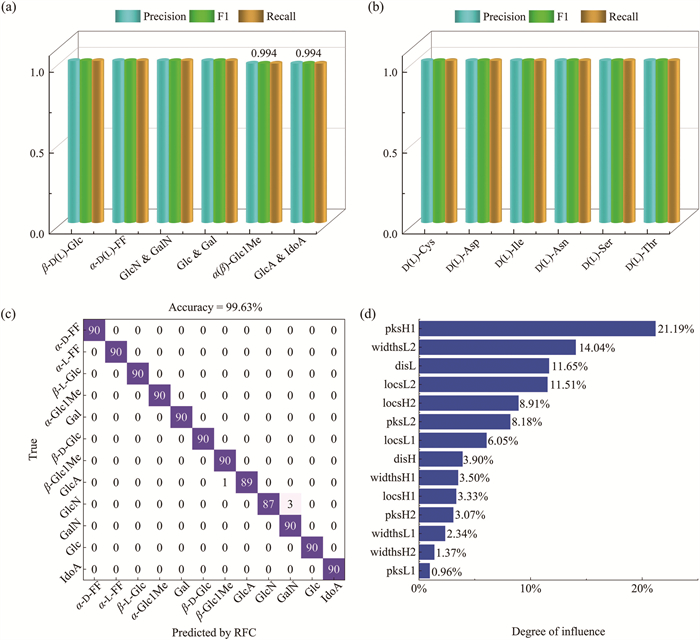
As shown in Fig. 3a, the RFC algorithm shows excellent performance in the binary classification of carbohydrate isomers (six binary data sets and each composed of 900 transmission spectra). Perfect classifications with a maximum accuracy of 100% are achieved except α-Glc1Me and GlcA from their respective counterparts with the maximum accuracy score of 99.44%. The reason for the misclassification may be the accidental overlapping transmission signals by the superposition of similar energy levels from rotation and translation of the target analyte. In addition, to access the stability of the RFC algorithm’s prediction on the target, 10-fold cross-validation technique is utilized on the six binary data sets, and the results summarized in Table S6 (Supporting information) confirm the model stability.
Figure 3
Figure 3.
Classification results of RFC algorithm for several datasets and important features analysis. (a) and (b) present the precision, F1-score (F1) and recall for binary classification of carbohydrate isomers and amino acid enantiomers, respectively. The confusion matrix for classification of complex dataset and the feature importance ranking by SHAP for all carbohydrate isomers in the mixed form are shown in (c) and (d). The selected features are defined in Fig. S4a and Table S2.
Rather than the above binary classification (Figs. 3a and b), in practice we may be more interested in how to distinguish carbohydrate stereoisomers from their complex mixtures, which is a more difficult challenge. It is encouraged that even trained with a complex dataset pool containing six pairs of carbohydrate isomers, the RFC still guarantees the maximum accuracy score of up to 99.63% (Fig. 3c), which indicates the great potential of the RFC algorithms for carbohydrate isomers classification.
To explore the interpretability of the RFC model prediction, we performed Shapley additive explanations (SHAP) analysis [49], shown in Fig. 3d and the fan chart in Fig. S6 (Supporting information). The extraction of the essential features from quantum transport transmission is crucial for the ML training process. The selected features are showcased in Fig. S4a and Table S2 (Supporting information). By virtue of SHAP analysis, the features “pksH1” and “widthsL2” are found to be key observables in driving isomer classification in Fig. 3d. Both terms are related to analyte-nanopore coupling strength. This provides valuable insights into the close correlation between transmission spectrum and molecular gating effect on the nanopore. Our nanopore tweezer platform offers high-quality and clean data based on Fano resonance phenomenon. This informative transport feature is beneficial for ML training and explainability.
To test whether the analysis tool developed here be applicable to other biomolecular isomers, we extend the classification with amino acid enantiomers. We selected six pairs of enantiomers, namely, d(l)-Cys, d(l)-Asp, d(l)-Ile, d(l)-Asn, d(l)-Ser, d(l)-Thr, (detailed atomic structures shown in Fig. S7 in Supporting information) as the “quality inspector” for our sensing platform’s enantiomeric classification capability. From Fig. 3b, we can see that when trained with the binary transmission dataset of amino acid enantiomers, RFC can still achieve perfect classification with a maximum accuracy of 100%. In addition, as shown in Fig. S5c, when trained with a complex data pool containing six pairs of enantiomers, our analysis still demonstrated a powerful discrimination ability with a maximum accuracy of 100%, indicating our tool’s generalizability across different molecular types. Unlike carbohydrate isomers, the SHAP analysis for amino acid enantiomers illustrated that the high ranking of features “locaH1” and “disH” contributing to the classification (Fig. S5d and Table S2 in Supporting information).
Taken together, these two examples (isomeric discrimination six pairs of carbohydrate isomers and amino acid enantiomers) suggest the wide versatility and potential of “Fano resonance + AI explainability” for mapping the binding strength between analyte and nanopore wall at the single-molecule level. This nano-tweezer sensing element samples a highly specific nature of each isomer with similar size.
Herein, integration of flexible bending on a CNT nanopore allows for controlled translocation of the trapped object and functions as a nano-tweezer for carbohydrate isomeric recognition. Both first-principles simulations and modeling analysis have provided the molecular basis for the deep understanding analyte-nanopore interaction. Our results underscore the significance of such kind of definite interface in determining the nanopore’s capability to reveal subtle structural differences of the analyte. We build on quantum physics-based phenomenon for providing the fingerprint information of each carbohydrate isomer and present a deep learning-based AI model achieving the precise single-molecule isomeric discrimination from pooled data. We have also demonstrated the method’s versatility by resolving six pairs of amino acid enantiomers and suggest the nanopore tweezer can be used as an efficient tool for assessing other members of the biomolecular isomers. This robust AI-empowered molecular sensing platform provides essential benefits to the requirements of optimal time and signal resolution, controllable solely by flexoelectric gating and combined with optimized AI model design strategy.
Declaration of competing interest
The authors declare that they have no known competing financial interests or personal relationships that could have appeared to influence the work reported in this paper.
The work was carried out at Marine Big Data Center of Institute for Advanced Ocean Study of Ocean University of China and supported by Fundamental Research Funds for the Central Universities (No. 3002000–842364006), Key R&D Program of Shandong Province (No. 2023CXPT101), Zhoushan Oceanthink Marine Science & Technology Co., Ltd. (No. 3002000–961236054100).
Supplementary materials
Supplementary material associated with this article can be found, in the online version, at doi:10.1016/j.cclet.2025.111624.
S.M. Lundberg, G. Erion, H. Chen, et al., Nat. Mach. Intell. 2 (2020) 56–67. doi: 10.1038/s42256-019-0138-9
[50]
F. Pedregosa, G. Varoquaux, A. Gramfort, et al., J. Mach. Learn. Res. 12 (2011) 2825–2830.
Figure 1
A nanopore tweezer as sensing platform with controlled dwell time. (a) Schematic illustration of the electromechanical nanopore trapping process. L and R represent the electrodes. (b) The dwell time of urea trap in the nanopore as a function bending strain ε. Molecule-pore wall interactions under flexoelectric gating hold the key to tuning the resident time of analyte in the bending nanopore. The dwell time of the trapped urea is significantly increased with the increment of bending deformation.
Figure 2
Fano resonance as sensing mechanism. Transmission spectrum of urea docked inside the nanopore for (a) NM state and (d) FM state. Related Fano factor teff for (b) NM state and (e) FM state as a function of molecular dipole moment. The black, red and blue solid lines represent first-principles transport data and green dashed lines refer to fitting data by Fano resonance model in (a) and (d), respectively. Each analyte trap encompasses molecular gating and flexoelectric gating (Bending strain is fixed at ε = 6.5%). Energy splitting of frontier orbitals between upper rim and lower rim of the pore for (c) NM state and (f) FM state as a function of molecular dipole moment.
Figure 3
Classification results of RFC algorithm for several datasets and important features analysis. (a) and (b) present the precision, F1-score (F1) and recall for binary classification of carbohydrate isomers and amino acid enantiomers, respectively. The confusion matrix for classification of complex dataset and the feature importance ranking by SHAP for all carbohydrate isomers in the mixed form are shown in (c) and (d). The selected features are defined in Fig. S4a and Table S2.

 DownLoad:

 下载:
下载:


 下载:
下载:
