Figure 1.
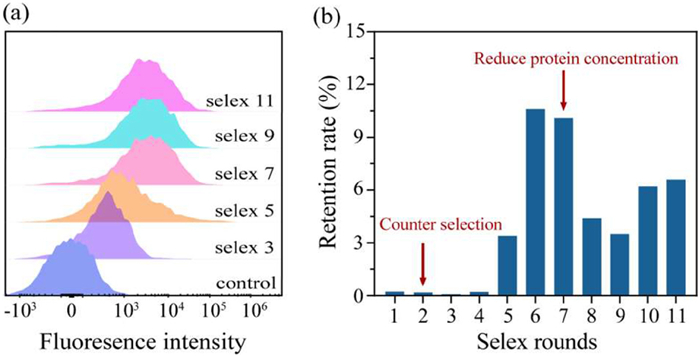
Monitoring the screening process. (a) Affinity analysis of library by flow cytometry. (b) ssDNA pool recovery after each round of SELEX.
Screening of glial fibrillary acidic protein specific aptamer and application in the development of fluorescent biosensor based on isothermal amplification strategy
Yue Cao , Yue Lin , Li Chen , Huimin Niu , Renli Wei , Shuqian Qiu , Anjie Wang , Xiaoai Cao , Xiaofeng Lai , Yongshou Chen , Juanjuan Lin , Shuiliang Wang , Zhenyu Lin , Shenghang Zhang

Alzheimer's disease (AD) is a progressive neurodegenerative disorder and the most prevalent form of dementia, characterized by a gradual decline in cognitive function and memory [1,2]. With aging populations driving increased AD prevalence, it has placed an increasing burden on individuals, families, and healthcare systems [3]. Early diagnosis and timely intervention are crucial for delaying cognitive deterioration and improving patient outcomes [4,5]. Existing diagnostic methods such as cerebrospinal fluid analysis and positron emission tomography are available. However, these approaches are costly and invasive [6,7]. In contrast, peripheral blood biomarker testing offers significant advantages, including cost-effectiveness, patient compliance, and minimal invasiveness [8]. Among these emerging blood biomarkers, glial fibrillary acidic protein (GFAP), a key structural protein in astrocytes, has garnered increasing attention [9,10]. Notably, plasma levels of GFAP begin to rise during the asymptomatic stage of AD, preceding elevations in phosphorylated tau (p-tau181) and neurofilament light chain (NfL) by approximately 5–8 years. In a multicenter study, serum GFAP levels in AD patients were found to have a median concentration of 375 pg/mL, with an interquartile range (IQR) of 276–505 pg/mL, which was significantly higher compared to controls (167 pg/mL, IQR 108–234 pg/mL). Furthermore, GFAP levels were already elevated in the early stages of the disease, specifically in MCI-AD patients, with a median of 300 pg/mL (IQR 232–433 pg/mL, P < 0.001) [11]. This early and aberrant increase provides a crucial time-window advantage for the preclinical detection of AD [12,13].
Current quantification techniques for GFAP predominantly rely on antibodies as recognition elements, including single molecule array (SiMoA) [14], mass spectrometry (MS) [15], enzyme-linked immunosorbent assay (ELISA), and electrochemiluminescence (ECL) [16]. These techniques can be applied to detect GFAP with high sensitivity, but mostly are associated with high costs, complex procedures, and antibody-related challenges such as instability and inconsistent quality control. So, further exploring the novel detection method for GFAP with enhanced sensitivity and stability is desirable in AD diagnosis.
Aptamers are short single-stranded oligonucleotides selected through the systematic evolution of ligands by exponential enrichment (SELEX) technique, capable of binding target molecules with high affinity and specificity [17–19]. As novel recognition elements, aptamers not only exhibit high affinity and specificity toward targets but also offer several advantages over traditional antibodies, including simplified synthesis, high chemical stability, low cost [20,21]. These features render aptamers particularly advantageous for biosensor development and underscore their potential as robust recognition elements for sensitive GFAP detection.
However, no GFAP-specific aptamers have been reported till now. In this study, magnetic bead-based SELEX (MB-SELEX) technology has been adopted to isolate high-affinity aptamers against GFAP. Through 11 rounds of screening, aptamers with specificity for GFAP were successfully identified. To ensure both high affinity and specificity, negative selection was introduced from the second round to remove non-specific ssDNA sequences. Furthermore, starting from round 7, selection pressure was progressively intensified by lowering the concentration of the target protein and the library input amount (Table S2 in Supporting information).
Flow cytometry and real-time quantitative fluorescent PCR (qPCR) were employed to monitor the selection process and ensure the enrichment of aptamers with optimal binding affinity. Flow cytometry analysis revealed a progressive increase in fluorescence intensity of the 6-carboxyfluorescein (FAM) labeled single-stranded DNA (ssDNA) pool from round 3 to round 9, after which no further increase was observed, indicating saturation of ssDNA enrichment (Fig. 1a). Furthermore, to quantify ssDNA enrichment from each selection round, the initial library was diluted in a 10-fold dilution series from 10 nmol/L to 1 pmol/L to obtain the corresponding standard fluorescence curve, the equation was obtained as Cq = −3.217X + 20.14 with a correlation coefficient of R2 = 0.9875, where X denotes the logarithmic concentration of initial library (Fig. S2 in Supporting information). Subsequently, qPCR was utilized to quantify the eluate after each round of screening to obtain the corresponding Cq value, and substituted into the standard curve equation to calculate the concentration. The elution volume for each round was 200 µL, the amount of elution was obtained by the product of concentration and volume. The actual amount of library input in each round of screening was detailed in Table S2, and the retention rate was obtained by calculating the ratio of the elution amount to the input amount. As illustrated in Fig. 1b, the retention of the ssDNA library plateaued after the 9th round, with minimal variation observed in subsequent rounds, suggesting that additional rounds would not significantly improve enrichment. Therefore, the selection process was terminated at round 11, as binding saturation had been achieved and further rounds would not contribute to the selection of higher-affinity aptamers.
At the final stage of screening, 10% polyacrylamide gel electrophoresis (PAGE) analysis was performed on each library round to assess the integrity of ssDNA. As shown in Fig. S3a (Supporting information), a single band in the range of 75–80 bp was observed, corresponding to the expected length of the ssDNA library, confirming that its integrity was maintained throughout the selection process. The libraries were subsequently purified and high-throughput sequenced. A total of 1048,576 unique DNA sequences were identified, with Apt1 exhibiting the highest copy number, indicating its predominance. Fig. S3b (Supporting information) illustrates that the frequency of the top 10, 100, and 1000 sequences increased with each selection round, indicating that the library became progressively enriched with specific sequences, reducing randomness. The top 38 sequences, each appearing more than 7000 times in round 11, were selected for homology analysis using MEGA software. As shown in Fig. S3c (Supporting information), these sequences were clustered into seven distinct families based on sequence similarity. Dominant sequences from each family were selected according to their frequency, resulting in the identification of nine candidate aptamers (Apt1, Apt2, Apt4, Apt7, Apt9, Apt10, Apt12, Apt16, and Apt19). Their binding responses to GFAP were evaluated by surface plasma resonance spectroscopy (SPR), with Apt1 exhibiting the highest response value (RU), indicating its strongest binding affinity (Fig. S3d in Supporting information). In addition, mfold software was used to predict the secondary structures and Gibbs free energies of the candidate aptamers, providing insights into their structural stability and binding potential (Table S3 in Supporting information). The secondary structures of the candidate aptamers predominantly feature stem-loop motifs, which facilitate binding to GFAP, while the stem regions contribute to structural stabilization (Fig. S4 in Supporting information for their structures).
As shown in Fig. S5a (Supporting information), the equilibrium dissociation constant (KD) value of Apt1 was determined to be 0.621 µmol/L using SPR analysis. To further investigate the interaction mechanism, molecular docking simulations were performed using AutoDock 4.0 (Fig. S5b in Supporting information). The results revealed that Apt1 formed 15 hydrogen bonds with amino acid residues of GFAP. Nucleotides A23, A50, A52, T35, T45, T51, G33, G34, G36, G54, and C37 of the Apt1 sequence were involved in specific molecular recognition. The average hydrogen bond length between these bases and the GFAP residues was 2.65 ± 0.5 Å, suggesting a strong affinity and stable binding interaction (Fig. S5c in Supporting information). Furthermore, secondary structure prediction using mfold revealed that the binding sites were predominantly located within two stem-loop regions (Fig. S5d in Supporting information), indicating that the stem-loop motifs play a critical role in target recognition. To further confirm this conclusion, we assessed the binding affinity of different sequences to GFAP using flow cytometry. Apt1–1 retained the full stem-loop structure, while Apt1–2 and Apt1–3 retained the left and right stem-loops, respectively, and Apt1–4 lacked both stem-loops (sequence details in Table S4 in Supporting information). As shown in Fig. S5e (Supporting information), the binding displacement of Apt1–4 was consistent with that of the blank group, indicating no binding to GFAP. In contrast, Apt1–2 and Apt1–3 exhibited significant rightward displacement, indicating partial binding to GFAP, while Apt1–1 showed an even greater displacement, suggesting a stronger binding affinity. Notably, Apt1 demonstrated the most significant displacement, indicating a more stable conformation. These results further support that the aptamer-GFAP binding sites are primarily located within the stem loops and provide a theoretical basis for the rational design of aptamer-based strategies for GFAP.
Then the selected aptamer had been applied to design a fluorescence biosensor for GFAP in blood. Since the concentration of GFAP in the blood is very low. Signal amplification technology is needed to achieve detection of low concentration targets. Isothermal exponential amplification reaction (EXPAR) enables rapid and efficient nucleic acid amplification at constant temperature, simplifying the process and reducing equipment requirements [22,23]. This process is driven by a specially designed template containing terminal repeat regions complementary to the trigger sequence and a central site recognized by a restriction endonuclease. Through repeated cycles of polymerase extension and endonuclease cleavage, numerous short nucleotide fragments are ultimately released, amplifying the detection signal [24]. Simultaneously, hybridization chain reaction (HCR) provides enzyme-free signal amplification by utilizing a specific trigger sequence that initiates cascade hybridization of two complementary DNA hairpins, resulting in long nicked double-stranded DNA polymers [25,26]. This dual approach has proven to be a valuable tool for highly sensitive and quantitative detection of trace biomarkers.
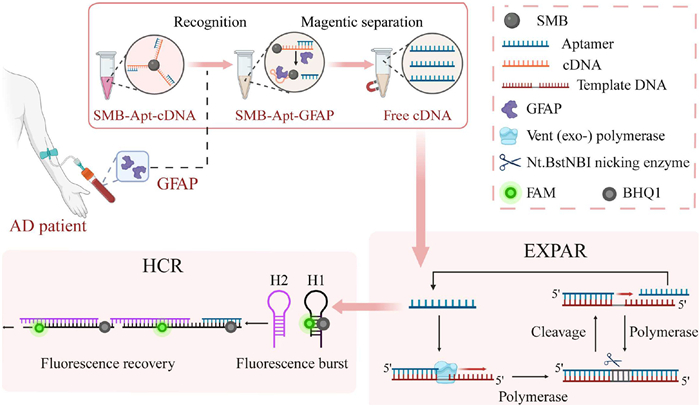
Here, the selected aptamer had been combined with EXPAR and HCR to develop a fluorescent sensor for quantitative detection GFAP. The principle was illustrated in Fig. 2. Initially, biotin-modified Apt1 is hybridized with complementary DNA (cDNA) and immobilized onto streptavidin-functionalized magnetic nanoparticles (SMB). Upon the introduction of GFAP, the aptamer preferentially binds to GFAP due to competitive binding, forming the SMB-Apt1-GFAP complex. This interaction leads to the release of cDNA into the supernatant following magnetic separation. The collected supernatant is then transferred to EXPAR reaction system for further amplification. In the EXPAR system, cDNA hybridizes with template DNA (T-DNA), initiating polymerization by Vent (exo-) DNA polymerase in the presence of dNTPs, forming a double-stranded structure. Nt.BstNBI nicking enzyme subsequently recognizes a specific site and introduces a nick, facilitating the release of free cDNA. This liberated cDNA binds to additional T-DNA molecules, initiating a catalytic cycle that generates a high abundance of cDNA sequences. After amplification, the generated cDNA functions as the initiator for the subsequent HCR reaction. H1 is labeled at the stem region with a fluorophore (FAM) and a quencher (BHQ-1). Initially, H1 maintains a stable hairpin conformation, keeping FAM and BHQ-1 in proximity, which results in fluorescence quenching. Upon the introduction of cDNA, triggering the unfolding of hairpin H1, this structural change leading to the spatial separation of FAM from BHQ-1, thereby restoring the fluorescence signal. In the absence of GFAP, the Apt1 binding sites remain unoccupied, allowing cDNA hybridized with Apt1 and immobilized on the surface of SMB, preventing significant cDNA release into the supernatant. Consequently, downstream EXPAR and HCR reactions are not initiated, the H1 remains in the closed conformation and fluorescence remains quenched. The fluorescence intensity is positively correlated with the concentration of GFAP and can be quantitatively detected.
The EXPAR products were characterized by PAGE, confirming that the reaction was successfully initiated in the presence of cDNA, yielding a considerable amount of short DNA fragments the same length as the cDNA. In contrast, no significant amplification products were observed when cDNA, T-DNA, or enzymes were omitted from the reaction system (Fig. S6a in Supporting information). The feasibility of the method was further validated through fluorescence experiments (Fig. S6b in Supporting information). H1 and H2 hairpin probes were incorporated into the EXPAR product. In the absence of cDNA, fluorescence intensity was low, indicating no non-specific amplification. When cDNA alone was present, fluorescence intensity was negligible due to the insufficient cDNA concentration required to trigger HCR. However, after EXPAR amplification, the elevated cDNA concentration resulted in a ten-fold increase in fluorescence intensity. Subsequently, the feasibility of target presence or absence was verified. As shown in Fig. S6c (Supporting information), when the GFAP concentration was 1 µg/mL, the fluorescence intensity increased by 2.5-fold with the HCR system, and further enhanced to 5.5-fold upon the addition of the dual amplification system. Based on the observed fluorescence changes, it can be concluded that GFAP is capable of restoring fluorescence, while the combination of EXAPR and HCR effectively amplifies the fluorescence signal, demonstrating its potential for high-sensitivity detection.
Key reaction parameters were systematically optimized to achieve the maximum fluorescence response in the amplification reaction. These parameters included the concentrations of Vent (exo-) DNA polymerase, Nt.BstNBI nicking enzyme, T-DNA, and the amplification duration. Insufficient enzyme levels would reduce amplification efficiency and sensitivity, whereas excessive enzyme levels led to unnecessary reagent consumption due to post-reaction deactivation. As shown in Figs. S7a and b (Supporting information), as the concentrations of polymerase and endonuclease increased, the fluorescence intensity also progressively increased. When the concentrations of Vent (exo-) DNA polymerase and Nt.BstNBI nicking enzyme were 0.04 U/µL and 0.2 U/µL, the fluorescence signal plateaued, and further increases in enzyme concentration resulted in stable fluorescence intensity. This suggests that 0.04 U/µL of polymerase and 0.2 U/µL of endonuclease are sufficient to support the enzymatic amplification process. These concentrations were therefore identified as optimal and were employed in subsequent experiments. Next, the concentration of T-DNA was optimized. As illustrated in Fig. S7c (Supporting information), fluorescence intensity increased progressively with higher template DNA concentrations, reaching a peak at 1 µmol/L. Further increases beyond this concentration would trigger nonspecific amplification. So 1 µmol/L was selected as the optimal T-DNA concentration. Finally, the amplification time was optimized. As depicted in Fig. S7d (Supporting information), fluorescence intensity exhibited a time-dependent increase, stabilizing at 60 min with no significant further enhancement beyond this point. Therefore, 60 min was chosen as the optimal amplification duration.
First, we assessed the stability of our aptamer in serum matrix. We incubated Apt1 (10 µL, 500 nmol/L) in 50% human serum at 37 ℃ for durations ranging from 0.5 to 8 h. The stability of Apt1 was evaluated using 10% PAGE, and the results showed that the aptamer remained stable for up to 8 h (Fig. S8a in Supporting information). Then, various concentrations of GFAP were introduced into the serum samples under optimized experimental conditions and the fluorescence of the system had been recorded. The HCR assay, showed a good linear relationship between GFAP concentration and fluorescence intensity in the range of 16 ng/mL to 10 µg/mL, but could not satisfy the detection demand. The linear equation was fitted as follows: ΔF = 153.4 lgCGFAP + 346.9, R2 = 0.9802. Where ΔF denotes the difference of the fluorescence signal detected with and without the presence of GFAP, CGFAP denotes the concentration of GFAP (µg/mL), and R2 is the correlation coefficient. The limit of detection (LOD) for this assay was 3.10 ng/mL, calculated based on a signal-to-noise ratio of 3 (S/N = 3), where S represents the standard deviation of the blank measurements and N denotes the slope of the calibration curve (Fig. S8c in Supporting information).
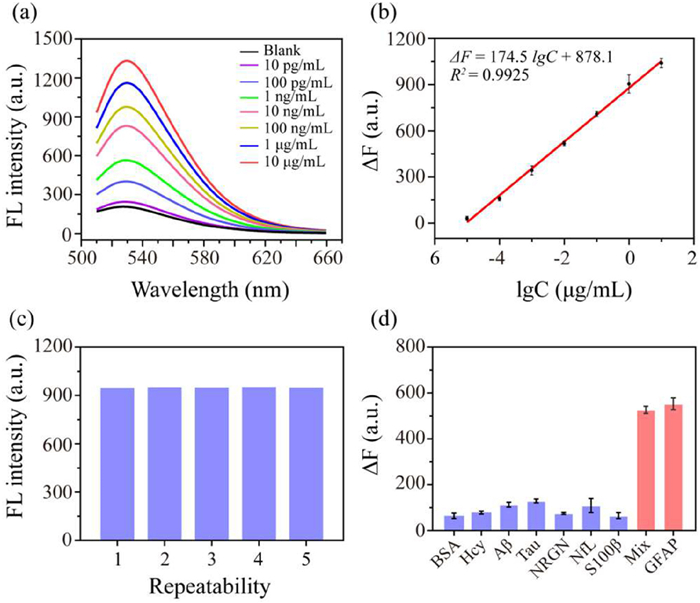
As illustrated in Fig. 3b, the HCR-EXPAR assay demonstrated that ΔF increased with the logarithm of GFAP concentration in the range of 10 pg/mL to 10 µg/mL. The fitted linear equation is as follows: ΔF = 174.5 lgCGFAP + 878.1, R2 = 0.9925. The LOD for this assay was 0.24 pg/mL. Compared to other reported methods for detecting GFAP, our method offers both a lower detection limit and a broader detection range (Table S6 in Supporting information). To assess the reproducibility of the established assay, a 100 ng/mL GFAP was selected, and five parallel experiments were performed. As shown in Fig. 3c, the result demonstrated the relative standard deviation (RSD) is only 2.3%, indicating the excellent reproducibility of the developed sensor. Additionally, the influence of various AD-related biomarkers and protein may present in the serums on the assay was evaluated. The substances tested included bovine serum albumin (BSA), homocysteine (Hcy), Aβ, Tau, neurogranin (NRGN), NfL, and central nervous system specific protein β (S100β). The concentrations of GFAP and the other biomarkers were set at 100 ng/mL and 1 µg/mL, respectively. As illustrated in Fig. 3d, the ΔF values for the other markers were notably lower compared to those in the presence of GFAP alone or the GFAP-containing mixture. This distinct signal difference demonstrates the excellent specificity of the assay for GFAP, effectively minimizing potential interference from other AD-related markers in the system and ensuring the accuracy of the test results.
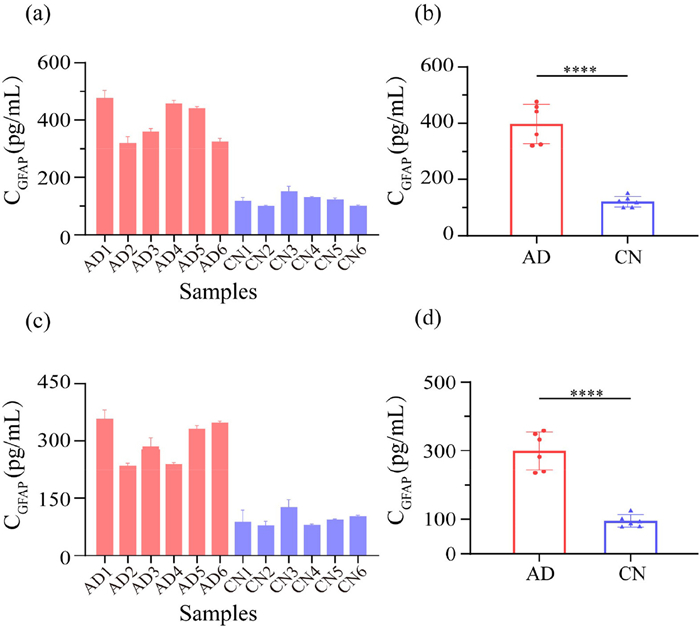
To validate the clinical utility and reliability of the sensor for detecting GFAP in serum samples from AD patients. Twelve clinical serum samples, comprising six from AD patients and six cognitively normal (CN) control samples, were analyzed with the proposed sensor. As shown in Fig. 4, the GFAP concentrations in serum were significantly elevated in the AD group compared to the CN group. Detailed assay results (Table S7 in Supporting information) revealed the GFAP concentrations ranged from 88 pg/mL to 127 pg/mL in CN samples and from 235 pg/mL to 358 pg/mL in AD samples. These findings align with previous reports in the literature [11], which indicate that serum GFAP levels are significantly elevated in AD patients. Furthermore, a pearson's correlation analysis (Fig. S9 in Supporting information) demonstrated a strong correlation (R = 0.9989, P < 0.0001) between the results obtained with our method and those obtained using a commercial GFAP ELISA kit.
In conclusion, the aptamer against target GFAP was identified for the first time through 11 rounds of selection by MB-SELEX technology. The selected aptamer Apt1 exhibited excellent binding affinity and specificity toward GFAP, with a dissociation constant of 0.621 µmol/L. Molecular dynamics simulations revealed that Apt1 possesses multiple interaction sites distributed along the GFAP polypeptide chain, supporting its potential as a robust recognition element for the sensor development.
Combined with dual isothermal amplification (EXPAR and HCR), the selected aptamer had been adopted to develop fluorescence sensor for highly sensitive GFAP detection. Under optimized experimental conditions, the sensor demonstrated a wide linear detection range spanning from 10 pg/mL to 10 µg/mL, along with an exceptionally low detection limit of 0.24 pg/mL. The quantification of GFAP in serum samples demonstrated a strong correlation with the results obtained using a commercially available ELISA kit (R = 0.9989, P < 0.0001), confirming the accuracy and reliability of the method for GFAP analysis in serum.
This study not only represents the first successful identification of a GFAP-specific aptamer but also introduces a fluorescence-based approach for quantitative GFAP detection. Of note, there are some limitations in this study. First, the EXPAR-HCR system requires a controlled enzymatic reaction, which not only increases the cost but also limits its applicability in large-scale screening. Additionally, this study lacks sample validation across different stages of AD, and further validation of our results would necessitate an expanded sample size. As a proof-of-concept study, we were unable to address all the challenges encountered in this preliminary work. However, our study aims to present a promising perspective by using aptamer technology to detect GFAP and developing an economical, high sensitivity and stability platform for the early diagnosis of AD.
Human serum specimens were collected from volunteers at Hospital 900 of PLA Joint Logistics Support Force, Fuzhou, China. This study complied with the tenets of the Helsinki Declaration and was approved by the Local Ethics Committee of the 900th Hospital of the China Joint Security Force (initial approval date: December 27, 2024, IRB number 2024–057). Written informed consent has been obtained from the volunteers to publish this paper.
The authors declare that they have no known competing financial interests or personal relationships that could have appeared to influence the work reported in this paper.
Yue Cao: Writing – original draft, Methodology, Investigation, Conceptualization. Yue Lin: Writing – review & editing, Writing – original draft. Li Chen: Writing – review & editing, Methodology. Huimin Niu: Writing – review & editing. Renli Wei: Data curation. Shuqian Qiu: Methodology, Investigation. Anjie Wang: Validation, Investigation. Xiaoai Cao: Validation, Investigation. Xiaofeng Lai: Resources. Yongshou Chen: Resources. Juanjuan Lin: Resources. Shuiliang Wang: Funding acquisition, Formal analysis. Zhenyu Lin: Writing – review & editing, Conceptualization. Shenghang Zhang: Supervision, Project administration, Funding acquisition.
This work was supported by the Key Laboratory of Aptamers Technology (No. 2019ZDSYS0101), the Natural Science Foundation of Fujian Province of China (No. 2023J011345), Joint Funds for the innovation of science and Technology, Fujian province (Nos. 2023Y9267, 2024Y9660), National filing science and technology project (No. 2024L3020), and 900 Hospital of the People's Liberation Army Joint Logistic Support Force (Nos. 2023QN09, 2023XKJY02). The figures in this work were created with BioRender.com.
Supplementary material associated with this article can be found, in the online version, at doi:
Y.H. Chou, M. Sundman, V. Ton That, J. Green, C. Trapani, Ageing Res. Rev. 79 (2022) 101660.
F. Shue, L.J. White, R. Hendrix, et al., Sci. Adv. 10 (2024) eadk3674. doi: 10.1126/sciadv.adk3674
A.P. Skaria, Am. J. Manag. Care 28 (2022) S188–S196. doi: 10.37765/ajmc.2022.89236
P.S. Aisen, G.A. Jimenez-Maggiora, M.S. Rafii, S. Walter, R. Raman, Nat. Rev. Neurol. 18 (2022) 389–399. doi: 10.1038/s41582-022-00645-6
S.L. Oh, M. Zhou, E.W.M. Chin, et al., Front. Digit. Health. 4 (2022) 875–895. doi: 10.1080/15256480.2021.1881938
L. Feng, J. Li, R. Zhang, Ageing Res. Rev. 72 (2021) 101492.
F.H. Duits, P. Martinez-Lage, C. Paquet, et al., Alzheimers. Dement. 12 (2016) 154–163. doi: 10.1016/j.jalz.2015.08.003
P.K. Mandal, J.C. Maroon, A. Garg, et al., ACS Chem. Neurosci. 14 (2023) 3975–3978. doi: 10.1021/acschemneuro.3c00641
L.F. Eng, R.S. Ghirnikar, Y.L. Lee, Neurochem. Res. 25 (2000) 1439–1451. doi: 10.1023/A:1007677003387
K. Venkatesh, L. Srikanth, B. Vengamma, et al., Neurol. India 61 (2013) 383–388. doi: 10.4103/0028-3886.117615
P. Oeckl, S. Anderl-Straub, C.A.F. Von Arnim, et al., J. Neurol. Neurosurg. Psychiatry. 93 (2022) 659–667. doi: 10.1136/jnnp-2021-328547
H. Stocker, L. Beyer, L. Perna, et al., Alzheimers. Dement. 19 (2023) 25–35. doi: 10.1002/alz.12614
X.N. Shen, S.Y. Huang, M. Cui, et al., Clin. Chem. 69 (2023) 411–421. doi: 10.1093/clinchem/hvad018
Y. Tang, L. Han, S. Li, et al., NPJ. Parkinsons Dis. 9 (2023) 23. doi: 10.54691/tyqgy237
J. Wang, J. Wang, W. Xie, et al., Int. Immunopharmacol. 116 (2023) 109761. doi: 10.1016/j.intimp.2023.109761
Y. Xu, T. Chen, J. Sun, J. Liu, Anal. Chim. Acta 1039 (2018) 31–40.
W. Guo, C. Zhang, T. Ma, et al., J. Nanobiotechnology 19 (2021) 166. doi: 10.5428/pcar20210302
E. Beke, C. Gondran, B. Chovelon, et al., Biosens. Bioelectron. 278 (2025) 117306.
Y. Wang, X. Liu, L. Wu, et al., Biosens. Bioelectron. 195 (2022) 113661.
Z. Huang, D. Wang, Q. Zhang, et al., Acc. Mater. Res. 5 (2024) 438–452. doi: 10.1021/accountsmr.3c00249
M. Shoaib, H. Li, M. Zareef, et al., J. Agric. Food Chem. 73 (2025) 4397–4424. doi: 10.1021/acs.jafc.4c06338
P. Boonbanjong, K. Treerattrakoon, W. Waiwinya, P. Pitikultham, D. Japrung, Biosensors 12 (2022) 677. doi: 10.3390/bios12090677
X. Ou, K. Li, M. Liu, et al., Analyst 149 (2024) 4135–4157. doi: 10.1039/d4an00609g
J. Van Ness, L.K. Van Ness, D.J. Galas, Proc. Natl. Acad. Sci. U. S. A. 100 (2003) 4504–4509.
R.M. Dirks, N.A. Pierce, Proc. Natl. Acad. Sci. U. S. A. 101 (2004) 15275–15278.
J. Wu, J. Lv, X. Zheng, Z.S. Wu, Talanta 234 (2021) 122637.

Figure 1 Monitoring the screening process. (a) Affinity analysis of library by flow cytometry. (b) ssDNA pool recovery after each round of SELEX.

Figure 2 Principle of GFAP fluorescent sensor based on target-induced cDNA dissociation triggering EXPAR and HCR.

Figure 3 Performance of the proposed fluorescence sensor. (a) Fluorescence response upon the addition of varying concentrations of GFAP. (b) The linear correlation between ΔF and the logarithmic concentration of GFAP. Error bars represent ± SD of three independent experiments. (c) Five replicate fluorescence intensity measurements obtained from 100 ng/mL GFAP. (d) Selectivity of the assay (the concentration of BSA, Hcy, Aβ, Tau, NRGN, NfL, S100β were 1 µg/mL, the concentration of GFAP was 100 ng/mL). Error bars represent ± SD of three independent experiments.

Figure 4 Determination of GFAP concentration in serum from CN individuals and AD patients. (a) Quantification of GFAP concentration based on the ELISA method and (c) EXPAR-HCR method. (b) Statistical analysis of serum GFAP levels in AD and CN patients based on the ELISA method and (d) EXPAR-HCR method. Each serum sample was tested in three independent replicates (****P < 0.0001). Error bars represent ± SD of three independent experiments.

 扫一扫看文章

扫一扫关注我们
 DownLoad:
 下载:
下载:
 下载:
下载: