
Figure 1.
(a) Schematic illustration of TMSA function in LiMn0.60Fe0.40PO4ǁLi cell. (b) Comparison of carbon layer and electrolyte interface evolution after cycling in baseline and 0.5% TMSA electrolytes.

Multifunctional silane additive realizing electrolyte stabilization and hierarchic interface formation for LiMn0.60Fe0.40PO4 cathode materials
Wenhui Tu , Yuanpeng Cao , Xianshu Wang , Bo Liao , Xiaoyu Ding , Junru Wu , Xiangshao Yin , Zhuo Zhou , Yuanyuan Huang , Runlin Li , Xinyu Zhang , Chao Zhao , Peng Dong , Yingjie Zhang , Ding Wang , Xuerui Yang , Jianguo Duan


The ever-growing energy density and high-safety use demand in the realm of lithium-ion batteries (LIBs) urges the development of new material and battery systems [1–3]. Lithium manganese iron phosphate (LiMnxFe1-xPO4, abbreviated as "LMFP") as an iterative upgrade of widespread lithium iron phosphate (LiFePO4) is known for their exceptional energy density, commendable safety and stable Li+ high-intercalation potential plateau of 4.1 V (vs. Li/Li+) [4–7]. Nevertheless, the inherent deleterious effect of Mn element involving Jahn-Teller distortion of Mn3+ and the sluggish kinetics of Mn2+/Mn3+ reaction, lead to the weak structural stability and reversibility of material and the low electronic conductivity (< 10–10 S/cm) and ionic diffusivity (< 10–16 cm2/s), thereby posing formidable challenges to fully realize the theoretical performance of LMFP [8,9].
Currently, the majority of modification strategies for LMFP can be categorized as elemental doping [10–12] with heterogeneous ions (Mg2+ [13,14], V3+ [15,16], Ti4+ [17,18], Co2+ [19], etc.), nano-crystallization controlling nanoparticles granularity and size [20], and surface modification with amorphous carbon coating [21,22]. Among them, carbon coating can provide the fast charge transport [23] and is conducive to capacity delivery of battery, known as the facile, low-cost and large-scale method for LMFP applications. Such a carbon layer is encapsulated on the surface of cathode material, effectively preventing active substance from being directly exposed to the electrolyte, which reduces the occurrence of side reactions and transition-metal dissolution to some extent. However, the first concern on whether this pretreated carbon layer can accommodate the volume expansion and contraction during battery charging/discharging and thoroughly repulse the high activity of electrolyte arises. For another, the fact of whether its appearance can affect the formation of cathode electrolyte interface (CEI) on LMFP cathode materials is always ignored, as well as the mergence of CEI and carbon layer that leads to a weak protective response. Both of them will incur the susceptible lifespan for LMFP battery.
Besides, the unsatisfactory performance of LMFP cathode material also suffers from the high reactivity of electrolyte at high-voltage cathode surface. In the conventional carbonate formula with lithium hexafluorophosphate (LiPF6) as salt, the as-formed CEI on cathode is too weak to make a guarantee for stopping electrolyte penetration and subsequent consumption, then expediting the capacity decay. Meanwhile, it is well-known that acid byproducts, typically HF, generates in, especially after thermal storage, deriving from the thermal decomposition and hydrolysis of LiPF6. HF in the electrolyte can corrode the bulk materials and CEI components, but also accelerate the disproportionation reaction of Mn3+ to form Mn2+ and Mn4+ [24]. This dissoluble Mn2+ can enter into the electrolyte (namely Mn dissolution) and then diffuse to anode side, thereby catalyzing and aggravating the parasitic reactions and leading to the vigorous growth in internal resistance and battery failure [25]. The Mn4+ is insoluble but attaches with the surface of cathode material, resulting in Li+ transmitting interference. These inherent constraints present great challenges that necessitate innovative solutions to motivate the full potential of LMFP in advanced LIBs.
Electrolyte additives represent the most economically viable and effective approach to enhancing battery performance, which has the advantages of low dosage and precise targeting [26–28]. And there are scant reports regarding to LMFP modification from the view of electrolyte additive. Consequently, it is worthy to be expected and highly desirable that the development of a multifunctional additive compatible with LMFP cathode materials holds important research significance. In this context, we innovatively designed a multifunctional additive, (trimethylsilyl)methyl acetate (TMSA), into the electrolyte addressing the intrinsic interfacial limitations of LiMn0.60Fe0.40PO4, which significantly improved the electrochemical performances of batteries. As expected, TMSA takes precedence in oxidative decomposition to compose CEI ingredients, attached on the carbon layer to formulate the twin-stage interface. With this, the expansion and contraction of LiMn0.60Fe0.40PO4 structure is relieved, as well as electrolyte decomposition, leading to the enhancement of structure stability. In addition, this additive has the ability to coordinate with HF and proton, leading to stabilizing electrolyte even under thermal storage and restraining the dissolution of transition-metal ion. Therefore, LiMn0.60Fe0.40PO4ǁLi cell with 0.5 wt% TMSA-containing electrolyte provides the facilitated Li+ migration and significantly improved electrochemical performances. Our work involves electrolyte additive design that can stabilize electrolyte and innovate interface formation to strengthen LiMn0.60Fe0.40PO4 cathode material, showing the valuable and promising insights for advanced LIBs.
LiPF6 is the most widely used lithium salt, due to its excellent electrochemical stability, wide electrochemical window, and superior ionic conductivity [29,30]. However, it has a significant drawback in inferior thermal stability, rendering it susceptible to thermal decomposition even at room temperature and generating PF5, which can hydrolyze to produce HF. Moreover, LiPF6 is extremely sensitive to water and prone to generate HF in the presence of H2O [31,32]. The presence of HF exerts a profound impact on the stability of cathode materials, being widely acknowledged as the predominant factor behind the dissolution [33,34]. Under HF attacking and the intrinsic Jahn-Taller distortion, Mn dissolution from bulk material into electrolyte often occurs. However, the carbonate electrolyte with 0.5 wt% TMSA addition (marked as "0.5% TMSA") is capable of eliminating HF, neutralizing protons, and forming a uniform and stable CEI layer that inhibits electrolyte decomposition and transition-metal dissolution (Fig. 1a). In the conventional carbonate electrolyte (marked as "baseline"), cycling induces the combination of electrolyte by-products with the carbon coating layer (yellow part), forming a composite interface (denoted in green). However, this mixture fails to effectively suppress electrolyte decomposition and volume changes during charging/discharging, leading to capacity decay and triggering premature battery failure (Fig. 1b). For comparison, 0.5% TMSA electrolyte provides the HF remove and proton stabilization and creates a dual-layer interface consisting of lossless carbon layer (yellow part) and uniform CEI (blue layer), which minimizes direct contact between electrolyte and cathode, thereby mitigating transition-metal dissolution and enhancing structural integrity and battery performances. Thereinto, the addition of 0.5% TMSA to the baseline electrolyte yields the best electrochemical performance, therefore, the following evaluation will mainly focus on the most optimal 0.5% TMSA electrolyte in the main text.
Fig. 2a shows the schematic illustration of the reaction mechanism of TMSA. TMSA with a trimethylsilyl group, can react with HF to form trimethylfluorosilane (TMFS) and methyl acetate, thus significantly playing an elimination role. In order to verify the thermal ability of electrolyte, we placed the as-configured baseline and 0.5% TMSA electrolytes into a vacuum oven for 11 days' storage at 60 ℃ to observe the color change of the electrolytes. As shown in Fig. 2b, we conducted pH paper tests on baseline and 0.5% TMSA electrolytes, both of them show a neutral pH of 7 before thermal storage (compared with the standard chart for pH indicator paper in Fig. S1 in Supporting information). After 11 days, it is observed that the baseline has changed from the pristine transparency to light brown with a pH of 2.47. The shifts in coloration and acidity suggest the occurrence of chemical reactions over time, as well as the release of acidic compounds within electrolyte. Of necessity, it is primarily attributed to the hydrolysis and pyrolysis of LiPF6. In contrast, the 0.5% TMSA electrolyte remains virtually colorless, with a pH of 4.48. Such visual observation and test confirm that as-optimized TMSA molecules effectively erase HF and reduce the acidity of electrolyte, which can inflict heavy losses on the transition-metal [35,36]. To further substantiate this, the nuclear magnetic resonance (NMR) was employed to detect 13C and 19F spectra of the baseline and 0.5% TMSA electrolytes before and after storage at 60 ℃ for 11 days (Figs. 2c and d, Fig. S2 in Supporting information). It is seen from the 19F spectra before storage (Figs. S2a and b), both the baseline and 0.5% TMSA electrolytes have a weak peak at −190 ppm, representing the slight formation of HF, which derives from the decomposition of LiPF6 during electrolyte preparation [37]. After storage at 60 ℃ for 11 days, the HF content shows a sustainable growth in the baseline electrolyte, leading to the dilated HF peak intensity (Fig. 2c). By comparison, in the 0.5% TMSA electrolyte, HF signal cannot be detected within the given range, instead, a new peak appeared at −156.5 ppm, which indexes the formation of TMFS molecules (Fig. 2d). This is further corroborated by the 13C NMR spectra, which shows a peak at −4 ppm that cannot be observed in the baseline (Figs. S2e and f).
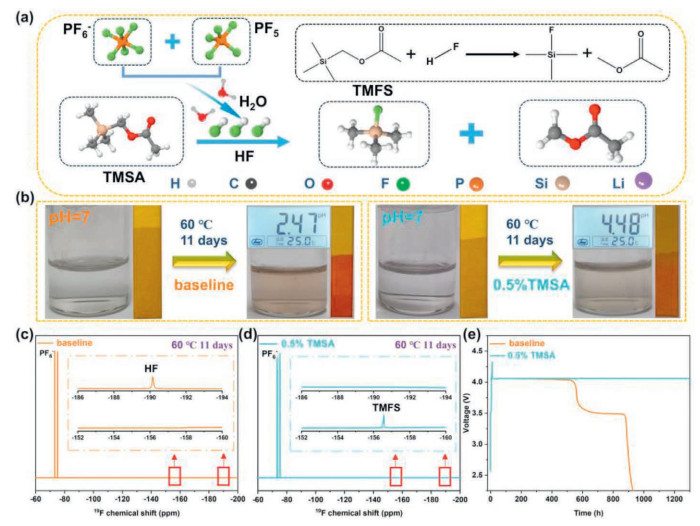
Furthermore, the voltage variation of fully charged LiMn0.60Fe0.40PO4ǁLi cells with the baseline and 0.5% TMSA electrolytes after 11 days' thermal storage at 60 ℃ was monitored to validate the TMSA effect (Fig. 2e). Upon reaching ~550 h, the LiMn0.60Fe0.40PO4ǁLi cell with baseline electrolyte commences voltage decline to the plateau at 3.5 V (vs. Li/Li+), which corresponds to Fe2+/Fe3+ redox [38,39]. As battery rest continues, this voltage usher the second dramatic decrease to zero around ~920 h. These indicates that full-charged LiMn0.60Fe0.40PO4 cathode material suffers from serious electrolyte corrosion, leading to significant self-discharge behavior. By contrast, the LiMn0.60Fe0.40PO4ǁLi cell with 0.5% TMSA electrolyte maintains a consistent voltage of 4.05 V throughout the observation period, indicating an almost negligible self-discharge rate. This observation underscores the efficacy of 0.5% TMSA electrolyte in eliminating HF, thereby enhancing the material stability and long-term storage capability of battery.
To further clarify the availability of TMSA to coordinate HF and proton (H+), the theoretical calculations using density functional theory (DFT) were performed to compute the optimized structures and binding energies (Eb) of EC, EMC, and TMSA with HF respectively. As illustrated in Fig. 3a, the lowest Eb value of −41.894 kJ/mol is observed for the interaction between TMSA and HF (TMSA-HF) as compared with the Eb of HF and ethyl carbonate (EC—HF, −36.774 kJ/mol) and ethyl methyl carbonate (EMC—HF, −34.571 kJ/mol), indicating that TMSA has the highest propensity to bind with HF, which also affirms that TMSA can be as a potential scavenger of HF. Further, TMSA molecule can also trap the proton, which is well-known as the accelerator of electrolyte decomposition and gas evolution [40]. It can be found that the binding energies of H+ and EC and EMC are estimated as −618.666 and −615.679 kJ/mol (Fig. 3b), respectively. By contrast to them, a lowest value is achieved in binding energy of TMSA and H+, further confirming the cleaning effect of TMSA towards the proton.
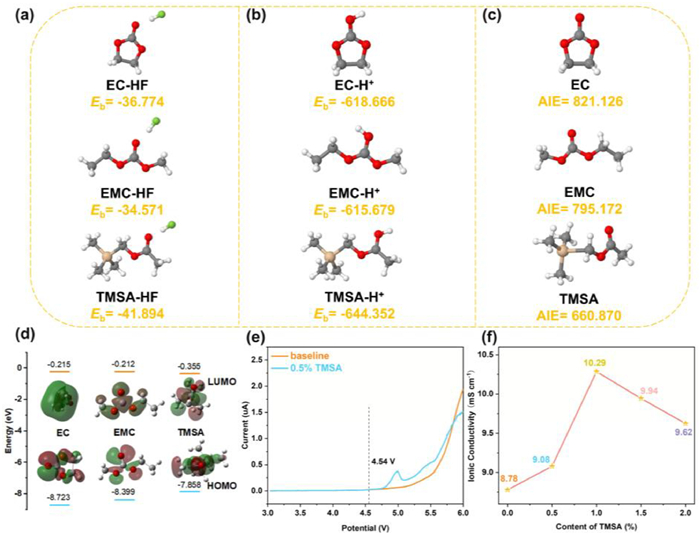
The ionization energies (AIE) were evaluated using DFT calculations to characterize the oxidative reactivities of TMSA and the solvents (Fig. 3c and Fig. S3 in Supporting information). The AIE of TMSA is 660.870 kJ/mol, which is much lower than that of EC (821.126 kJ/mol) and EMC (795.172 kJ/mol), showing that TMSA is more easily oxidized than solvent. Especially, after coordinating with HF, F- or H+, the TMSA molecule still sustains the lower AIE as compared to carbonate solvent. This reveals that TMSA can hold the ability of preferential oxidation either before or after eliminating HF and proton, which supports the construction of an interfacial protective film on cathode material [41]. Accordingly, we conducted the calculation of highest occupied molecular orbital (HOMO) and lowest unoccupied molecular orbital (LUMO) on EC, EMC, and TMSA molecules to further confirm this behavior. As illustrated in Fig. 3d, the highest HOMO energy of −7.858 eV is found for TMSA (vs. −8.723 eV for EC and −8.399 eV for EMC), indicating the propensity of TMSA to oxidize prior to solvents. Thus, TMSA can precedes the solvents in the formation of a protective CEI film on the LiMn0.60Fe0.40PO4 cathode material. To delve into the feasibility of electrochemical oxidation of TMSA, we employed linear sweep voltammetry (LSV) to validate the electrolytes. It is evident that the electrolyte containing 0.5% TMSA begins to oxidatively decompose around ~4.5 V (Fig. 3e), earlier than the baseline electrolyte, confirming its preferential oxidative feature, which is in agreement with the previous calculations. With the increase of TMSA content in electrolyte to 2.0% one by one, this oxidative current density becomes gradually higher, revealing the measurable oxidation of TMSA as well (Fig. S4 in Supporting information). Such a similar increase can be harvested in the measurement of ionic conductivity, which is a critical parameter for assessing the ionic transport capability in the electrolyte [42]. It is seen that the ionic conductivity electrolyte boosts after TMSA addition (Fig. 3f), which may be attributed to an accelerated Li+ diffusion rate.
To further elucidate the structural and compositional changes of as-formed CEI on LiMn0.60Fe0.40PO4 cathode, a comprehensive analysis via scanning electron microscopy (SEM), transmission electron microscope (TEM), X-ray photoelectron spectroscopy (XPS) and time-of-flight second ion mass spectroscopy (ToF-SIMS) was conducted before and after 150 cycles. It is abundantly clear that the fresh LiMn0.60Fe0.40PO4 cathode material predominantly consists of spherical nanoparticles (Fig. 4a). Following 150 cycles in the baseline electrolyte, the particles exhibit agglomeration, with a notable deposition of thick by-products from electrolyte decomposition on the cathode surface (Fig. 4b). This phenomenon intensifies the interfacial resistance and hinders the effective shuttle of Li+ ions, resulting in the battery capacity loss and the decline in cycle stability. Conversely, in the 0.5% TMSA electrolyte, the LiMn0.60Fe0.40PO4 cathode material preserves its original morphology of spherical nanoparticles, without any discernible by-products of electrolyte decomposition attaching on the surface (Fig. 4c).
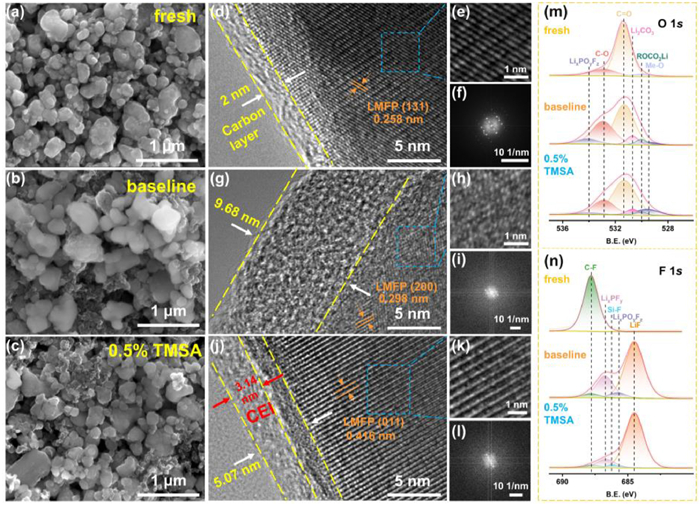
Furthermore, TEM images reveal the formed hierarchic interface in the 0.5% TMSA electrolyte. Firstly, the fresh cathode material is enveloped by an amorphous carbon layer with a thickness of ~2 nm. And the distinct lattice fringes and a calculated lattice spacing of 0.258 nm (Fig. S5a in Supporting information), belonging to the LMFP (131) lattice plane, were detected in the pristine LMFP particle (Figs. 4d-f). After cycling, in the baseline electrolyte, this formed interface layer on the surface of cathode material is enhanced to as high as 9.68 nm, significantly thicker than the original carbon layer. Noted that no boundary can be found between amorphous carbon and electrolyte byproducts, which is ascribed to the mergence of electrolyte by-products and carbon layer. This symbols that the carbon layer happens to crack during Li+ intercalation/deintercalation, leading to electrolyte infiltration and oxidative decomposition. Such a thick and integrated cladding directly affects the pathway and velocity for Li+ transport, thereby reducing the rate capacity and cycling stability of battery. And the newly generated compounds are mixed with carbon layer, which can disrupt its charge distribution and electronic conductivity, further exacerbating performance. Besides, the partial blurring of the lattice fringes in the cathode material after cycling indicates lattice distortion during electrochemical processes, which increases interfacial energy, disrupts free energy balance, and weakens structural stability [43–45]. This leads to significant dissolution of transition-metal from bulk, leaving only residual indistinct fringes corresponding to the LMFP (200) lattice planes with a spacing of 0.298 nm (Figs. 4g-i and Fig. S5b in Supporting information). In contrast, the cycling for 150 cycles in 0.5% TMSA electrolyte results in a film with the thickness of 5.07 nm on the surface of LiMn0.60Fe0.40PO4 cathode material. It is inclusive of a thin, dense, and uniform interfacial protective layer approximately 3.14 nm in thickness at outer and the original carbon layer at inner due to the intrinsic electronic conductivity of carbon layer leading to the direct oxidation and deposition. And TEM image exhibits the clear lattice fringes with a spacing of 0.416 nm, belonging to the LMFP (011) lattice plane (Figs. 4j-l and Fig. S5c in Supporting information). This structural integrity is attributed to the moderate preferential oxidation of the 0.5% TMSA additive, which facilitates the formation of a robust and thin CEI on the carbon layer. By regulating the interfacial processes, the 0.5% TMSA electrolyte additive effectively suppresses cathode material dissolution, thereby enhancing the structural stability, avoiding obstruction of Li+ transport channels, and ensuring rapid Li+ transport [46].
XPS analyses were conducted on the LiMn0.60Fe0.40PO4 cathode material before cycling and after 150 cycles in the baseline and 0.5% TMSA electrolytes to offer insights into the chemical composition of interfaces under different electrolyte conditions. In the C 1s spectra, two novel characteristic peaks emerge in the LiMn0.60Fe0.40PO4 cathode with baseline electrolyte (Fig. S6a in Supporting information), which is absent in the fresh cathode. Notably, the intensity of ROCO2Li (289.31 eV) and Li2CO3 (290.42 eV) peaks is significantly reduced in the 0.5% TMSA electrolyte, alongside the appearance of a C-Si bond (284.31 eV). These observations substantiate the role of TMSA in CEI formation and its efficacy in curtailing the oxidative decomposition of carbonate. The intensities of peaks attributing to ROCO2Li (530.04 eV), Li2CO3 (530.68 eV), and LixPOyFz (533.99 eV) in O 1s spectra are greater for the baseline electrolyte than that for 0.5% TMSA electrolyte (Fig. 4m). Conversely, the higher intensity of Metal-O (529.58 eV) peak is detected in the presence of TMSA, which indicates that TMSA facilitates the formation of a thinner CEI film. In the F 1s spectra, the fresh cathode shows a strong C-F peak (687.8 eV) originating from polyvinylidene fluoride (PVDF) binder residue, which diminishes after cycling [47,48]. The intensities of peaks associate with LiF (684.47 eV), LixPOyFz (685.64 eV), and LixPFy (686.66 eV) in the baseline electrolyte are higher than in the 0.5% TMSA electrolyte (Fig. 4n), which is ascribed to the LiPF6 decomposition. And the newly-formed Si-F (686.2 eV) in the 0.5% TMSA electrolyte associates with the formation of TMFS species, which is also reflected in the Si 2p spectra (Fig. S6f in Supporting information), consistent with the NMR characterizations. Within the P 2p spectra, the peaks situating at 136.17 and 133.47 eV correspond to LixPFy and LixPOyFz (Fig. S6b in Supporting information), respectively, stemming from the decomposition of LiPF6. While the peaks at 133.03 and 133.96 eV are attributed to the P 2p3/2 and P 2p1/2 components of PO43-. In the Li 1s spectra, there is an observable diminution in the whole peak intensity (Fig. S6c in Supporting information). The Mn 2p reveals the emergence of Mn3+ (642.85 and 654.07 eV) in the cathode after 150 cycles, and the Fe 2p spectrum exhibits the presence of Fe3+ (710.90 and 723.91 eV) (Figs. S6d and e in Supporting information). These could potentially be attributed to the dissolution of transition-metal from the cathode during cycling. Notably, the intensities of Mn 2p and Fe 2p peaks are greater in the electrode cycled with the baseline electrolyte as compared to that with 0.5% TMSA electrolyte, signifying that the as-from CEI from TMSA can effectively mitigate the dissolution of transition-metal. This suppression is crucial in maintaining cathode integrity and enhancing the electrochemical performance of battery.
Fig. 5a and Fig. S7 (Supporting information) depict the time-of-flight secondary ion mass spectrometry (ToF-SIMS) analyses of the LiMn0.60Fe0.40PO4/C cathode material after cycling, providing the information of structure and chemistry of as-formed CEI layer. The 3D spatial distribution maps reveal the presence of LiF-, CO32-, PO2F2-, C2HO-, CHO2-, LiCO3-, PO3F2-, MnF3- and FeF3- components in the cathode materials with baseline and 0.5% TMSA electrolytes. It is noted that the LiMn0.60Fe0.40PO4 cathode material cycled in the baseline electrolyte exhibits heightened signals of LiF-, PO2F2- and PO3F2-, which can be attributed to the decomposition of lithium salts. Additionally, this electrode surface is covered by more organic by-products such as CO32-, C2HO-, CHO2- and LiCO3-, indicating that the interface formed in carbonate cannot generate a stable interfacial film to mitigate the continuous oxidative decomposition of electrolyte. On the contrary, the weaker signal strengths of these by-products are observed in the cathode with 0.5% TMSA electrolyte, suggesting that the as-established CEI declines electrolyte decomposition and maintains the good ion transport efficiency. Moreover, the substantially diminished signal of MnF3- and FeF3-, confirms the efficacy of TMSA-induced CEI in mitigating transition-metal dissolution and inhibiting its deposition on the LiMn0.60Fe0.40PO4 cathode material. This effect can be further exposed in the side of anode, where the dissolved and diffused transition-metal deposit. As shown in Fig. 5b, the contents of transition-metal Fe and Mn ions on the lithium metal surface are 7.214 and 3.084 ppm for baseline, respectively. While in the 0.5% TMSA electrolyte, their contents are reduced to 4.664 ppm and 1.069 ppm, respectively. This markedly lower presence suggests the suppression of metal dissolution and the protection of material structure during charging/discharging process.
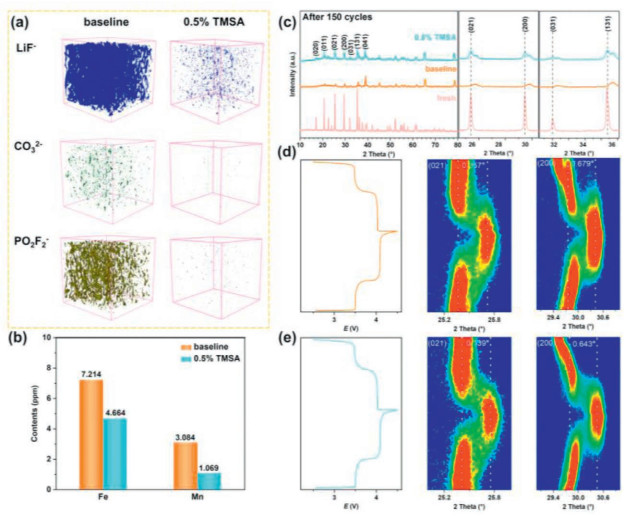
The XRD characterizations of LiMn0.60Fe0.40PO4 cathode material before and after cycling elucidate the alterations in its crystalline structure throughout the cycling process, which is pivotal for gaining deeper understanding on the structural integrity and performance degradation upon repeated charging/discharging cycling. Comparative analysis of XRD patterns reveal a notable diminution in the whole peak intensity for LiMn0.60Fe0.40PO4 cathode material after cycling in the baseline electrolyte as opposed to that in the presence of TMSA (Fig. 5c), especially in the amplified angle area between 24.5°−30.5° and 31.2°−36.1°. These characteristic peaks correspond to (021), (200), (031) and (131) lattice planes in the baseline electrolyte, respectively, which are conspicuously absent and coupled with the emergence of a de-lithiated phase, suggesting the potential dissolution of transition-metal ions and phase transformations. By contrast, taking the similar Al foil diffraction peaks as reference (Fig. S8 in Supporting information), the peaks of cathode material cycled with 0.5% TMSA align closely with those of the pristine material, exhibiting no significant shifts, indicative of the enhancement of material stability imparted by TMSA. Further, in situ X-ray diffraction (XRD) analyses were carried out on electrodes with the baseline and 0.5% TMSA electrolytes to reveal this effect (Figs. 5d and e, Fig. S9 in Supporting information). By monitoring the intensity variations of typical diffraction peaks, insights can be gained into the stability and its sustainable capacity of LiMn0.60Fe0.40PO4 cathode material during cycling. Notably, compared with the baseline electrolyte, the extent of angular shifts in the presence of 0.5% TMSA is markedly diminished based on the observation for (021) and (200) peaks. This reduced tendency towards partial solid solution phase transitions is conducive to enhance structural stability. These findings affirm that the addition of TMSA exerts a protective influence on LiMn0.60Fe0.40PO4 cathode material by forming a protective CEI, thereby safeguarding the structural integrity and contributing to its improved electrochemical performance and longevity.
The electrochemical performances were evaluated in the LiMn0.60Fe0.40PO4ǁLi cells. The lithium-ion transport kinetics during the electrochemical redox processes of LiMn0.60Fe0.40PO4ǁLi cells were checked using cyclic voltammetry (CV) in the baseline and 0.5% TMSA electrolytes. Fig. S10 (Supporting information) displays the CV curves of LiMn0.60Fe0.40PO4ǁLi cells at 0.1 mV/s for first five cycles in the baseline and 0.5% TMSA electrolytes, the two prominent pairs of redox peaks are observed, corresponding to the reversible transitions of Fe3+/Fe2+ and Mn3+/Mn2+, respectively, which reflects on the Li+ intercalation and deintercalation processes. In comparison with baseline electrolyte, it can be seen that the redox peaks for the cell with 0.5% TMSA electrolyte exhibits superior symmetry, indicating the enhanced reversibility during cycling. Fig. S11 (Supporting information) shows the CV curves of LiMn0.60Fe0.40PO4ǁLi cells in both electrolytes at different scanning rates. By leveraging the linear relationship between the peak current
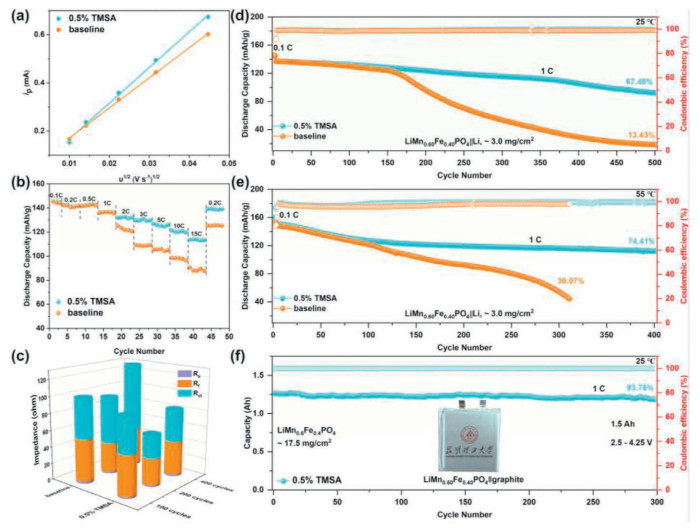
Upon incorporating the additive TMSA into the electrolyte, a significant improvement of the cycling performance becomes evident, particularly when imputing 0.5% TMSA into the baseline electrolyte, which can offer an optimal capacity retention. As shown in Fig. 6d, at room temperature of 25 ℃, the cell with 0.5% TMSA electrolyte can contribute to the high specific capacity of 136.83 mAh/g at 1 C for the first cycle, and sustain a good capacity retention of 67.46% after 500 cycles with an average Coulombic efficiency of 99.67%. Conversely, the precipitously declined discharge capacity after 150 cycles is recorded in the cell with baseline electrolyte, leading to a mere 13.43% capacity retention within 500 cycles. Such a pronounced degradation rate is highly relative to the structure damage and irreversible loss of active material, accompanying with the terrible electrolyte decomposition. In terms of the excessive additives, the cells with them only keep the stable cycling until 200–250 cycles, which may be due to the overmuch decomposition of TMSA boosts the interfacial resistance of LiMn0.60Fe0.40PO4ǁLi cells, leading to the diminishment in cycling stability and capacity for battery (Fig. S14 in Supporting information). The charging/discharging profiles with different electrolyte conditions further reveal the superiority of 0.5% TMSA electrolyte (Fig. S15 in Supporting information). Even under high-temperature conditions at 55 ℃, the 0.5% TMSA electrolyte can still demonstrate the remarkable cycling performance (Fig. 6e and Fig. S16 in Supporting information). The discharge specific capacity of cells can be up to 160.0 and 150.8 mAh/g at 0.1 and 1 C rates, respectively. After 400 cycles, an impressive capacity retention as high as 74.41% is achieved, while the LiMn0.60Fe0.40PO4ǁLi cells using baseline electrolyte only delivers a retention of 30.07% within 300 cycles. To further evaluate the practicability of TMSA additive, the cycle performance of LiMn0.60Fe0.40PO4ǁgraphite pouch cell was tested in the voltage of 2.5–4.25 V (vs. Li/Li+) (Fig. 6f). Impressively, LiMn0.60Fe0.40PO4ǁgraphite pouch cell delivers an capacity of 1.26 Ah at 1 C and retains a 93.76% capacity after 300 cycles with stable coulombic efficiency of ≥ 99.9% under 25 ℃, confirming the potential of TMSA additive in lithium-ion battery applications. Clearly, the addition of TMSA facilitates the formation of a thin, protective CEI film, which serves to inhibit the dissolution of transition-metal and electrolyte degradation and protect the structural stability of cathode material, thereby significantly enhancing the electrochemical performances of LiMn0.60Fe0.40PO4-based cells.
In conclusion, we propose a novel electrolyte additive TMSA, which can not only coordinate with HF and proton to stabilize electrolyte but also facilitate the formation of hierarchic interface on cathode with the help of pristine carbon layer, to significantly enhance the electrochemical performances of LiMn0.60Fe0.40PO4. Such the favorable effects enable electrolyte with the reduced acidity and aggressivity towards cathode materials and are potentially free from electrolyte decomposition and the dissolution of transition-metal ions, as demonstrated by the theoretical calculations and comprehensive testing analysis. Based on this idea, the 0.5% TMSA electrolyte endows the LiMn0.60Fe0.40PO4ǁLi cell with superior specific discharge capacities, capacity retentions at 25 ℃ and 55 ℃ and rate performance, as well as contributing to the fast Li+ kinetics for cathode. Our investigation focuses on the modification of LiMn0.60Fe0.40PO4 cathode materials from the perspective of electrolyte, illuminating a novel avenue to reconfigure the CEI film linking with conductive carbon layer and inspiring innovative understandings in the development of multifunctional electrolytes for advanced LIBs.
Wenhui Tu: Writing – review & editing, Methodology, Formal analysis, Data curation. Yuanpeng Cao: Software, Conceptualization. Xianshu Wang: Writing – review & editing, Project administration, Funding acquisition, Conceptualization. Bo Liao: Resources, Investigation. Xiaoyu Ding: Resources, Investigation. Junru Wu: Methodology, Investigation. Xiangshao Yin: Methodology, Investigation. Zhuo Zhou: Software. Yuanyuan Huang: Investigation. Runlin Li: Investigation. Xinyu Zhang: Investigation. Chao Zhao: Methodology. Peng Dong: Supervision, Conceptualization. Yingjie Zhang: Supervision, Funding acquisition, Conceptualization. Ding Wang: Supervision, Funding acquisition. Xuerui Yang: Supervision, Software, Methodology, Funding acquisition. Jianguo Duan: Validation, Supervision, Funding acquisition.
The authors declare that they have no known competing financial interests or personal relationships that could have appeared to influence the work reported in this paper.
This work was supported by the Yunnan Fundamental Research Projects (Nos. 202401AU070163 and 202401AT070368), the Yunnan Major Scientific and Technological Projects (No. 202202AG050003), the National Natural Science Foundation of China (Nos. 52162030 and 22309074), Natural Science Foundation of Jiangxi Province (Nos. 20232BAB214022 and 20242BAB25228), the Scientific Research Foundation of Kunming University of Science and Technology (No. 20220122), the Analysis and Test Foundation of Kunming University of Science and Technology (No. 2023T20220122), the Expert Workstation Support Project of Yunnan Province (No. 202505AF350019), the University Service Key Industry Project of Yunnan Province (No. FWCY ZD2024005), and the Expert Workstation Support Project of Yunnan Province (No. 202405AF140069).
Supplementary material associated with this article can be found, in the online version, at doi:
J. Zhou, C. Xing, J. Huang, et al., Adv. Energy Mater. 14 (2024) 2302761. doi: 10.1002/aenm.202302761
J. Meng, M. Lei, C. Lai, et al., Angew. Chem. Int. Ed. 60 (2021) 23256–23266. doi: 10.1002/anie.202108143
H. Huang, L. Kong, W. Shuang, et al., Chin. Chem. Lett. 33 (2022) 1037–1041. doi: 10.1016/j.cclet.2021.08.013
G. Fang, W. Chen, H. Yang, et al., Chin. Chem. Lett. 35 (2024) 108799. doi: 10.1016/j.cclet.2023.108799
V.G. Aravindan, Y.S. Lee Joe, S. Madhavi, J. Mater. Chem. A 1 (2013) 3518–3539. doi: 10.1039/c2ta01393b
Q. Hu, W. Wang, J. Lu, et al., Chin. Chem. Lett. 36 (2025) 110344. doi: 10.1016/j.cclet.2024.110344
I.M. Nwachukwu, A.C. Nwanya, A.B.C. Ekwealor, et al., J. Energy Storage 54 (2022) 35.
Y. Deng, C. Yang, K. Zou, et al., Adv. Energy Mater. 7 (2017) 1601958. doi: 10.1002/aenm.201601958
H. Gwon, D.H. Seo, S.W. Kim, et al., Adv. Funct. Mater. 19 (2009) 3285–3292. doi: 10.1002/adfm.200900414
S. Liu, J. Zheng, B. Zhang, et al., Chem. Eng. J. 454 (2023) 139986. doi: 10.1016/j.cej.2022.139986
M. Köntje, M. Memm, P. Axmann, et al., Prog. Solid State Chem. 42 (2014) 106–117. doi: 10.1016/j.progsolidstchem.2014.04.005
T.A. Wani, G. Suresh, J. Energy Storage 44 (2021) 103307. doi: 10.1016/j.est.2021.103307
F. Omenya, J.K. Miller, J. Fang, et al., Chem Mater. 26 (2014) 6206–6212. doi: 10.1021/cm502832b
M. Kotobuki, Y. Mizuno, H. Munakata, et al., Electrochemistry 79 (2011) 467–469. doi: 10.5796/electrochemistry.79.467
J. Zhang, X. Wang, B. Zhang, et al., Electrochim. Acta 180 (2015) 507–513. doi: 10.1016/j.electacta.2015.08.109
L. Wu, J. Lu, G. Wei, et al., Electrochim. Acta 146 (2014) 288–294. doi: 10.1016/j.electacta.2014.09.076
S. Zhang, Q. Wu, C. Deng, et al., J. Power Sources 218 (2012) 56–64. doi: 10.1016/j.jpowsour.2012.06.002
L. Liang, X. Sun, J. Zhang, et al., Adv. Energy Mater. 9 (2019) 1970033. doi: 10.1002/aenm.201970033
R. Wang, J. Zheng, X. Feng, et al., J. Solid State Electrochem. 24 (2020) 511–519. doi: 10.1007/s10008-019-04485-1
T.V.S.L. Satyavani, B.R. Kiran, V.R. Kumar, et al., Eng. Sci. Technol. Int. J. 19 (2016) 40–44.
M. Zhao, Y. Fu, N. Xu, et al., J. Mater. Chem. A 2 (2014) 15070–15077. doi: 10.1039/C4TA03311F
L. Xie, J. Cui, Y. Ma, et al., Chem. Eng. J. 499 (2024) 9.
Y.K. Hou, G.L. Pan, Y.Y. Sun, et al., ACS Appl. Mater. Interfaces 10 (2018) 16500–16510. doi: 10.1021/acsami.8b02736
X. Luo, L. Xing, J. Vatamanu, et al., J. Energy Chem. 65 (2021) 1–8.
C. Wang, L. Xing, J. Vatamanu, et al., Nat. Commun. 10 (2019) 3423. doi: 10.1038/s41467-019-11439-8
J. Liu, S. He, S. Liu, et al., J. Mater. Chem. A 10 (2022) 22929–22954. doi: 10.1039/d2ta07696a
Z. Xia, K. Zhou, X. Lin, et al., J. Energy Chem. 91 (2024) 266–275. doi: 10.1016/j.jechem.2023.11.045
M.R. Shaik, Y. Park, Y.K. Jung, et al., J. Energy Chem. 97 (2024) 120–127. doi: 10.1016/j.jechem.2024.05.036
J. Liu, Y. Cai, H. Pang, et al., Chin. Chem. Lett. 33 (2022) 4061–4063. doi: 10.1016/j.cclet.2021.12.068
G.W. Zheng, T. Wei, Nat. Energy 2 (2017) 17029. doi: 10.1038/nenergy.2017.29
Z. Geng, J. Lu, Q. Li, et al., Energy Storage Mater. 23 (2019) 646–652. doi: 10.1016/j.ensm.2019.03.005
T. Kawamura, S. Okada, J. -i. Yamaki, J. Power Sources 156 (2006) 547–554. doi: 10.1016/j.jpowsour.2005.05.084
J. Vetter, P. Novák, M.R. Wagner, et al., J. Power Sources 147 (2005) 269–281. doi: 10.1016/j.jpowsour.2005.01.006
X. Zeng, X. Gao, P. Zhou, et al., J. Energy Chem. 95 (2024) 519–528. doi: 10.1016/j.jechem.2024.03.062
L. Ni, S. Zhang, A. Di, et al., Adv. Energy Mater. 12 (2022) 26. doi: 10.1097/rd9.0000000000000001
W. Zuo, M. Luo, X. Liu, et al., Energy Environ. Sci. 13 (2020) 4450–4497. doi: 10.1039/d0ee01694b
Z. Ren, H. Qiu, C. Fan, et al., Adv. Funct. Mater. 33 (2023) 9.
T. Nedoseykina, M.G. Kim, S.A. Park, et al., Electrochim. Acta 55 (2010) 8876–8882. doi: 10.1016/j.electacta.2010.08.037
S. Gong, X. Bai, R. Liu, et al., J. Mater. Sci. Mater. Electron. 31 (2020) 7742–7752. doi: 10.1007/s10854-020-03311-z
H. Jiang, C. Yang, M. Chen, et al., Angew. Chem. Int. Ed. 62 (2023) e202300238. doi: 10.1002/anie.202300238
W. Huang, L. Xing, R. Zhang, et al., J. Power Sources 293 (2015) 71–77. doi: 10.1016/j.jpowsour.2015.05.070
G. Kang, G. Zhong, K. Cai, et al., ACS Energy Lett. 9 (2024) 2572–2581. doi: 10.1021/acsenergylett.4c00519
G. Wulff, Z. Kristallogr. 34 (1901) 449. doi: 10.1524/zkri.1901.34.1.449
J. Prywer, J. Cryst. Growth 270 (2004) 699–710. doi: 10.1016/j.jcrysgro.2004.06.046
P. Hartman, W.G. Perdok, Acta Crystallogr. 8 (1955) 49. doi: 10.1107/S0365110X55000121
Z. Ding, R. Song, Y. Shen, et al., Electrochim. Acta 525 (2025) 146118. doi: 10.1016/j.electacta.2025.146118
D. Ruan, M. Chen, X. Wen, et al., Nano Energy 90 (2021) 106535. doi: 10.1016/j.nanoen.2021.106535
Y. Li, K. Wang, J. Chen, et al., ACS Appl. Mater. Interfaces 12 (2020) 28169–28178. doi: 10.1021/acsami.0c05479
Z. Zhang, P. Zhou, H. Meng, et al., J. Energy Chem. 26 (2017) 481–487. doi: 10.1016/j.jechem.2016.12.003
J. Feng, Y. Liu, D. Fang, et al., Nano Energy 118 (2023) 109030. doi: 10.1016/j.nanoen.2023.109030
J. Ni, H. Zhou, J. Chen, et al., Electrochim. Acta 53 (2008) 3075–3083. doi: 10.1016/j.electacta.2007.11.026
T.F. Yi, Y.M. Li, X.Y. Li, et al., Sci. Bull. 62 (2017) 1004–1010. doi: 10.1016/j.scib.2017.07.003

Figure 1 (a) Schematic illustration of TMSA function in LiMn0.60Fe0.40PO4ǁLi cell. (b) Comparison of carbon layer and electrolyte interface evolution after cycling in baseline and 0.5% TMSA electrolytes.

Figure 2 (a) Schematic illustration of the reaction mechanism of TMSA. (b) Images of baseline and 0.5% TMSA electrolytes before and after storage at 60 ℃ for 11 days and pH strips after immersing into the respective electrolytes, and the corresponding pH values after measurement. 19F NMR spectra of (c) baseline and (d) 0.5% TMSA electrolytes after 11 days storage at 60 ℃. Insets are the corresponding magnified areas of 19F NMR spectra from −186 to −194 ppm and from −152 ppm to −160 ppm, which indexes the formation of HF and TMFS, respectively. (e) Post-storage voltage of the LiMn0.60Fe0.40PO4ǁLi cells with baseline and 0.5% TMSA electrolytes in the fully charged state after 11 days of storage at 60 ℃.

Figure 3 Optimized structures and binding energies (Eb, kJ/mol) of electrolyte solvents and TMSA with (a) HF and (b) H+. (c) Optimized structures and adiabatic ionization energy (AIE, kJ/mol) of EC, EMC and TMSA. (d) HOMO and LUMO energies of solvents and additive TMSA. (e) LSV curves of the Liǁstainless steel cells with baseline and 0.5% TMSA electrolytes. (f) Ionic conductivity of baseline, 0.5% TMSA, 1% TMSA, 1.5% TMSA and 2% TMSA electrolytes.

Figure 4 (a-c) SEM images and (d-l) HRTEM images and FFT patterns of LiMn0.60Fe0.40PO4 cathode: (a, d) fresh, (b, g) cycled in the baseline electrolyte and (c, j) cycled in the 0.5% TMSA electrolyte. XPS spectra of (m) O 1s and (n) F 1s for the LiMn0.60Fe0.40PO4 cathodes after cycling under different electrolyte conditions.

Figure 5 (a) 3D reconstruction distribution maps of LiF-, CO32- and PO2F2- showing the CEI structure and chemistry of LiMn0.60Fe0.40PO4 cathode measured by ToF-SIMS. (b) ICP-AES results of transition-metal dissolution on the side of lithium metal and (c) XRD patterns of LiMn0.60Fe0.40PO4 cathode with baseline and 0.5% TMSA electrolytes after cycling for 150 cycles. In situ X-ray diffraction of LiMn0.60Fe0.40PO4 cathode with (d) baseline and (e) 0.5% TMSA electrolytes.

Figure 6 (a) Relationship between the peak current ip of LiMn0.60Fe0.40PO4ǁLi cells and the square root of the scanning rate ν0.5. (b) Rate capability of baseline and 0.5% TMSA electrolytes at various currents from 0.1 C to 15 C. (c) Fitting resistance data of LiMn0.60Fe0.40PO4ǁLi cells with baseline and 0.5% TMSA electrolytes. Cycling performance of LiMn0.60Fe0.40PO4ǁLi cells with baseline and 0.5% TMSA electrolytes at 1 C under (d) 25 ℃ and (e) 55 ℃. (f) The long-term cycling performance of LiMn0.60Fe0.40PO4ǁgraphite pouch cell with 0.5% TMSA electrolyte at 1 C under 25 ℃.

 扫一扫看文章


扫一扫关注我们
 DownLoad:
 下载:
下载:
 下载:
下载: