Department of Hematology, Institute of Hematology, West China Hospital, Sichuan University, Chengdu 610041, China
b.
Department of Biotherapy, Cancer Center and State Key Laboratory of Biotherapy, Collaborative Innovation Center of Biotherapy, West China Hospital, Sichuan University, Chengdu 610041, China
* Corresponding authors. E-mail addresses: niuting@wchscu.cn (T. Niu)
Received Date:
22 April 2025 Accepted Date:
14 July 2025 Revised Date:
12 July 2025 Available Online:
15 July 2026
Abstract:
Multiple myeloma (MM) is the second most common hematological malignancy and still remains incurable. Selinexor (SEL) is the first-in-class exportin 1 (XPO1) inhibitor, and has demonstrated survival benefits in relapsed/refractory MM patients. Despite its therapeutic potential, dose-limiting toxicities frequently compromise SEL’s clinical utility and patients’ quality of life. In this work, to improve therapeutic efficacy and minimize side effects of SEL, we designed the monomethyl poly(ethylene glycol)-poly(ε-caprolactone) (mPEG-PCL) micelle-encapsulated nanoformulation for MM therapy. The mPEG-PCL-SEL micelle exhibited controlled release behavior and showed remarkable cytotoxicity in MM cells. Most importantly, in the orthotopic MM model, this micelle system exhibited impressive therapeutic efficacy at low dosages and significantly prolonged the survival of MM-bearing mice. Moreover, the mPEG-PCL-SEL micelle demonstrated a favorable safety profile with fewer gastrointestinal and constitutional symptoms. And we found that compared with the free-SEL, the mPEG-PCL-SEL micelle maintained the integrity of the intestinal barrier, and was more beneficial to the diversity of the intestinal microbiota, which may be related to the improved gastrointestinal tolerability, making it an effective and safe choice for MM treatment.
Multiple myeloma (MM) is characterized by the clonal proliferation of abnormal plasma cells in the bone marrow [1]. The advent of recent therapeutic agents for MM has resulted in increased remission and improved survival of MM patients [2]. Nonetheless, MM is highly heterogeneous and undergoes clonal evolution during the disease course in a subset of patients [3]. Most patients relapse or grow refractory to current treatment after a period of time, and a proportion of patients exhibited extremely poor outcomes [4]. Due to the dismal prognosis of relapsed/refractory MM patients, the development of new drugs with fundamentally different mechanisms of action is demanded.
Exportin 1 (XPO1) is responsible for regulating the export of a range of cargoes from the nucleus to the cytoplasm [5]. The overexpression of XPO1 is noted in many malignancies, including MM, and is related to poor prognosis [6,7]. Thus, the importance of XPO1 as a therapeutic target has been highlighted. The inhibition of XPO1 triggered the nuclear retention of tumor suppressor proteins and induced cytotoxicity in MM cells [8]. Selinexor (SEL) is the first-in-class selective inhibitor of XPO1 and has been approved by the FDA for relapsed/refractory MM [9]. However, adverse events were commonly reported at the time of SEL treatment [10,11]. The most frequent non-hematologic adverse events were gastrointestinal symptoms, such as nausea, vomiting, and diarrhea. Constitutional symptoms, including fatigue, weight loss, and decreased appetite, were also frequently encountered. It was noticed that nausea and fatigue could be the main reasons for withdrawing from the clinical trial at the dose-escalation phase [10]. Thrombocytopenia, anemia, and neutropenia were frequent hematologic adverse events related to SEL treatment [12]. On the ground of these side effects, most patients who were treated with SEL received concomitant prophylactic and supportive management during the treatment course [13]. Despite optimized supportive care, dose-limiting toxicities of SEL frequently necessitated treatment discontinuation or dose reduction, and all of the symptoms negatively impacted patients’ quality of life. In addition, treatment-related vomiting can influence the drug absorption, thus affecting the treatment efficacy. These unresolved challenges highlight the critical need for novel SEL delivery strategies to improve its therapeutic index.
In recent years, significant advancements have been made in nanomedicine [14,15]. Numerous drug delivery platforms, including liposomes, polymeric nanoparticles, hydrogels, and biomimetic nanoparticles, have been extensively investigated for MM therapy. These systems have been employed to deliver various antimyeloma agents such as doxorubicin and proteasome inhibitors [16,17]. Polymeric micelles are made up of self-assembled amphiphilic block polymers and act as an effective strategy to address the challenge of drug administration [18]. The monomethyl poly(ethylene glycol)-poly(ε-caprolactone) (mPEG-PCL) is a classic amphiphilic block copolymer with good biocompatibility and has been widely applied for drug delivery. The hydrophobic chains compose the inner core for hydrophobic drug loading, and the hydrophilic blocks develop the outer shell. The hydrophilic PEG coating could keep the micelle from being recognized by the reticuloendothelial system, thereby avoiding fast clearance and prolonging the circulation time [19]. Several polymeric micelles have been clinically evaluated [20]. While graphene oxide nanoflake-loaded SEL has been reported once [21], SEL delivery nanoplatforms for MM treatment remain unexplored.
In this work, we encapsulated SEL into the mPEG-PCL micelle for the treatment of MM for the first time. It is hypothesized that the mPEG-PCL micellar drug delivery system can provide good solubility and stability in blood circulation, improve therapeutic efficacy, and substantially minimize side effects in an orthotopic MM mouse model. Studies have demonstrated that the impairment of the mechanical intestinal barrier can impact normal physiological functions and lead to a series of gastrointestinal symptoms [22]. The intestinal microbiota is a crucial component of the intestinal microenvironment. Alteration and disturbance of the intestinal microbiota may be related to functional disorders, gastrointestinal symptoms, and disease progression [23,24]. Due to the fact that the free-SEL can lead to frequent gastrointestinal symptoms, we compared the influence of the mPEG-PCL-SEL micelle and the free-SEL on the intestinal barrier integrity, and demonstrated their effect on intestinal microbiota.
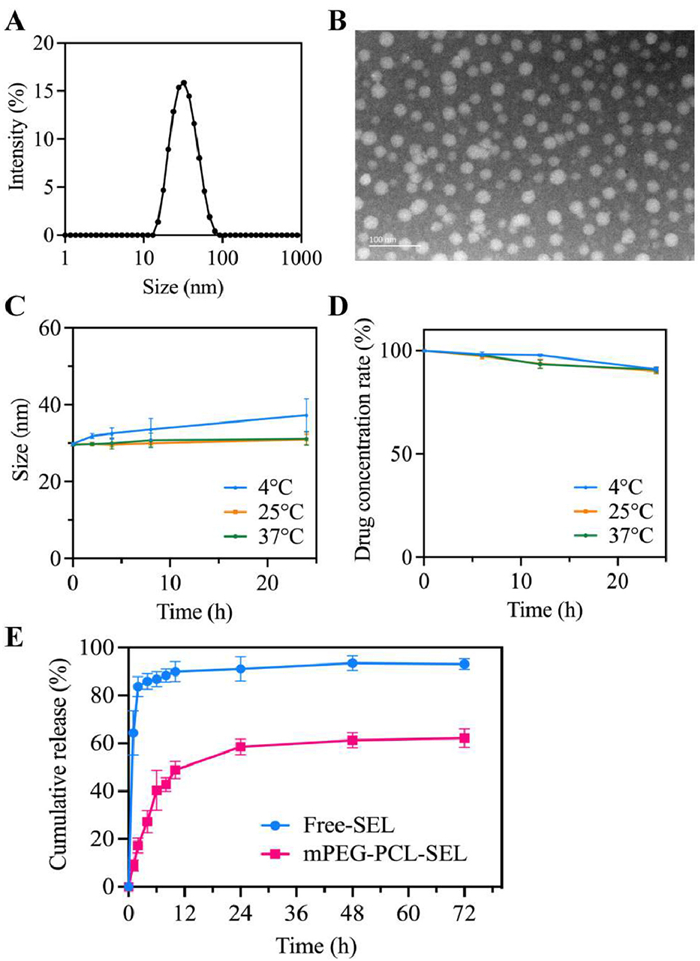
A thin-film hydration method was used to prepare the mPEG-PCL-SEL micelle. The micelle solution was clear with pale-yellow opalescence. Through a laser beam, the Tyndall effect was observed in the micelle solution, and it was not observed in pure water (Fig. S1A in Supporting information), which initially implied the successful formation of the micelle. After lyophilization, the micelle can be redissolved with a transparent appearance (Fig. S1B in Supporting information). Then, we evaluated the basic properties of the micelle. The particle size of the mPEG-PCL-SEL micelle was 30.2 ± 0.5 nm (Fig. 1A), the polydispersity index was 0.13, and the zeta potential was −4.52 ± 0.83 mV. The extraordinary encapsulation efficacy was 90.56% ± 3.77%, as assessed by the high-performance liquid chromatography. To further identify the characterization, the transmission electron microscopy image was taken, which indicated that the mPEG-PCL-SEL micelles were uniformly dispersed in the solution, maintaining a spherical morphology with particle sizes consistent with dynamic light scattering measurements (Fig. 1B). Without residual organic reagents and complicated surfactants, the micelle solution can be manufactured with a simple preparation procedure.
Figure 1
Figure 1.
Characterization of the mPEG-PCL-SEL micelle. (A) Particle size distribution of the mPEG-PCL-SEL micelle. (B) The transmission electron microscopy image of the mPEG-PCL-SEL micelle. Scale bar: 100 nm. Stability of the mPEG-PCL-SEL micelle, the change of particle size (C) and change of drug concentration in the micelle (D). (E) Release behavior of the free-SEL and the mPEG-PCL-SEL micelle. Data are presented as mean ± standard deviation (SD) (n = 3).
After the successful preparation of the mPEG-PCL-SEL micelle, the stability was determined. The micelle solution was prepared and stored at 4, 25 and 37 ℃. At 25 and 37 ℃, the particle sizes kept stable and remained nearly unchanged over 24 h. And at 4 ℃, the particle size increased slowly within 24 h, which was approximately 37.3 nm at 24 h (Fig. 1C). In addition, the SEL concentration rate encapsulated in the micelle remained at nearly 90% after 24 h (Fig. 1D), indicating that the mPEG-PCL-SEL micelle could remain stable for a long period. Furthermore, the release behavior of the mPEG-PCL-SEL micelle was investigated by employing a dialysis method (Fig. 1E). In the free-SEL group, over 80% of SEL was released in the first 2 h, and the cumulative release rate was 93.15% at 72 h. The result demonstrated that the free-SEL was released rapidly. However, the release of the mPEG-PCL-SEL micelle was much slower than that of the free-SEL. The cumulative release was 17.25%, 58.52%, and 62.24% at 2, 24, and 72 h, respectively. Therefore, the mPEG-PCL-SEL micelle exhibited excellent controlled release behavior. And the release behavior is consistent with other micellar formulations using the mPEG-PCL copolymer in previous studies [19,25]. This property could avoid fast release and contribute to SEL delivery to the tumor site.
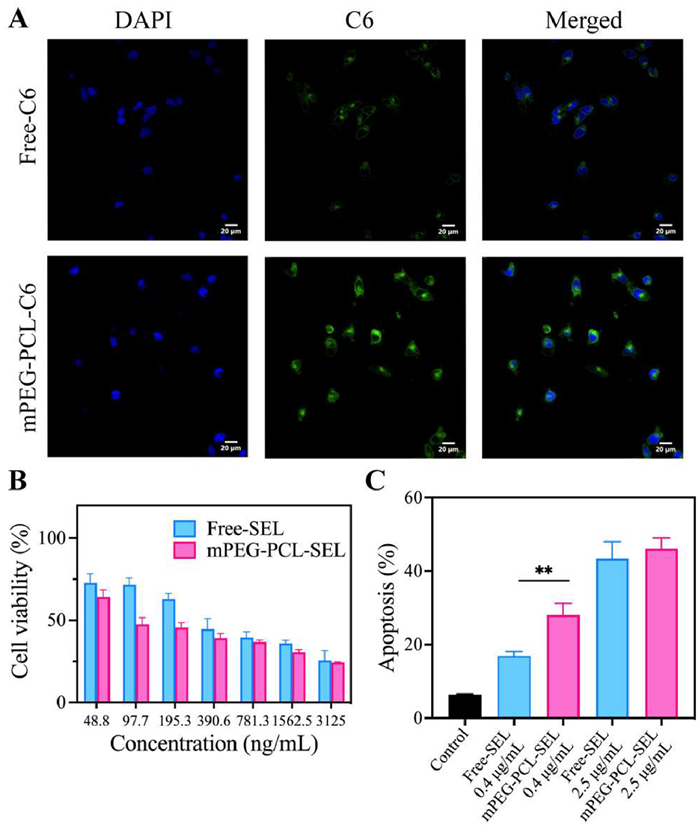
To evaluate whether the mPEG-PCL micelle could successfully deliver SEL into MM cells, the cellular uptake behavior was determined. The hydrophobic coumarin-6 (C6) as a fluorescent probe was loaded into the micelle using the same thin-film hydration method, and the confocal microscopy was adopted for evaluation. According to the result, the fluorescence intensity in the cytoplasm of ARD cells was significantly higher in the C6-loaded micelle group than in the free-C6 group (Fig. 2A). Cellular uptake of nanomedicine involves complex biomolecular interactions, and the micelle physicochemical properties can impact the cell membrane contact, adhesion, and uptake [26,27]. In our study, the mPEG-PCL micelle demonstrated favorable cellular uptake. And the increased cellular uptake indicated that the mPEG-PCL micelle could be an ideal delivery option for SEL. Next, the proliferation inhibition ability of the mPEG-PCL-SEL micelle was assessed via the cell counting kit-8 assay. After 48 h of incubation, both the free-SEL and the mPEG-PCL-SEL micelle exhibited cytotoxicity in a concentration-dependent manner. Surprisingly, the mPEG-PCL-SEL micelle displayed remarkable cytotoxicity in ARD cells (Fig. 2B), especially in the low concentrations compared with the free-SEL. Additionally, the apoptosis rate was determined via the Annexin-V/propidium iodide kit and flow cytometry analysis after incubation for 24 h. At a dose of 0.4 μg/mL, the cell apoptosis rates were 16.91% and 28.04% in the free-SEL group and the mPEG-PCL-SEL micelle group, respectively. At a dose of 2.5 μg/mL, there was no apparent difference in the cell apoptosis rate in either group (Fig. 2C and Fig. S2 in Supporting information). Collectively, SEL-loaded micelles demonstrated superior cytotoxicity and apoptosis induction ability compared with free SEL, particularly at low concentrations. Enhanced cellular uptake in the micelle group may result in increased cytotoxicity and apoptosis rate, which can explain the difference between these two formulations [28]. Given these promising in vitro results, we further verified the therapeutic efficacy of the mPEG-PCL-SEL micelle in vivo as follows.
Figure 2
Figure 2.
(A) The confocal fluorescence images of intracellular delivery of the mPEG-PCL-C6 micelle and the free-C6 in ARD cells. Scale bar: 20 μm. DAPI, 4′,6-diamidino-2-phenylindole; C6, coumarin-6. (B) Cytotoxicity of the free-SEL and the mPEG-PCL-SEL micelle in ARD cells after incubation of 48 h. (C) Apoptosis analysis of ARD cells treated with the free-SEL and the mPEG-PCL-SEL micelle at the SEL concentration of 0.4 and 2.5 μg/mL for 24 h. Data are presented as mean ± SD (n = 3). **P < 0.01.
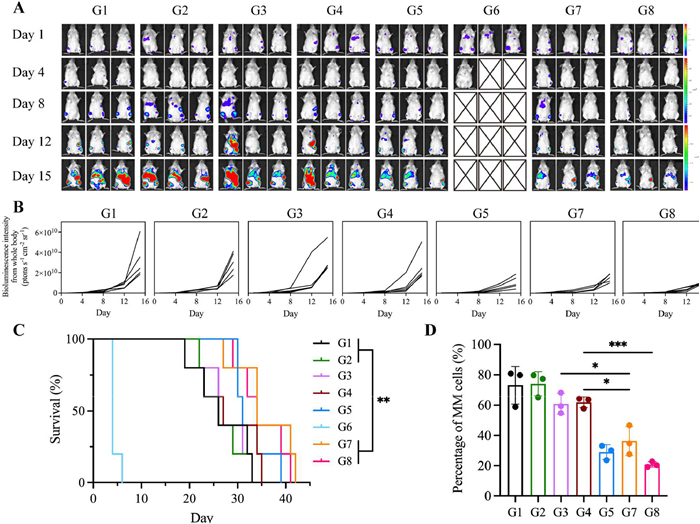
The orthotopic MM mouse model was developed to evaluate the therapeutic efficacy. We received approval for all procedures from the Institutional Animal Care and Use Committee of West China Hospital (Chengdu, China). These myeloma-bearing mice received the mPEG-PCL-SEL micelle or the free-SEL at several dosages. As shown in Figs. 3A and B, in the control and blank micelle groups, the bioluminescence imaging (BLI) signal representing tumor burden in mice increased rapidly. At doses of 2.5 and 5 mg/kg, the mice that received the free-SEL did not show noticeable therapeutic effects, while in the mPEG-PCL-SEL micelle groups, the BLI signals were much lower than those of the free-SEL groups. As the dosage increased to 10 mg/kg, the free-SEL partially inhibited tumor growth, while some of the mice in this group developed significant diarrhea and decreased appetite. In the 15 mg/kg free-SEL group, all the mice were sacrificed after the second administration because of drastic weight loss and severe gastrointestinal symptoms, including weakness, fatigue, and diarrhea. The 5 mg/kg mPEG-PCL-SEL micelle group demonstrated the greatest treatment efficacy, indicating the superior therapeutic activity of the mPEG-PCL-SEL micelle.
Figure 3
Figure 3.
The tumor inhibition efficacy in vivo. (A, B) Bioluminescence images and quantified intensity of mice in different treatment groups. (C) Survival time of MM-bearing mice in different treatment groups. Statistical significance was assessed by log-rank test (n = 5). (D) Flow cytometry analysis of the proportion of MM cells in bone marrow in different groups. Data are presented as mean ± SD (n = 3) (G1, control; G2, blank micelle; G3, free-SEL (2.5 mg/kg, p.o.); G4, free-SEL (5 mg/kg, p.o.); G5, free-SEL (10 mg/kg, p.o.); G6, free-SEL (15 mg/kg, p.o.); G7, mPEG-PCL-SEL micelle (2.5 mg/kg, i.v.); G8, mPEG-PCL-SEL micelle (5 mg/kg, i.v.)) P < 0.05, **P < 0.01, ***P < 0.001.
In the bone marrow, the infiltration of malignant plasma cells could produce monoclonal immunoglobulin and free light chain. The serum M protein level can be used to monitor disease progression and treatment efficacy [29]. Thus, the Kappa concentration determination was adopted in our study to further assess the tumor burden and disease progression during the treatment period (Fig. S3 in Supporting information). The Kappa concentrations increased rapidly in the control and blank micelle treated groups. In the 2.5 and 5 mg/kg free-SEL groups, the Kappa concentrations were almost the same as those in the control group, and some of the mice exhibited a drastic progression rate. The 10 mg/kg free-SEL group and the two SEL-micelle groups displayed decreased concentrations, indicating that they gradually inhibited the tumor progression, and the low doses of the mPEG-PCL-SEL micelle possessed excellent antitumor effects. In addition, the survival time is also a pivotal evaluation indicator, and it demonstrated the better therapeutic efficacy of the mPEG-PCL-SEL micelle (Fig. 3C). The median survival time of the control group, the blank micelle group, and the 2.5 mg/kg free-SEL group was 26 days, and it was 27 days in the 5 mg/kg free-SEL group. Besides, no significant difference was found between the 10 mg/kg free-SEL group and the control group despite a median survival time of 31 days in the 10 mg/kg free-SEL group. Surprisingly, in the mPEG-PCL-SEL micelle groups, at both the 2.5 and 5 mg/kg doses, the median survival time was 34 days. The SEL-loaded micelle efficiently prolonged the survival of myeloma-bearing mice. The determination of malignant plasma cell percentage in the bone marrow is one of the established tests performed to screen the disease status. To additionally quantify the tumor burden, the proportion of MM cells in the bone marrow was evaluated via flow cytometry after treatment. The trend of the percentages of MM cells in every group was consistent with the results of BLI signals. The mPEG-PCL-SEL micelle dramatically decreased the proportion of MM cells (Fig. 3D and Fig. S4 in Supporting information). Hematoxylin and eosin (H&E) staining of the bone also demonstrated the tumor burden to some extent. MM cells occupied most of the bone marrow in the control, blank micelle, and low dosages of free-SEL treated groups. In contrast, in other treatment groups, fewer MM cells were observed, particularly in the 5 mg/kg mPEG-PCL-SEL micelle treated group (Fig. S5 in Supporting information). Based on above results, we have confirmed that even at the low-dose level, the mPEG-PCL-SEL micelle possessed impressive therapeutic efficacy in MM treatment.
After treatment, as shown in Fig. S6 (Supporting information), major visceral organs were obtained for H&E staining (Fig. S6A). The infiltration of MM cells in the liver was observed, especially in the control, blank micelle, 2.5 and 5 mg/kg free-SEL groups. Compared to the control group, there were no noticeable pathological changes in major organs after being treated with the micelle or free drug. To further monitor the safety profile of the mPEG-PCL-SEL micelle, we observed its impact on hematopoietic cells and body weight in healthy BALB/c mice. The mice that received 15 mg/kg free-SEL were sacrificed owing to severe gastrointestinal symptoms and weight loss. On the seventh day after administration, the counts of white blood cells, lymphocytes, hemoglobin, and platelets were measured (Fig. S6B). In the 10 mg/kg free-SEL group, one mouse exhibited lymphopenia, and another mouse suffered from thrombocytopenia, indicating the occurrence of hematologic toxicity. Surprisingly, mice in the mPEG-PCL-SEL micelle treated groups did not show the abnormal situation of hematopoietic cells, exhibiting a good safety profile. Moreover, the monitoring of body weight indicated that in the free-SEL treated groups, mice suffered from drastic body weight loss. While in the mPEG-PCL-SEL micelle groups, there was no obvious body weight loss during treatment, which indicated that the micelle system dramatically alleviated the side effects (Fig. S6C).
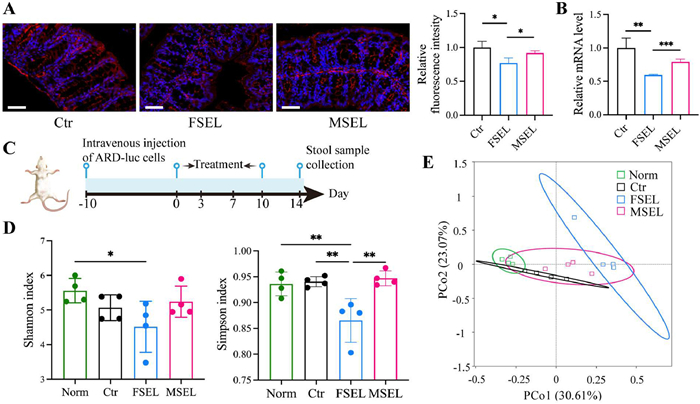
Due to the frequent gastrointestinal symptoms caused by free-SEL, we further monitored the impact of drug exposure on the intestinal tract. The integrity of the intestinal barrier is essential for the function of the gastrointestinal tract [30]. The impairment to the intestinal barrier can lead to gastrointestinal disorders. The epithelial cells of the intestinal barrier are bound by tight junction proteins. Zonula occludens-1 (ZO-1) is a tight junction protein, and its physiological significance has been demonstrated [31]. We examined the expression level of ZO-1 in the colon. The immunofluorescence results indicated that after treatment with the free-SEL, ZO-1 in the colon was reduced, while in the mPEG-PCL-SEL micelle treated group, the protein showed no significant alteration (Fig. 4A). Furthermore, the quantitative assessment of the ZO-1 mRNA level showed consistent results with the immunofluorescence analysis (Fig. 4B). Extensive evidence demonstrates that chemotherapeutic agents disrupt intestinal barrier integrity through downregulation of tight junction proteins, leading to significant mucositis [32]. In our work, the damage of the tight junction protein in the free-SEL treated group may partly explain the gastrointestinal symptoms and sharp weight loss of the mice. In contrast, the mPEG-PCL-SEL micelle group showed attenuated intestinal damage, and this may attribute to reduced intestinal drug distribution [33,34].
Figure 4
Figure 4.
(A) The immunofluorescence analysis of ZO-1 (red) in the intestinal barrier after treatment. Scale bar: 50 μm. (B) The mRNA level of ZO-1 in the colon after treatment (n = 3) (Ctr, normal saline; FSEL, free-SEL; MSEL, mPEG-PCL-SEL micelle). (C) Timeline of the experiment to evaluate the influence of treatment on the intestinal microbiota. (D) Shannon index and Simpson index of intestinal microbiota after treatment (n = 4). (E) PCoA based on the Bray-Curtis distance matrix. (Norm, non-tumor-bearing healthy B-NDG mice treated with normal saline; Ctr, MM mouse model treated with normal saline; FSEL, MM mouse model treated with free-SEL; MSEL, MM mouse model treated with the mPEG-PCL-SEL micelle). Data are presented as mean ± SD. P < 0.05, **P < 0.01, ***P < 0.001.
To further insight into the influence of SEL exposure on intestinal health, we compared the effect on intestinal microbiota after being treated by the free-SEL or the mPEG-PCL-SEL micelle (Fig. 4C). The intestinal microbiota plays a role in nutrient digestion, metabolism, and host immunity, and contributes to intestinal homeostasis [35]. The diverse community coexists in the intestinal tract and is sensitive to diet, drug exposure, disease, and other influences. In addition, drugs can affect bacterial growth, influence intestinal microbial composition, and change the intestinal microenvironment [36]. The B-NDG mice were kept in the specific pathogen free room and allowed to acquire microbes from the microenvironment. The α-diversity analysis has been applied. According to the Shannon index and Simpson index, the α-diversity of intestinal microbiota in the free-SEL treated group was lower than that in the normal saline treated group and the mPEG-PCL-SEL micelle treated group (Fig. 4D). The diversity and abundance of intestinal microbes are indicators used to evaluate fluctuations in microbial communities after treatments. Some studies have found that chemotherapy can dramatically alter the diversity of the gut microbiota and disrupt the dominant microbiota in patients with hematologic malignancy [37]. The free-SEL heavily decreased the α-diversity of the intestinal microbiota. And the low microbial diversity may associate with infectious complications and disease conditions [38,39]. Based on the Bray-Curtis distance matrix, the Principal Co-ordinates Analysis indicated that the microbiota structure altered after exposure to SEL (Fig. 4E). Additionally, we analyzed the composition and abundance of the microbial communities at the genus level (Figs. S7 and S8 in Supporting information). The relative abundance of Lactobacillus increased in the micelle-treated group. As a key component of intestinal microbiota, strains of Lactobacillus act as probiotic candidates [40]. Besides, the relative abundance of Bacteroides, Parabacteroides, and Blautia slightly increased in the free-SEL treated group. And Enterococcus casseliflavus increased in the free-SEL treated group at the species level.
In this work, we developed the mPEG-PCL-SEL micelle with thin-film hydration. The micellar formulation showed good stability, sustained release manner, and increased cellular uptake. Besides, the mPEG-PCL-SEL micelle induced remarkable cytotoxicity in MM cells compared with the free-SEL in vitro. Additionally, in the orthotopic MM model, the mPEG-PCL-SEL micelle exhibited impressive therapeutic efficacy compared with the free-SEL at the same dose level and showed better therapeutic outcomes than the high-dose free-SEL, performed with significantly prolonged survival. Meanwhile, the micellar formulation possessed a favorable safety profile that the mice treated with the mPEG-PCL-SEL micelle showed fewer adverse events. Compared with the free-SEL, the mPEG-PCL-SEL micelle alleviated the impairment to the tight junction protein, maintained the integrity of the intestinal barrier, and was more beneficial to the diversity of the intestinal microbiota, which may be related to the improved gastrointestinal tolerability.
It is worth noting that none of the treatment groups achieved complete remission. This may be due to the limited treatment efficacy of a single agent. The combinations of SEL and bortezomib (Bortezomib), doxorubicin, or melphalan regimens have been explored in preclinical and clinical trials, which indicated synergistic efficacy and improved therapeutic outcomes [41,42]. Hence, nanomedicine-based combination therapies containing SEL can be studied to further improve the efficacy of MM treatment. In conclusion, the mPEG-PCL-SEL micelle performed as an effective and safe formulation, providing a new strategy for the treatment of MM.
Declaration of competing interest
The authors declare that they have no known competing financial interests or personal relationships that could have appeared to influence the work reported in this paper.
This work was supported by the National Natural Science Foundation of China (Nos. U21A20417, U24A20680, 31930067, 82472138, 82272147, 32271450, 82370192) and the Science and Technology Project of Sichuan Province (Nos. 2023YFS0118, 2024YFFK0322), 1.3.5 Project for Disciplines of Excellence (No. ZYJC21007), 1.3.5 Project for High Altitude Medicine (No. GYYX24003), 1.3.5 Project for Artificial Intelligence (No. ZYAI24039), West China Hospital, Sichuan University, Key Research and Development Program of Sichuan Province (No. 2023YFS0031), National Key Research and Development Program of China (Nos. 2022YFC2502600, 2022YFC2502603).
Supplementary materials
Supplementary material associated with this article can be found, in the online version, at doi:10.1016/j.cclet.2025.111586.
[1]
F. Malard, P. Neri, N.J. Bahlis, et al., Nat. Rev. Dis. Primers 10 (2024) 45. doi: 10.1038/s41572-024-00529-7
[2]
S.V. Rajkumar, Am. J. Hematol. 99 (2024) 1802–1824. doi: 10.1002/ajh.27422
[3]
A.K. Dutta, J.B. Alberge, R. Sklavenitis-Pistofidis, et al., Nat. Rev. Clin. Oncol. 19 (2022) 223–236. doi: 10.1038/s41571-021-00593-y
[4]
U.H. Gandhi, R.F. Cornell, A. Lakshman, et al., Leukemia 33 (2019) 2266–2275. doi: 10.1038/s41375-019-0435-7
Figure 1
Characterization of the mPEG-PCL-SEL micelle. (A) Particle size distribution of the mPEG-PCL-SEL micelle. (B) The transmission electron microscopy image of the mPEG-PCL-SEL micelle. Scale bar: 100 nm. Stability of the mPEG-PCL-SEL micelle, the change of particle size (C) and change of drug concentration in the micelle (D). (E) Release behavior of the free-SEL and the mPEG-PCL-SEL micelle. Data are presented as mean ± standard deviation (SD) (n = 3).
Figure 2
(A) The confocal fluorescence images of intracellular delivery of the mPEG-PCL-C6 micelle and the free-C6 in ARD cells. Scale bar: 20 μm. DAPI, 4′,6-diamidino-2-phenylindole; C6, coumarin-6. (B) Cytotoxicity of the free-SEL and the mPEG-PCL-SEL micelle in ARD cells after incubation of 48 h. (C) Apoptosis analysis of ARD cells treated with the free-SEL and the mPEG-PCL-SEL micelle at the SEL concentration of 0.4 and 2.5 μg/mL for 24 h. Data are presented as mean ± SD (n = 3). **P < 0.01.
Figure 3
The tumor inhibition efficacy in vivo. (A, B) Bioluminescence images and quantified intensity of mice in different treatment groups. (C) Survival time of MM-bearing mice in different treatment groups. Statistical significance was assessed by log-rank test (n = 5). (D) Flow cytometry analysis of the proportion of MM cells in bone marrow in different groups. Data are presented as mean ± SD (n = 3) (G1, control; G2, blank micelle; G3, free-SEL (2.5 mg/kg, p.o.); G4, free-SEL (5 mg/kg, p.o.); G5, free-SEL (10 mg/kg, p.o.); G6, free-SEL (15 mg/kg, p.o.); G7, mPEG-PCL-SEL micelle (2.5 mg/kg, i.v.); G8, mPEG-PCL-SEL micelle (5 mg/kg, i.v.)) P < 0.05, **P < 0.01, ***P < 0.001.
Figure 4
(A) The immunofluorescence analysis of ZO-1 (red) in the intestinal barrier after treatment. Scale bar: 50 μm. (B) The mRNA level of ZO-1 in the colon after treatment (n = 3) (Ctr, normal saline; FSEL, free-SEL; MSEL, mPEG-PCL-SEL micelle). (C) Timeline of the experiment to evaluate the influence of treatment on the intestinal microbiota. (D) Shannon index and Simpson index of intestinal microbiota after treatment (n = 4). (E) PCoA based on the Bray-Curtis distance matrix. (Norm, non-tumor-bearing healthy B-NDG mice treated with normal saline; Ctr, MM mouse model treated with normal saline; FSEL, MM mouse model treated with free-SEL; MSEL, MM mouse model treated with the mPEG-PCL-SEL micelle). Data are presented as mean ± SD. P < 0.05, **P < 0.01, ***P < 0.001.

 DownLoad:

 下载:
下载:


 下载:
下载:
