State Key Laboratory of Materials Low-Carbon Recycling, College of Materials Science an Engineering, Beijing University of Technology, Beijing 100124, China
b.
Beijing Key Laboratory of Microstructure and Property of Advanced Materials, College of Materials Science and Engineering, Beijing University of Technology, Beijing 100124, China
c.
College of Carbon Neutrality Future Technology, Beijing University of Technology, College of Materials Science an Engineering, Beijing 100124, China
d.
Beijing Institute of Smart Energy, Beijing Huairou Laboratory, Beijing 102209, China
* Corresponding authors at: State Key Laboratory of Materials Low-Carbon Recycling
Received Date:
14 May 2025 Accepted Date:
08 July 2025 Revised Date:
01 July 2025 Available Online:
15 October 2026
Abstract:
The oxygen evolution reaction (OER), as the rate-determining step in water electrolysis, demands efficient non-precious catalysts to replace conventional Ru/Ir-based materials. While transition metal sulfides (TMS) show promise application prospect, but is limited by sulfur leaching-induced degradation. We address this challenge through a cyanide-mediated stabilization strategy, developing a Ni-CN/Ni3S2 catalyst where sacrificial C≡N groups transform into C═O moieties during OER. This structural evolution effectively suppresses sulfur leaching while enabling the formation of highly active Ni-SO4-OH species rather than conventional NiOOH. The optimized catalyst demonstrates exceptional performance with a 209 mV overpotential at 10 mA/cm2, outperforming both RuO2 (241 mV) and pristine Ni3S2 (311 mV), and maintains 200 h stability at 100 mA/cm2. When integrated into an anion exchange membrane (AEM) electrolyzer, the catalyst achieves 1 A/cm2 at 1.71 V with 200 h durability (35 µV/h voltage decay). Combined experimental and theoretical analyses reveal that the sulfur-anchored structure enables exceptional stability through controlled surface reconstruction and suppressed element dissolution. This work provides critical insights into designing durable, high-performance OER electrocatalysts through dynamic interface engineering.
Electrochemical water splitting has been considered to be one of the most environmentally friendly methods for hydrogen production, aligning with the requirements for hydrogen energy utilization [1–5]. Meanwhile, the oxygen evolution reaction (OER) as the rate-determining step (RDS), becomes the bottleneck of the overall reaction kinetics due to its high overpotential [6,7]. Therefore, advanced electrocatalysts with reduced overpotentials are essential for water electrolysis. As reported, transition metal sulfides (TMS) show excellent intrinsic activity and abundant active sites, making them promising Ir/Ru-free alternatives for alkaline OER [8–10].
However, these TMS catalysts undergo irreversible reconstruction during OER. For example, Wei et al. observed that the surface of Ni3S2/FeNi2S4 nanosheets tends to encounter phase reconstruction, forming Ni-Ni(Fe)OOH [11]. Similarly, Mullins et al. discovered that metal chalcogenides are employed as pre-catalysts in the OER owing to their surface reconstruction during the process [12]. And Yu et al. in-situ observed that CoSx gradually evolves into amorphous CoOOH in OER [13]. Leaching of sulfur will lead to structural collapse of the active site, which will cause rapid deactivation of the catalyst in industrial applications. Meanwhile, numerous studies have shown that suppressing the leaching of sulfur species can effectively enhance the catalytic activity of TMS. Zhang et al. found that the amorphous sulfur oxides formed through the reconstruction of TMS exhibit superior catalytic activity compared to their oxide counterparts during the OER [14]. Li et al. constructed nickel-cobalt sulfide heterostructures with nitrogen-doped carbon-shell encapsulation, this structure can suppress sulfur leaching and achieve excellent hydrogen evolution reaction (HER) performance [15]. Shi et al. increased the SO42- concentration in the electrolyte, suppressing sulfur leaching and promoting the retention of sulfides on the catalyst surface, thereby enhancing the OER activity and stability [16]. These findings suggest that inhibiting sulfur leaching while maintaining sulfide species in the catalysts could be key to achieving stable OER performance. However, these approaches can partially disrupt the interaction between electrolyte and TMS catalysts, which limits their feasibility for industrial applications.
In this work, we report a sacrificial-mediated sulfur confinement strategy to prevent sulfur leaching in TMS catalysts, enhancing OER performance and stability. The designed Ni(H2O)2[Ni(CN)4]·H2O/Ni3S2 (Ni-CN/Ni3S2) catalyst utilizes Ni-CN as a sacrificial agent, forming active Ni-SO4-OH species during reconstruction. This approach effectively prevents active site inactivation, achieving a low overpotential of 209 mV at 10 mA/cm2 and 100 h stability at 100 mA/cm2, which better than both commercial RuO2 (241 mV) and Ni3S2 (311 mV). DFT calculations reveal reduced energy barriers at the heterojunction interface, activating the catalyst surface. Furthermore, the performance in anion exchange membrane (AEM) electrolyzers has been validated, requiring only 1.71 V for a large current density of 1 A/cm2 and exhibiting commendable stability. Our work provides new insights for controlling elemental leaching and designing active sites in transition metal compounds.
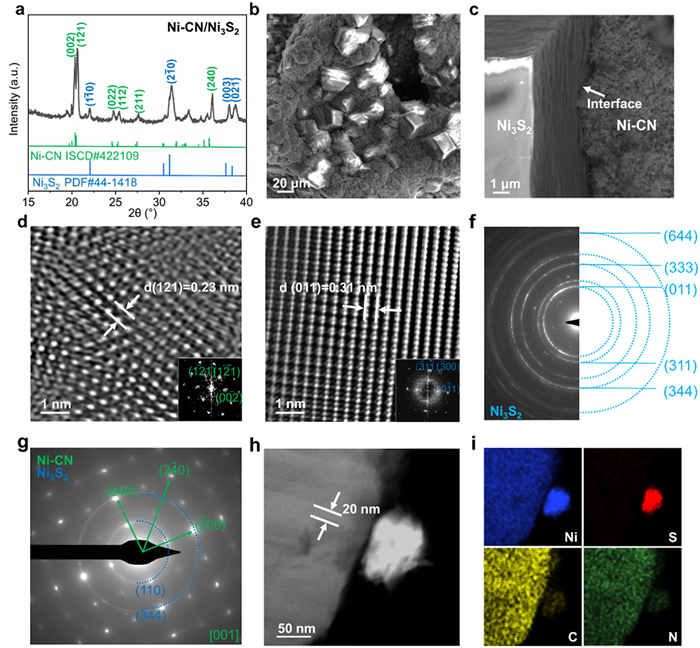
The Ni-CN/Ni3S2 catalyst was successfully synthesized following the procedure illustrated in Fig. S1 (detailed methods are provided in Supporting information). The X-ray diffraction (XRD) pattern (Fig. 1a) clearly displayed characteristic peaks corresponding to Ni(H2O)2[Ni(CN)4]·H2O (ICSD #422109) and Ni3S2 (JCPDS No. 44-1418), confirming the exclusive presence of cyanide compound and nickel sulfide in the catalyst. Scanning electron microscopy (SEM) images revealed that the morphology of Ni-CN/Ni3S2 is primarily composed of uniformly distributed lamellar and flower-like structures (Figs. 1b and c). The lamellar structure reveals lattice spacings of 0.23 nm (Fig. 1d), standard diffraction patterns corresponding to the fast Fourier transform (FFT) show that it is projected along the [210] zone axis (Fig. S2 in Supporting information). While, HR-TEM image of the nanoflower-like structure reveals a lattice spacing of 0.31 nm, which corresponds to the (011) facet of Ni3S2 (Fig. 1e and Fig. S3 in Supporting information). And its selected area electron diffraction (SAED) pattern shows polycrystalline diffraction ring, correspond to the (011), (311) and (333) facets of Ni3S2 (Fig. 1f). In the SAED pattern of another region, diffraction spots corresponding to Ni-CN and polycrystalline rings of Ni3S2 were simultaneously observed, further confirming the coexistence of the two phases (Fig. 1g and Fig. S4 in Supporting information). High angle annular dark field (HAADF) image coupled energy dispersive spectrometer (EDS) were employed to analyze both morphologies (Figs. 1h and i). The lamellar structure (~20 nm thick) shows no sulfur signal, whereas the flower-like structure exhibits clear sulfur distribution. Meanwhile, high-resolution transmission electron microscopy (HR-TEM) images further confirm the phase compositions of the lamellar to be Ni-CN and flower-like structures to be Ni3S2.
Figure 1
Figure 1.
(a) XRD pattern and (b, c) SEM image where green marks exhibit lamellar Ni-CN and blue marks exhibit flower-like Ni3S2. (d) HR-TEM images and (g) SAED pattern of Ni-CN in Ni-CN/Ni3S2. (e) HR-TEM image and (f) SAED pattern of Ni3S2 in Ni-CN/Ni3S2. (h, i) HAADF image and the corresponding EDS mapping images of Ni-CN/Ni3S2.
The influence of Ni(NO3)2·6H2O: CH4N2S ratios on the Ni-CN/Ni3S2 phase composition, morphology and electrocatalysis performance were systematically studied. XRD patterns (Figs. S5a and b in Supporting information) showed increasing Ni-CN phase content with higher Ni(NO3)2·6H2O proportions. At Ni(NO3)2: CH4N2S ratios of 1:1 to 9:1, the Ni-CN: Ni3S2 phase ratios ranged from 4:1 to 2:3 (Table S1 in Supporting information). SEM revealed the morphology evolution from cellular to mixed lamellar/nanoflower structures with increasing Ni-CN content (Fig. S6 in Supporting information).
The performance of the catalysts with different phase ratios was evaluated by linear sweep voltammetry (LSV). The 1:1 phase ratio Ni-CN/Ni3S2 catalyst showed optimal OER performance with a 209 mV overpotential (Fig. S7a in Supporting information) and 49.7 mV/dec Tafel slope (Fig. S7b in Supporting information), indicating faster reaction kinetics than other ratios. Double-layer capacitance measurements show the 1:1 phase ratio catalyst has the largest electrochemical surface area (ECSA) (81.4 mF/cm2), significantly higher than the 2:3 (52.4 mF/cm2) and 4:1 (11.5 mF/cm2) samples (Fig. S7c in Supporting information). Combined with SEM images, it shows that hybrid nanoflower/lamellar structure exhibits the largest surface area. Electrochemical impedance spectroscopy (EIS) measurements (Fig. S7d in Supporting information) confirm 1:1 phase ratio catalyst has the lowest charge transfer resistance (0.6 Ω), outperforming other ratios (0.63–1.4 Ω). In summary, phase ratio of Ni-CN and Ni3S2 determines morphology and component distribution, the 1:1 ratio achieved optimal nanoflower-lamellar integration, while also achieved maximal surface area and minimal charge transfer resistance.
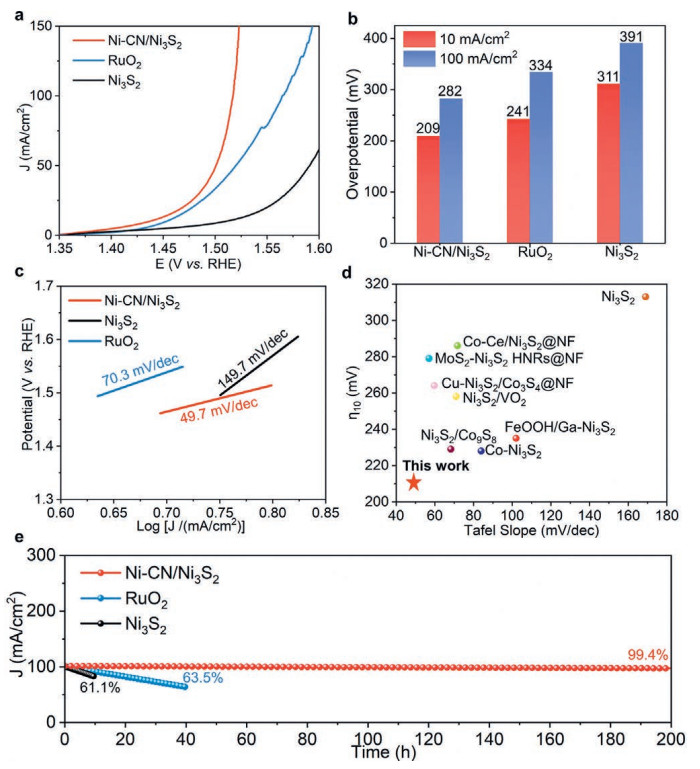
The superior OER performance of Ni-CN/Ni3S2 was further demonstrated through comparative studies with Ni3S2 and RuO2 electrodes. The Ni-CN/Ni3S2 exhibits superior activity, requiring only 209 mV overpotential at 10 mA/cm2, significantly lower than Ni3S2 (311 mV) and RuO2 (241 mV) (Fig. 2a). This advantage persists at 100 mA/cm2, with overpotentials of 282 mV for Ni-CN/Ni3S2, comparing with RuO2 (334 mV) and Ni3S2 (391 mV), demonstrating its exceptional high-current performance for industrial applications (Fig. 2b).
Figure 2
Figure 2.
(a) LSV curves of Ni-CN/Ni3S2, RuO2, Ni3S2 with iR-corrected. (b) Overpotentials of Ni-CN/Ni3S2, RuO2, Ni3S2 at 10 mA/cm2 and 100 mA/cm2 in 1 mol/L KOH. (c) Tafel slopes for the corresponding samples presented in (a). (d) Comparison of Ni-CN/Ni3S2 with other advanced Ni3S2-based electrocatalysts. (e) Durability tests of Ni-CN/Ni3S2, RuO2 and Ni3S2 in 100 mA/cm2.
The Ni-CN/Ni3S2 catalyst also demonstrates exceptional OER kinetics, exhibiting a significantly lower Tafel slope (49.7 mV/dec) than Ni3S2 (149.7 mV/dec) and RuO2 (70.3 mV/dec) (Fig. 2c). ECSA analysis reveals an enhanced Cdl value of 81.4 mF/cm2 compared to 6.5 mF/cm2 for Ni3S2 and 19.3 mF/cm2 for RuO2 (Fig. S8a in Supporting information), demonstrating the Ni-CN/Ni3S2 effectiveness in exposing active sites. To better compare the intrinsic activity of the catalysts, the OER current density was normalized by the ECSA. As evidenced in Fig. S9 (Supporting information), Ni-CN/Ni3S2 achieves a current density of 0.07 mA/cmECSA2 at 1.5 V vs. RHE, exceeding those of RuO2 (0.03 mA/cmECSA2) and Ni3S2 (0.01 mA/cmECSA2) significantly. EIS results showed Ni-CN/Ni3S2 has remarkably lower charge transfer resistance (0.6 Ω) versus Ni3S2 (11.3 Ω) and RuO2 (1.3 Ω) (Fig. S8b in Supporting information), while contact angle measurements confirm improved hydrophilicity (9° for Ni-CN/Ni3S2vs. 20° for Ni3S2) (Fig. S10 in Supporting information). The catalyst surpasses most reported Ni3S2-based catalysts in alkaline OER performance (Fig. 2d) and maintains 99.4% current density at 100 mA/cm2 after 200 h, outperforming RuO2 (67% after 40 h) and Ni3S2 (61% after 10 h) (Fig. 2e) [17–23].
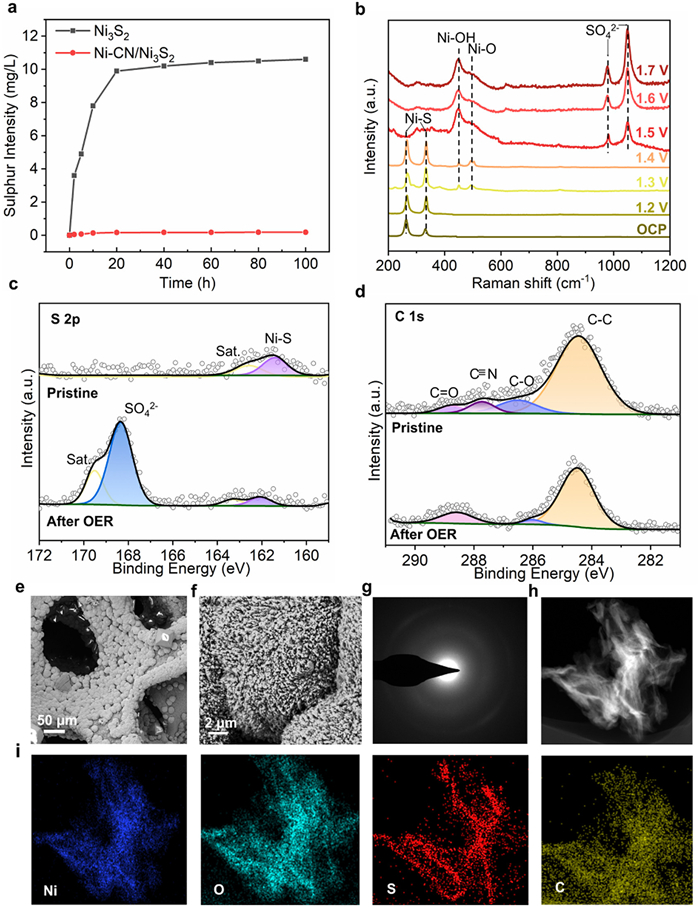
Through inductively coupled plasma (ICP), the sulfur leaching behavior during OER was evaluated. For Ni3S2, the sulfur leaching concentration reached 10.3 mg/L after 20 h with a gradual peak formation, whereas that of Ni-CN/Ni3S2 remained merely 0.13 mg/L (Fig. 3a). Based on the measured LSV curves of Ni3S2 and Ni-CN/ Ni3S2 catalysts at different cycle numbers, the critical role of anchored S species in enhancing stability under OER conditions was further confirmed (Fig. S11a in Supporting information). The results reveal that Ni3S2 exhibits a 48 mV increase in overpotential at 10 mA/cm2 after 1000 reaction cycles (Fig. S11b in Supporting information), whereas Ni-CN/Ni3S2 retains its initial activity. This pronounced contrast validates the superior capability of Ni-CN/Ni3S2 in suppressing sulfur leaching. The crystal structures, surface compositions, chemical states, and local electronic structures of the Ni-CN/Ni3S2 catalyst were systematically investigated before and after the OER test to elucidate their exceptional performance. Raman spectroscopy was employed to monitor the evolution of active sites during OER at applied potentials of 1.2–1.7 V (vs. RHE). For Ni3S2, The Raman peaks in the 200–400 cm-1 range, detected under pristine conditions and at 1.2 V, demonstrate its retained structural integrity during electrochemical operation [24]. Upon increasing the potential to 1.3 V, Raman peaks at 475 cm-1 (Ni–OH) and 492 cm-1 (Ni—O) emerged and intensified (Fig. S12 in Supporting information) [25,26], confirming the gradual reconstruction of Ni3S2 into NiOOH. For Ni-CN/ Ni3S2, the Ni—S signal vanished above 1.5 V, which is similar with Ni3S2. Notably, the Ni—OH peak intensity was significantly higher than that of Ni—O, indicating preferential Ni—OH formation over Ni—O during structural reconfiguration [27–29]. Concurrently, two new peaks at 980 and 1050 cm-1 appeared (Fig. 3b), assigned to SO42- formation [30].
Figure 3
Figure 3.
(a) Quantitative analysis of sulfur in Ni-CN/Ni3S2 and Ni3S2 electrolytes by ICP. (b) Raman spectra of Ni-CN/Ni3S2 under different potentials in 1 mol/L KOH. (c) S 2p, and (d) C 1s XPS spectra of Ni-CN/Ni3S2 before and after OER. (e, f) High and low-magnification SEM images. (g) SAED pattern. (h, i) HADDF-STEM image and the corresponding elemental mapping images of Ni-CN/Ni3S2 after the OER process.
The reconstruction pathway was further verified by X-ray photoelectron spectroscopy (XPS). The Ni 2p spectra of Ni3S2 exhibit three characteristic peaks at 855.8 and 873.5 eV assigned to Niδ+ (δ ≥ 2) and the peak at 852.2 eV assigned to Ni0 (Fig. S13a in Supporting information) [31,32]. Compared to Ni3S2, the Ni 2p spectrum of the Ni-CN/Ni3S2 heterostructure reveals the disappearance of 852.2 eV peak. This indicates electron transfer from Ni3S2 to Ni-CN within the heterostructure, and this electron transport channel accelerates the reaction kinetics (Fig. S14 in Supporting information). After-OER XPS analysis reveals a pronounced disappearance of 852.2 eV peak in Ni3S2, indicating sulfur leaching during reconstruction that alters the active sites (Fig. S13a). In contrast, the heterostructure maintains a stable Ni oxidation state in XPS, demonstrating the effective immobilization of sulfur species (Fig. S15 in Supporting information). Furthermore, the intensified OH- peak at 529.6 eV and emergent Ni-O signature at 527.8 eV in O 1s spectra of Ni3S2 confirm its reconstruction into NiOOH (Fig. S13b in Supporting information). Additionally, sulfur oxidation and leaching were observed (Fig. S13c in Supporting information), as the S 2p peaks of Ni3S2 (162.3 and 163.6 eV) vanished after OER. A similar trend was observed in the S 2p spectra of Ni-CN/Ni3S2, however, the emergence of the SO42- peak was observed (168.5 and 169.0 eV) [33], indicating sulfur retention in the reconstructed catalyst as sulfate species [34]. In addition, XPS analysis of the pristine Ni-CN/Ni3S2 catalyst revealed a C 1s peak at 288.4 eV, assigned to carbonyl groups (C═O), and a peak at 287.8 eV corresponding to C≡N bonds (Fig. 3d). After OER, the C≡N peak disappeared while the C═O peak intensity significantly increased [35]. Raman spectroscopy further confirmed this transformation, with characteristic C≡N vibrations at 2176 and 2182 cm-1 disappearing at 1.6 V (Fig. S16 in Supporting information) [36]. Concurrently, the SO42- peak intensity increased, suggesting C═O formation reduced the Ni—O bond ratio and facilitated Ni-OH-SO4 association. These results demonstrate the cyano group's crucial role in SO42- incorporation during phase reconstruction.
SEM images revealed significant morphological evolution during OER (Figs. 3e and f). The initial lamellar Ni-CN structure progressively transformed into nanoflowers with increasing size (Fig. S17 in Supporting information), ultimately forming aggregated nanoflowers and residual lamellar features. HAADF and SAED characterization after 100 h testing demonstrated a polycrystalline-to-amorphous phase transition (Figs. 3g and h). EDS mapping confirmed uniform distribution of Ni, C, O, and S in the final nanoflowers (Fig. 3i), demonstrating effective sulfur retention. These results provide direct evidence for the formation of a stable amorphous structure containing Ni—OH and SO42- species, representing a previously unreported reconstruction pathway in transition metal sulfides [37].
Above characterization results demonstrate that the Ni-CN/Ni3S2 catalyst achieves sulfur anchoring through the cyano group sacrifice. During OER, C≡N bond cleavage generates abundant C═O groups, which suppress Ni—O bond formation. To maintain Ni oxidation state, the reconstructed Ni-OH phase combines with SO42-, forming stable Ni-SO4nullOH surface species. This unique reconstruction mechanism effectively prevents the loss of the active site caused by sulfur leaching. This sulfur anchoring strategy significantly enhances both OER activity and long-term stability [38–40].
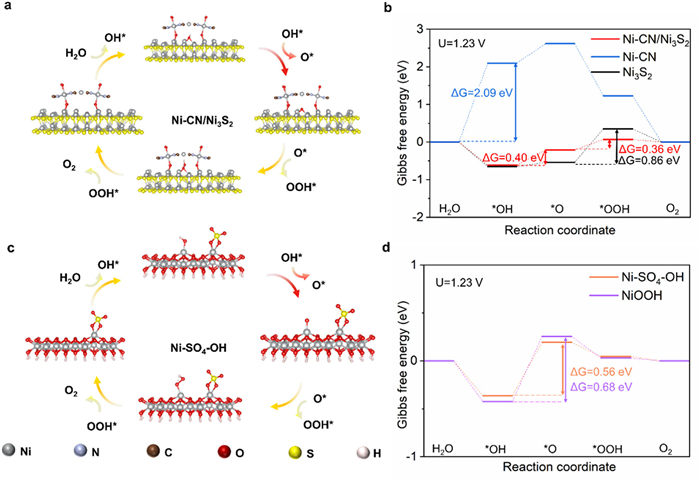
We tested in-situ Fourier transform infrared (in-situ FTIR) of Ni-CN/Ni3S2 under OER conditions to capture reactive atoms and identify the reaction mechanism. As shown in Fig. S18 (Supporting information), a clear and increasing infrared absorption band is observed around 1000 cm-1. which is related to the infrared absorption of *OOH. The absence of detectable *O—O intermediates conclusively excludes the involvement of both the lattice oxygen mechanism (LOM) and the oxide path mechanism (OPM). Above results indicates that Ni-CN/Ni3S2 tends to follow the traditional adsorbate evolution mechanism pathway [41,42]. Therefore, DFT calculations elucidated the enhanced OER activity of Ni-CN/Ni3S2. Three structural models (Ni-CN/Ni3S2, Ni3S2 and Ni-CN) were evaluated via the adsorbate evolution mechanism pathway (Fig. 4a, Figs. S19 and S20 in Supporting information) [43,44]. Ni-CN showed poor OER activity with a high RDS energy barrier (2.09 eV for *OH adsorption) indicated that it cannot be OER active site. For Ni3S2, the *O → *OOH conversion represented the RDS (0.86 eV). Remarkably, Ni-CN/Ni3S2 substantially reduced this barrier to 0.36 eV, demonstrating optimal adsorption/desorption characteristics (Fig. 4b). Ni-CN/Ni3S2's *O adsorption energy higher (0.40 eV) than Ni3S2 (0.11 eV), confirming the inhibitory effect of Ni—CN on Ni—O bonding, which provides theoretical support for SO42- anchoring in this structure, and this modification effectively modulated RDS while preserving active site functionality.
Figure 4
Figure 4.
(a) Optimized structural models of Ni-CN/Ni3S2 for different OER steps. (b) The DFT calculated Gibbs free energy diagrams of Ni-CN, RuO2 and Ni3S2 under U = 1.23 V. (c) Optimized structural models of Ni-SO4—OH for different OER steps. (d) The DFT calculated Gibbs free energy change diagrams and Ni-SO4—OH, NiOOH under U = 1.23 V.
The reaction barriers in reconstructed NiOOH (from Ni3S2) and Ni-SO4-OH (from Ni-CN/Ni3S2) phases (Fig. S21 in Supporting information and Fig. 4c) were also compared by DFT calculations. Both structures shared the same RDS (*OH→*O transition), but Ni-SO4-OH exhibited a 0.12 eV lower energy barrier (0.56 eV vs. 0.68 eV for NiOOH) (Fig. 4d). These results confirm that sulfur anchoring through SO42- incorporation effectively reduces the OER energy barrier. Unlike Ni3S2 which transforms into conventional NiOOH, the Ni-CN/Ni3S2 catalyst reconstructs into the more active Ni-SO4-OH structure. This unique reconstruction pathway accounts for the observed stability enhancement during long-term reaction.
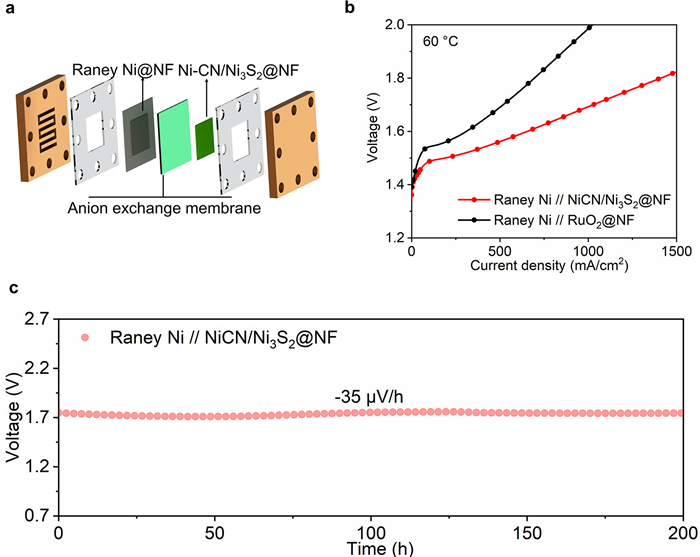
To examine the potential of Ni-CN/Ni3S2 for practical operation, we assembled an anion exchange membrane (AEM) electrolyzer (Fig. 5a) with a Ni-CN/Ni3S2@NF electrode as the anode and a Raney Ni electrode as the cathode, and tested its performance using 1 mol/L KOH at 60 ℃. As shown in Fig. 5b, the electrolyzer configured with Ni-CN/Ni3S2@NF and Raney Ni achieved a current density of 1 A/cm2 at 1.71 V, significantly outperforming the counterpart assembled with commercial Raney Ni//RuO2@NF (requiring 1.98 V to reach 1 A/cm2). Stability is a key factor for device integrity and a prerequisite for translating electrodes from lab to industrial production. Notably, the Ni-CN/Ni3S2@NF anode-based AEM device showed excellent long-term stability, which can operate at 1 A/cm2 under operating conditions for 200 h and voltage demonstrated a degradation rate of merely 35 µV/h (Fig. 5c). In summary, the sulfur-anchoring strategy enhances both the catalytic activity and stability, rendering the catalyst a promising candidate for commercialization.
Figure 5
Figure 5.
Performance of AEMWE device. (a) Schematic illustration of the structure of an AEM electrolyzer. (b) Polarization curves of an AEM electrolyzer employing Ni-CN/Ni3S2 as the anode and Raney Ni as the cathode at 60 ℃. (c) Chronopotentiometric curve of the Raney Ni//Ni-CN/Ni3S2@NF electrolyzer under a constant current density of 1 A/cm2.
In summary, we developed a C≡N bond sacrificial strategy that effectively inhibits sulfur leaching during OER. The as-prepared Ni-CN/Ni3S2 catalyst exhibits outstanding OER performance, requiring only 209 mV overpotential at 10 mA/cm2 and maintaining stability for 200 h at 100 mA/cm2. Moreover, In an AEMWE, the Ni-CN/Ni3S2 anode catalyst achieved an industrial current density of 1 A/cm2 at 1.71 V and demonstrated stable operation for 200 h. Raman and XPS analyses confirm surface reconstruction into Ni-SO4nullOH active species, which enhances OER activity. While reconstruction alters crystallinity and morphology, the sacrificial Ni-CN sites enable sulfur retention. DFT calculations demonstrate optimized oxygen intermediate adsorption and reduced energy barriers (0.36 eV for *O → *OOH) in Ni-CN/Ni3S2. The reconstructed Ni-SO4nullOH phase shows superior catalytic properties compared to conventional NiOOH. This work establishes a novel approach for controlling reconstruction processes to boost both activity and stability, with potential applications for preventing leaching of other elements (e.g., P, Se) in OER catalysts.
The authors declare that they have no known competing financial interests or personal relationships that could have appeared to influence the work reported in this paper.
Acknowledgments
This work was supported by the National Key Research and Development Program of China (Nos. 2024YFE0211400 and 2024YFF0507802), the National Natural Science Foundation of China (Nos. 12422401, 12074016, 12472360, 12102053 and 12274009), the Excellent Youth Fund of Beijing Natural Science Foundation (No. JQ24009), the Research and Development Project from Shanxi-Zheda Institute of Advanced Materials and Chemical Engineering (No. 2022SX-TD001).
Supplementary materials
Supplementary material associated with this article can be found, in the online version, at doi:10.1016/j.cclet.2025.111562.
C. Hu, G. Xing, W. Han, et al., Adv. Mater. 36 (2024) 2405763. doi: 10.1002/adma.202405763
[43]
M. Bajdich, M. García-Mota, A. Vojvodic, et al., J. Am. Chem. Soc. 135 (2013) 13521–13530. doi: 10.1021/ja405997s
[44]
H. Lei, L. Ma, Q. Wan, et al., Adv. Energy Mater. 12 (2022) 2202522. doi: 10.1002/aenm.202202522
Figure 1
(a) XRD pattern and (b, c) SEM image where green marks exhibit lamellar Ni-CN and blue marks exhibit flower-like Ni3S2. (d) HR-TEM images and (g) SAED pattern of Ni-CN in Ni-CN/Ni3S2. (e) HR-TEM image and (f) SAED pattern of Ni3S2 in Ni-CN/Ni3S2. (h, i) HAADF image and the corresponding EDS mapping images of Ni-CN/Ni3S2.
Figure 2
(a) LSV curves of Ni-CN/Ni3S2, RuO2, Ni3S2 with iR-corrected. (b) Overpotentials of Ni-CN/Ni3S2, RuO2, Ni3S2 at 10 mA/cm2 and 100 mA/cm2 in 1 mol/L KOH. (c) Tafel slopes for the corresponding samples presented in (a). (d) Comparison of Ni-CN/Ni3S2 with other advanced Ni3S2-based electrocatalysts. (e) Durability tests of Ni-CN/Ni3S2, RuO2 and Ni3S2 in 100 mA/cm2.
Figure 3
(a) Quantitative analysis of sulfur in Ni-CN/Ni3S2 and Ni3S2 electrolytes by ICP. (b) Raman spectra of Ni-CN/Ni3S2 under different potentials in 1 mol/L KOH. (c) S 2p, and (d) C 1s XPS spectra of Ni-CN/Ni3S2 before and after OER. (e, f) High and low-magnification SEM images. (g) SAED pattern. (h, i) HADDF-STEM image and the corresponding elemental mapping images of Ni-CN/Ni3S2 after the OER process.
Figure 4
(a) Optimized structural models of Ni-CN/Ni3S2 for different OER steps. (b) The DFT calculated Gibbs free energy diagrams of Ni-CN, RuO2 and Ni3S2 under U = 1.23 V. (c) Optimized structural models of Ni-SO4—OH for different OER steps. (d) The DFT calculated Gibbs free energy change diagrams and Ni-SO4—OH, NiOOH under U = 1.23 V.
Figure 5
Performance of AEMWE device. (a) Schematic illustration of the structure of an AEM electrolyzer. (b) Polarization curves of an AEM electrolyzer employing Ni-CN/Ni3S2 as the anode and Raney Ni as the cathode at 60 ℃. (c) Chronopotentiometric curve of the Raney Ni//Ni-CN/Ni3S2@NF electrolyzer under a constant current density of 1 A/cm2.


 DownLoad:

 下载:
下载:


 下载:
下载:

