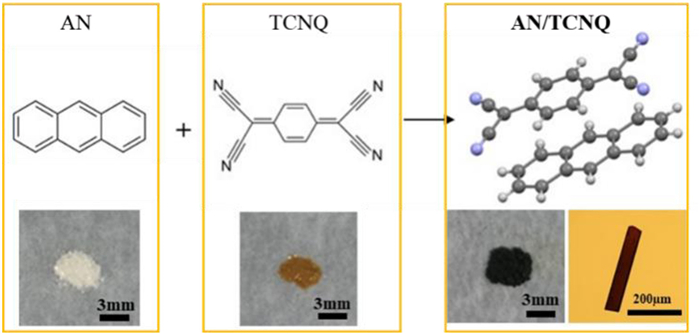
Figure 1.
Molecular structures and photographs of AN, TCNQ and AN/TCNQ.

Near-infrared photothermal conversion of a charge transfer cocrystal and its application in imaging and electrical switching
Ting Zou , Pan Shi , Xiao-Xu Liu , Xia-Lin Dai , Jia-Mei Chen , Tong-Bu Lu


Organic photothermal materials, which convert photoenergy to thermal energy through light-harvesting and non-emissive deactivation process, have attracted considerable interest in both basic science and practical applications [1–4]. Recently, charge transfer cocrystals of donor-acceptor molecular pairs, within which charge transfer from electron-sufficient donors to electron-deficient acceptors, have been utilized as a simple, effective and low cost means to construct high performance organic photothermal materials [5–8]. Accordingly, organic photothermal cocrystals hold great promise toward various applications, including photothermal imaging, photothermal therapy, seawater desalination, and so on [9–13]. However, the photothermal cocrystal materials are still very rare and in infancy. It is necessary to further explore them and develop more novel applications. Herein, a charge transfer cocrystal is designed based on an anthracene (AN, Fig. 1) donor (D) and a 7,7′,8,8′-tetracyanoquinodimethane (TCNQ, Fig. 1) acceptor (A). The AN/TCNQ cocrystal displays high performance of photothermal conversion for the application in imaging and electrical switching, which will provide novel insight into future photothermal applications.
AN/TCNQ cocrystal was prepared by a simple and convenient method. An equimolar mixture of AN and TCNQ was suspended in acetonitrile, and black powdered products of AN/TCNQ can be easily harvested with over 91% yields by filtration. Then rod-shaped black crystals of AN/TCNQ were obtained by evaporation of the above filtrates for about one week. Molecular structures and photographs of samples of AN/TCNQ and constituting molecules are shown in Fig. 1. It can be noted that powders of AN and TCNQ show white to earthy yellow colors, reflecting their poor or part optical absorptions over visible spectrum. In contrast, AN/TCNQ shows a solid black color demonstrating its good optical absorption for the entire visible spectrum. This clearly indicates that AN/TCNQ breaks the limitation on the narrow absorption of AN and TCNQ.
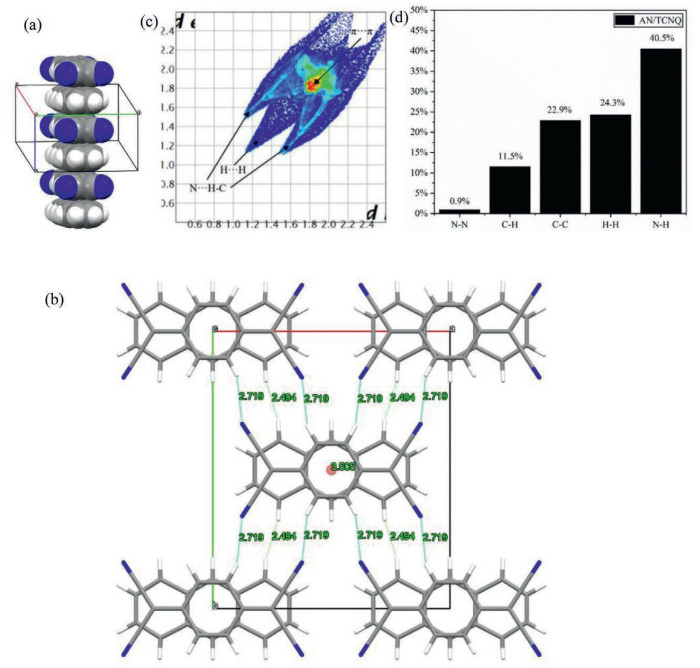
To elucidate details of various intermolecular interactions and crystal packing, the structure of AN/TCNQ was resolved by single crystal X-ray diffraction. The cocrystal belongs to the monoclinic C2/m space group with cell parameters of a = 11.5374(3) Å, b = 12.9884(3) Å, c = 7.0099(2) Å, α = 90°, β = 105.551(3)°, γ = 90° (Table S1 in Supporting information). As shown in Fig. 2, AN/TCNQ follows a typical mixed-stack pattern, wherein AN and TCNQ molecules alternatively adopt a face-to-face stacking motif, generating a columnlike structure along the c-axis (Fig. 2a). The distance between the center of AN and TCNQ molecules is 3.505 Å (Fig. 2b), indicating that there are significant D–A interactions between AN and TCNQ. Furthermore, there are obvious van der Waals (with H···H distances of 2.494 Å) between the adjacent AN molecules and C–H···N interactions (with distances of 2.719 Å) between the adjacent TCNQ molecules (Fig. 2b), which connect the neighboring columns together. Hirshfeld surface analysis based on the experimental crystal structure also demonstrates that the C−H···N, van der Waals and π···π contacts make most contribution to the cocrystal, with the percentage of 40.5% (H···N), 24.3% (H···H), and 22.9% (C···C), respectively (Figs. 2c and d). These intermolecular interactions and molecular arrangements promote the flow of electrons from AN to TCNQ, which makes the absorption spectrum of AN/TCNQ red shift relative to that of single component crystals.
Powder X-ray diffraction (PXRD) measurements were used to check the crystalline nature of bulk powdered samples of AN/TCNQ (Fig. 3a). The PXRD patterns of AN/TCNQ display peaks at 10.17°, 13.33°, 15.63°, 20.72°, 26.04° and 27.14°, which is obviously different from pristine donor and acceptor compounds and suggests the formation of new crystalline phase. In addition, all the peaks displayed in the experimental pattern are well matched with those in the simulated pattern from single crystal data, confirming phase purity and homogeneity of the cocrystal.
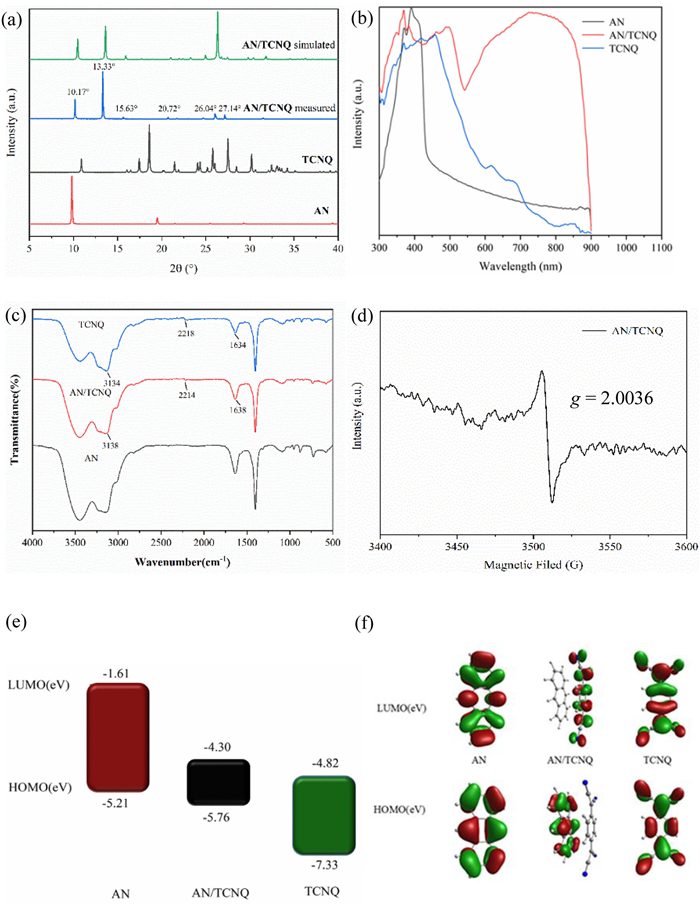
The photophysical properties of the cocrystal were then investigated. As shown in Fig. 3b, AN/TCNQ shows a broad absorption from 300 nm to 821 nm and displays a large red-shift absorption peak in near-infrared region compared to AN and TCNQ, which confirms the strong charge transfer interaction in the cocrystal [14]. Meanwhile, no significant photon emission was observed for AN/TCNQ (Fig. S1 in Supporting information), which indicates that non-radiative transition is the dominant process and thus implies potential in photothermal conversion. Fourier transform infrared (FTIR) spectroscopy (Fig. 3c) was further conducted to give some deep insights to the charge transfer state between AN and TCNQ. The vibration bands of 3134 cm−1 (C—H stretching), 2218 cm−1 (C≡N stretching) and 1634 cm−1 (C=C stretching) in TCNQ are shifted to 3138, 2214 and 1638 cm−1 in AN/TCNQ, demonstrating the increasing electron cloud density of benzene ring [15,16]. It reflects the π electron delocalization from AN to TCNQ and the existence of charge transfer state according to the previous reports [17,18]. Moreover, the electron spin resonance (ESR) spectrum (Fig. 3d) displays a strong signal with the corresponding g factor of 2.0036, showing the presence of unpaired electron, which is also in agreement with the charge transfer state of the cocrystal.
To better understand the mechanism of the photophysical properties, molecular orbital energy levels were estimated by density functional theory (DFT) calculation based on experimentally obtained crystal structures. The HOMO and LUMO energy levels of the cocrystal were calculated to be −5.76 eV and −4.30 eV, which are close to the HOMO of AN (−5.21 eV) and the LUMO of TCNQ (−4.82 eV) (Fig. 3e). The cocrystal has a narrow energy gap of 1.46 eV, which would broaden the light-harvesting ability in the absorption range and also lead to a high rate of nonradiative transition [19,20]. The corresponding wavelength of the calculated energy gap (1.46 eV) is 849 nm, which is consistent with cutoff edge of the experimental absorption spectrum (821 nm). The visualized HOMO diagram of the cocrystal shows that the electron cloud concentrates on the electron-donor AN, while the LUMO is focused on the acceptor TCNQ (Fig. 3f). These calculated results further confirmed that the charge transfer transition takes place from AN to TCNQ [21].
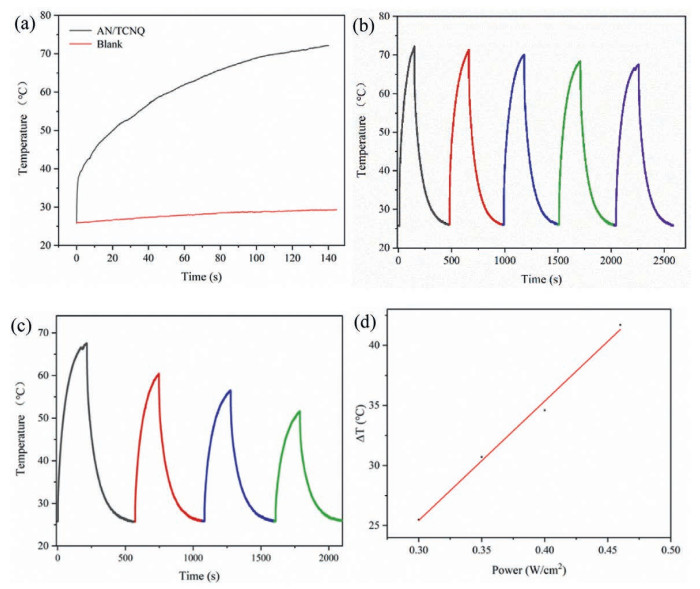
The efficient near-infrared absorption and poor photon emission of AN/TCNQ provides the essential condition for near-infrared photothermal conversion. The cocrystal powder was illuminated by 808 nm laser to evaluate its photothermal conversion performance. The temperature was recorded by an IR thermal camera. As shown in Fig. 4a, under the illumination of 808 nm laser (0.46 W/cm2), the temperature of the cocrystal is sharply increased and reaches as high as 72.1 ℃ in 145 s. In contrast, the blank control system rises only 3.4 ℃ under the same conditions (Fig. 4a). The photothermal conversion efficiency was calculated from the cooling curve by a previous method (Fig. S2 in Supporting information) [22]. The result reaches 58.3% and is relatively high as compared to the reported values of most organic cocrystal photothermal materials (Table S2 in Supporting information) [22–24]. Notably, the PXRD measurement of AN/TCNQ after laser irradiation (Fig. S3) shows that the crystal structure of this cocrystal remains stable with laser irradiation. As well, the cycling test (Fig. 4b) also demonstrates good photostability of the cocrystal and that may in favor of further applications. Fig. 4c shows the heating and cooling curves of the cocrystal at different powers. It indicates that ΔT of the cocrystal is proportional to the power of light excitation with a good linear relationship (Fig. 4d). This result demonstrates that photothermal conversion of AN/TCNQ can be modulated by the excitation power.
The excellent photothermal properties of AN/TCNQ makes it an intriguing candidate for photothermal imaging. A benzene ring fabricated with powdered sample of AN/TCNQ was irradiated under 808 nm laser and temperature increase was captured with an IR thermal camera (Fig. S4 in Supporting information). The cocrystal-patterned benzene ring could be captured at the beginning of irradiation, showing a high quality photothermal imaging effect. The benzene ring became more and more bright with irradiation time, indicating its great potential application in either real-time or time-resolved responses.
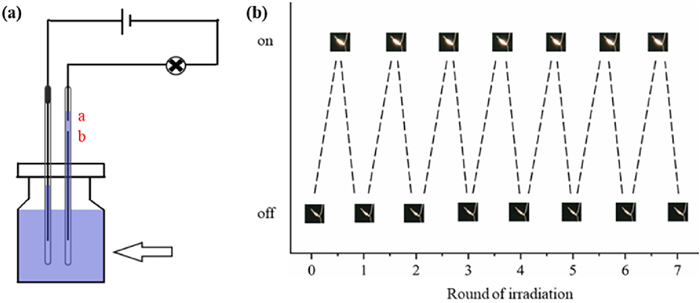
By taking advantage of the excellent light-to-heat conversion efficiency of AN/TCNQ, it was also used in a photo-sensitive electrical switch (Fig. 5). In this case, we saturated an aqueous suspension of AN/TCNQ with NaCl (0.1 mol/L) to make it conductive and then used it as fluidic medium. A switch was constructed from a small vial connected to a capillary containing two standard copper wires with a gap of 5 mm between two ends (a and b). When the solution was irradiated by 808 nm laser, it heated up and expanded along the capillary, bridging the gap between the two wires and completing an electrical circuit. The connection turned on a small light bulb. After turning off the laser irradiation, the solution level dropped and the light bulb was switched off. The electrical switch could be operated through five cycles of on and off without losing its performance (Fig. 5b), suggesting that it could be used to control electrical devices without requiring mechanical movement or large solid-state transistors.
In summary, a charge transfer cocrystal of AN and TCNQ was constructed by a simple and mild suspension method. This cocrystal has a strong D−A interactions and a small HOMO−LUMO gap (1.46 eV) and thus displays a broad absorption over 300–821 nm range. The near-infrared photothermal conversion performance was evaluated under 808 nm laser illumination and the conversion efficiency reaches 58.3%, with the temperature increases to 72.1 ℃ in 145 s. Subsequently, the cocrystal was successfully applied in time-resolved photothermal imaging and functional electrical device controlling. This work provides a novel application of photothermal cocrystal materials, which will further promote the development of new applications in related fields.
Ting Zou: Writing – original draft, Investigation. Pan Shi: Visualization, Validation, Methodology, Investigation, Formal analysis, Data curation. Xiao-Xu Liu: Formal analysis, Data curation. Xia-Lin Dai: Formal analysis, Data curation. Jia-Mei Chen: Writing – review & editing, Writing – original draft, Supervision, Resources, Funding acquisition, Conceptualization. Tong-Bu Lu: Supervision, Conceptualization.
The authors declare no competing financial interest.
This work was financially supported by National Natural Science Foundation of China (No. 22271220) and Graduate Education and Teaching Research and Reform Project of Tianjin University of Technology (No. YBXM2321).
Supplementary material associated with this article can be found, in the online version, at doi:
X.M. Cui, Q.F. Ruan, X.L. Zhu, et al., Chem. Rev. 123 (2023) 6891–6952. doi: 10.1021/acs.chemrev.3c00159
G.Y. Chen, J.M. Sun, Q. Peng, et al., Adv. Mater. 32 (2020) 1908537. doi: 10.1002/adma.201908537
J. Liu, Y.Y. Cui, Y.Y. Pan, et al., Angew. Chem. Int. Ed. 61 (2022) e202117087. doi: 10.1002/anie.202117087
T. Chen, C. Cai, L. Chen, et al., Chin. Chem. Lett. 36 (2025) 111028. doi: 10.1016/j.cclet.2025.111028
W.B. Chen, L. Dang, Z.C. Situ, et al., J. Phys. Chem. Lett. 13 (2022) 6571–6579. doi: 10.1021/acs.jpclett.2c01037
J.Q. Xu, W.B. Chen, S.K. Li, et al., Chin. Chem. Lett. 35 (2024) 109808. doi: 10.1016/j.cclet.2024.109808
J.C. Liu, T. Li, H.R. Yu, et al., Angew. Chem. Int. Ed. 64 (2025) e202413805. doi: 10.1002/anie.202413805
S.Y. Fu, D. He, X.T. Zhang, Sci. China Mater. 67 (2024) 242–250. doi: 10.1007/s40843-023-2691-9
X. Wang, Z.R. Wang, X. Wang, et al., Angew. Chem. Int. Ed. 63 (2024) e202416181. doi: 10.1002/anie.202416181
Y.T. Chen, M.P. Zhuo, X.Y. Wen, et al., Adv. Sci. 10 (2023) 2206830. doi: 10.1002/advs.202206830
S. Yang, Y. Li, F.Y. Kang, et al., Adv. Funct. Mater. 32 (2025) 202504976.
J. Zhang, F. Yang, L. Zhang, et al., Chin. Chem. Lett. 36 (2025) 110627. doi: 10.1016/j.cclet.2024.110627
M. Wei, J. Hu, F. Yu, et al., Chem. Eng. J. 508 (2025) 161089. doi: 10.1016/j.cej.2025.161089
F. Li, L. Zheng, Y. Sun, et al., Sci. China Chem. 66 (2023) 266–272. doi: 10.1007/s11426-022-1450-0
R. Li, J.F. Li, Y.J. Sun, et al., ChemPlusChem 84 (2019) 1245–1248. doi: 10.1002/cplu.201900197
H. Jiang, P. Hu, J. Ye, et al., J. Mater. Chem. C 6 (2018) 1884–1902. doi: 10.1039/c7tc04982j
A. Mandal, A. Choudhury, S. Sau, et al., J. Phys. Chem. C 124 (2020) 6544–6553. doi: 10.1021/acs.jpcc.0c00426
H. Sun, M.L. Wang, X. Wei, et al., Cryst. Growth Des. 15 (2015) 4032–4038. doi: 10.1021/acs.cgd.5b00656
S. Wang, Y. Zhu, Y. Zhao, et al., Chin. Chem. Lett. 36 (2025) 110555. doi: 10.1016/j.cclet.2024.110555
J. Michl, M. Klessinger, Excited States and Photochemistry of Organic Molecules, VCH Press, 1995, pp. 258–259.
H. Wu, Y. Sun, L. Sun, et al., Chin. Chem. Lett. 32 (2021) 3007–3010. doi: 10.1016/j.cclet.2021.03.045
Y. Wang, W. Zhu, W. Du, et al., Angew. Chem. 130 (2018) 4027–4031. doi: 10.1002/ange.201712949
D. Zhang, S. Li, S. Gao, et al., Chin. J. Chem. 42 (2024) 1563–1570. doi: 10.1002/cjoc.202300738
L. Zeng, L. Huang, Z. Wang, et al., Angew. Chem. Int. Ed. 60 (2021) 23569–23573. doi: 10.1002/anie.202108076

Figure 2 (a) ···DADADA··· mixed stacking pattern, (b) 3D packing pattern, (c) 2D fingerprint plots and (d) the percentage contributions to Hirshfeld surface area of various intermolecular contacts of AN/TCNQ.

Figure 3 (a) PXRD patterns, (b) absorption and (c) FTIR spectra of AN, TCNQ and AN/TCNQ. (d) ESR spectrum of AN/TCNQ. (e) The calculated energy diagrams and (f) molecular orbital diagrams of AN, TCNQ and AN/TCNQ.

Figure 4 (a) The photothermal conversion curves and (b) cycling tests of AN/TCNQ under 808 nm laser irradiation (0.46 W/cm2). (c) Heating and cooling curves of AN/TCNQ at different powers, and (d) the linear relationship between ΔT and 808 nm laser power for AN/TCNQ.

 扫一扫看文章


扫一扫关注我们
 DownLoad:

 下载:
下载:

 下载:
下载: