Chemistry and Chemical Engineering College Xinjiang Agricultural University, Urumqi 830052, China
b.
Institute for Science and Applications of Molecular Ferroelectrics, Key Laboratory of the Ministry of Education for Advanced Catalysis Materials, Zhejiang Normal University, Jinhua 321004, China
c.
Xinjiang Sub-Center National Engineering Research Center of Novel Equipment for Polymer Processing, Urumqi 830052, China
dawei@seu.edu.cn (D. Fu). 1 These authors contributed equally to this work.
Received Date:
18 March 2025 Accepted Date:
02 July 2025 Revised Date:
26 June 2025 Available Online:
15 October 2026
Abstract:
Molecular-based ferroelectrics have received extensive attention from materials scientists in recent years due to their light weight, high flexibility, and environmental friendliness. However, the precise design of molecular-based ferroelectrics by using crown ether supramolecular systems remains a huge challenge. In this work, L-valine (L-Val) and 18-crown-6 were selected as the guest and host molecules, respectively, for constructing crown ether complexes: [L-Val]2+(18-crown-6)3(H2O)2[FeX4]2- (X = Cl (1), Br (2)) by halogen modulation. The results indicated that compound 1 exhibits a reversible phase transition accompanied by symmetry evolution from P1 to I2/m at room temperature. The implementation of halogen substitution strategy resulted in compound 2 crystallizes in C2/m space group, and the phase transition temperature was changed by 30 K. Meanwhile, oscillations of supramolecular groups within the framework conferred significant coupled physical properties, including reversible dielectric anomalies, reversible magnetic transfers, spin crossovers (SCOs), the band gap value decreases, paraelectric–ferroelectric phase transitions, and a second-harmonic generation (SHG) response. In short, this work provides a brand new perspective on expanding the multifunctionality of crown ether supramolecular systems.
Phase-change materials (PCMs) are important multifunctional materials with a variety of physical properties and potential applications [1–4]. Especially, reversible PCMs with switchable properties modulated by rational molecular design have become immensely popular among researchers. Among them, multiferroic materials, as a type of special functional PCMs, have attracted considerable interest due to their excellent ferromagnetic, ferroelectric, and piezoelectric properties, machinability, and second-harmonic generation (SHG) effects [5–15]. In recent years, molecular multiferroics have received appreciable attention in the research community [16–22] and are even regarded as promising candidates for the replacement of ceramic multiferroics. Molecular based multiferroics have shown great application prospects in fields such as data storage and processing, intelligent sensors, and photovoltaics due to their lightweight, environmental friendliness, and high flexibility [23–26].
Crown ethers are typical host molecules that have long served an important role in research on molecular ferroelectrics [27–30]. In particular, crown-ether-based supramolecular rotators, an important branch of artificial molecular machines [31–36], are capable of various forms of energy conversion, such as thermal-kinetic, mechanical-electrical, or pressure-electrical energy conversion. Therefore, such systems with multifunctional synergistic characteristics have enormous research value. Notably, substitution strategies have been demonstrated to be effective design strategies for modulating phase transitions in hybrid crystals [37–40]. For instance, the substitution of hydrogen atoms in organic cations with heavier halogens usually increases the potential energy barrier for cation oscillations or rotations, which can directly affect the phase transition temperature of materials [41–45]. Tang et al. reported two ferroelectrics by anionic substitution, namely ([Hcha-(18-crown-6)]+[BF4]- and ([Hcha-(18-crown-6)]+[ClO4]- [46]. Compared with most previously reported molecular ferroelectrics, these two novel crown ether inclusion complexes exhibited better high-temperature reversible phase-transition behavior and large spontaneous polarization. Their excellent thermoelectric properties can contribute to the expansion of applications in modern materials. Xiong et al. synthesized a supramolecular host-guest compound [(CF3—C6H4—NH3)(18-crown-6)][TFSA] (where CF3—C6H4—NH3 is 3-(trifluoromethyl)aniline and TFSA is bis(trifluoromethylsulfonyl)amide) via H/F substitution [47]. The introduction of F atoms enabled the resulting compound to exhibit a greater SHG intensity, higher phase-transition temperature (Tc), and more pronounced piezoelectric response than the parent crystals.
Taken together, the results described above indicate a greater inclination towards the design and introduction of molecules with lower symmetry or the modification of molecules to achieve lower symmetry. For instance, H/F substitution [48], chiral molecules [49], and spherical molecules [50] will contribute to the formation of materials with better properties. Therefore, the reasonable selection of organic cations or inorganic anions may aid in research on the design of multifunctional materials with superior properties. Among various chiral materials, amino acid compounds are often preferentially considered. This is because amino acids, in addition to being basic molecules of life, are also naturally derived and possess good biocompatibility and environmental friendliness compared to other nitrogen-containing organisms [51–55]. In this work, L-valine (L-Val) was selected to serve as the rotor structure, as is well known, based on the "single chirality" principle proposed by ferroelectrochemistry, introducing chirality is an effective and universal strategy for the design of ferroelectric molecular chemistry, which greatly enhances the possibility of materials becoming ferroelectrics. Furthermore, L-valine, as a short-chain branched-chain amino acid, is more prone to rotation or distortion under temperature stimulation, thereby inducing the occurrence of phase transition. And utilized a Cl/Br substitution strategy for the synthesis of two novel amino-acid-based crown ether inclusion complexes [L-Val]2+[(18-crown-6)3(H2O)2][FeCl4]2- (compound 1) and [L-Val]4+[(18-crown-6)6(H2O)4][FeBr4]4- (compound 2) for the first time. Substitution of halogen atoms (from Cl to Br) induced a change of near 30 K upon phase transition temperature. When Cl was substituted with Br, the compound 2 undergoes a 2/mF1-type ferroelectric-paraelectric phase transition (Fig. 1a). In short, this work demonstrated that precise modification of compounds by halogen substitution in inorganic backbones is an effective way to modulate phase-transition temperature and optical, electrical, and magnetic properties, compounds 1 and 2 were compared with the previously reported crown ether inclusion complexes to highlight the novelty and improvement of this work (Table S1 in Supporting information).
Figure 1
Figure 1.
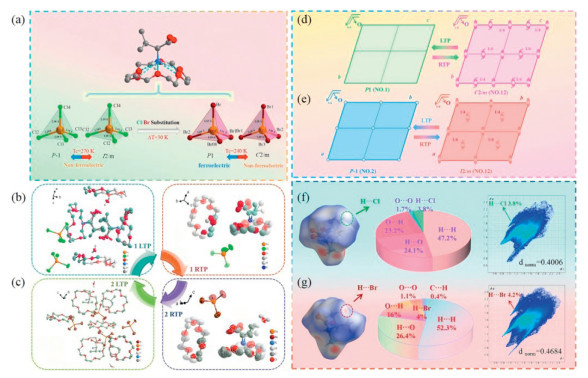
(a) Synthetic strategy for modulation of compounds 1 and 2 by Cl/Br halogen substitution. (b) Asymmetric unit of compound 1 at 100 K (left) and 293 K (right). (c) Asymmetric unit of compound 2 at 100 K (left) and 293 K (right). (d) Changes in space group symmetry operations of compound 1. (e) Changes in space group symmetry operations of compound 2. Hirshfeld surfaces and fingerprint plots of (f) compound 1 and (g) compound 2 at 100 K.
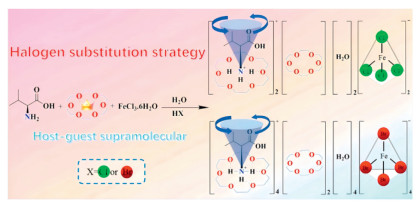
All chemicals and reagents used in the experiments were purchased and used directly without further purification. Scheme 1 shows a schematic diagram of the synthesis pathway. Variable-temperature single-crystal X-ray diffraction is a method commonly used for elucidating the microscopic mechanisms of phase transition by investigating structural changes at different temperatures [56,57]. The crystal structures of compounds 1 and 2 were determined at 293 K and 100 K (Table S2 in Supporting information). With an increase in temperature, both compounds 1 and 2 were transformed from triclinic to monoclinic crystal systems (Figs. 1d and e), and the lattice parameters exhibited significant differences. The obvious changes in space groups and lattice parameters further demonstrated the phase transitions of compounds 1 and 2. Figs. 1d and e show the changes in symmetry operations of compounds 1 and 2 before and after phase transition. With the substitution of halogen atoms, the crystal symmetry of compound 2 changed from C2/m (point group 2/m) at room temperature to P1 (polar point group 1) at low temperature. The marked change in crystal structure symmetry indicates the occurrence of a paraelectric–ferroelectric phase transition. It is hoped that these results can provide a novel approach for the design and construction of high-quality molecular ferroelectrics.
To facilitate analysis, 100 K and below was designated as the low-temperature phase (LTP), and 293 K was marked as the room-temperature phase (RTP). As shown in Fig. 1a, the L-Val guest molecules form supramolecular cations with the host 18-crown-6 molecules via N—H···O hydrogen bonds, and the charge is balanced by the introduction of [FeX4]- complex anions. At 100 K, the asymmetric unit of compound 1 (1-LTP) includes three 18-crown-6 molecules and two L-Val+ cations, two water molecules and two [FeCl4]- (Ⅲ) anions. Significant molecular disorder is observed in the L-Val+ cations. The C, O, and N atoms on the L-Val+ cation occupy two atomic positions, with the occupancy rates shown in Table S7 (Supporting information). Compared with the structure of 1-LTP, the asymmetric unit of 1-RTP consists of three-quarters of an 18-crown-6 molecule and half an L-Val+ cation, half a water molecule and half an [FeCl4]- (Ⅲ) anion. The structural composition of compound 1 at low temperature is four times that of the composition at room temperature (Fig. 1b). The asymmetric unit of compound 2 at 293 K (2-RTP) includes three-quarters of an 18-crown-6 molecule and half an L-Val+ cation, half a water molecule and half an [FeBr4]- (Ⅲ) anion. At a reduced temperature of 100 K, the asymmetric unit (2-LTP) consists of six 18-crown-6 molecules and four L-Val+ cations, four water molecules and four [FeBr4]- (Ⅲ) anions. The overall structure is completely ordered, with the structural composition eight times than that of the composition at room temperature (Fig. 1c). Compared with the completely ordered structure of 2-LTP, the L-Val+ cations in 2-RTP also exhibit severe molecular disorder. Hydrogen bond formation within the crystal and the order-disorder transformation, distortion of L-Val+ cations under temperature stimulation are the main driving forces of the crystal phase transition. This signifies that the phase-transition driving force is sufficient to modify the space symmetry, with the space group changing from P1 (LTP) to C2/m (RTP). In short, the structures of compounds 1 and 2 at room temperature are significantly different from those at low temperature, indicating the presence of internal mechanisms of phase transition. Its single chiral structure was also verified by solid circular dichroism (CD) chromatography (Fig. S4 in Supporting information).
Compounds 1 and 2 were synthesized by Cl/Br halogen modulation. Fig. S2 (Supporting information) shows the one-dimensional (1D) hydrogen bonding chain diagram along the crystallographic ac plane at 293 K. In the ab plane, both compounds 1 and 2 possess the supramolecular cation [(L-Val)+(18-crown-6)] as the planar unit at the upper and lower ends. The angle formed by the planar unit with the central 18-crown-6 molecule shows obvious changes between low- and room-temperature conditions (Fig. S1 in Supporting information). This suggests that the introduction of higher molar mass Br atoms leads to significantly changes in spatial structure. Compared with compound 1, the protonated L-Val of compound 2 undergoes order-disorder movement during the transition from LTP to RTP due to substitution with Br atoms. Consequently, significant changes occur in the bond lengths and angles, as well as the lengths of hydrogen bonds (Tables S3–S6 in Supporting information). Fig. S3 (Supporting information) shows the stacked charts of compounds 1 and 2 at 293 K. Upon measurement of the side lengths of the quadrilateral that has four adjacent iron atoms as vertices, it was found that compound 2 exhibits an overall trend of decrease compared with compound 1. This again demonstrates that the introduction of Br, which has a higher atomic number, leads to compression deformation of the metal framework. Therefore, it has been validated that the substitution of halogen atoms readily causes the expansion and deformation of the crystal framework, thus inducing changes in phase-transition temperature, as well as the optical and electrical properties. To further confirm and analyze the influence of halogen substitution on intermolecular interactions and phase transitions, we investigated the Hirshfeld surfaces and two-dimensional (2D) fingerprint plots of compounds 1 and 2 [58]. Each Hirshfeld surface is displayed using a red-white-blue color scheme, which indicates contacts with distances shorter than (red), equal to (white), and longer than (blue) van der Waals contacts, respectively [59]. Figs. 1f and g show that differences exist in the red-dotted regions in the Hirshfeld surfaces of compounds 1 and 2. This shows that changes occurred in the interactions between L-Val+cations and the surrounding molecules.
Tables S5 and S6 show the detailed hydrogen bonding parameters. From the percentages of the various hydrogen bonds, it can be inferred that N—H···O and O—H···O are the primary interactions leading to the formation of red depression within the supramolecule. The percentage of O···H decreased from 23.2% in compound 1 to 16.0% in compound 2, while dnorm exhibited a 16.92% increase from 0.4006 to 0.4684, The dnorm value of compound 2 is significantly higher than that of compound 1, indicating that the intermolecular non-covalent interaction is weaker and the potential energy barrier is lower, which is consistent with the result of its rotational potential energy. It is worth noting that the halogen anions exert a certain driving force in these interactions. The percentage of H···Cl interactions in compound 1 was 3.8% (Fig. 1f), and the percentage of H···Br interactions in compound 2 increased to 4.2% (Fig. 1g). Fig. S5 (Supporting information) shows the percentages of the other hydrogen bonds. These results suggest that the introduction of Br atoms strengthens the C—H···X interactions. It is therefore evident that Cl/Br halogen substitution indeed alters the spacing between H and X atoms, and enhances the interactions between the cations and inorganic backbone.
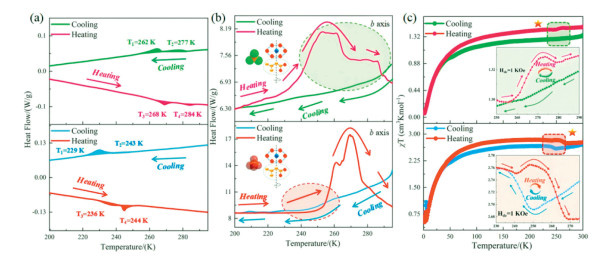
The reversible phase transitions of the two compounds were measured by differential scanning calorimetry (DSC), as shown in Fig. 2a. Entropy changes during the cooling–heating process were calculated by the formula ΔS = ΔH/Tc =RlnN [60]. The DSC curve of compound 1 exhibits two pairs of clearly reversible endothermic and exothermic peaks near room temperature at 262/268 K and 277/284 K. During the cooling process, ΔS1 = 0.38 J mol-1 K-1, ΔS2 = 1.61 J mol-1 K-1, N1 = 1.05, N2 = 1.21, ΔS3 = 0.69 J mol-1 K-1, ΔS4 = 1.42 J mol-1 K-1, N3 = 1.09, and N4 = 1.00. During the heating process, ΔS3 = 0.69 J mol-1 K-1, ΔS4 = 1.42 J mol-1 K-1, N3 = 1.09, and N4 = 1.00. These results demonstrate that compound 1 undergoes two sequentially reversible phase transitions. When Cl atoms are substituted by Br atoms, the DSC curve of compound 2 exhibits two pairs of adjacent reversible thermal anomaly peaks at 229/236 K and 243/244 K. During the cooling process, ΔS1 = 13.46 J mol-1 K-1, ΔS2 = 1.78 J mol-1 K-1, N1 = 5.05, and N2 = 1.24. During the heating process, ΔS3 = 0.17 J mol-1 K-1, ΔS4 = 0.92 J mol-1 K-1, N3 = 1.02, and N4 = 1.12. These results reveal that the phase-transition temperature of compound 2 differs by approximately 30 K from that of compound 1, contributing to a wider range of potential applications. DSC data indicate that the thermal energy curves of both compounds exhibit a thermal hysteresis of approximately 7 K. The sharp endothermic/exothermic peaks and narrow thermal hysteresis demonstrate that both compounds undergo a first-order phase transition. Large N values suggest the occurrence of significant structural changes with order-disorder characteristics. Such a structural characteristic is highly agreement with the results of variable-temperature single-crystal X-ray diffraction analysis [61].
Figure 2
Figure 2.
(a) DSC curves of compounds 1 (top) and 2 (bottom) during the heating-cooling cycle. (b) Temperature-dependent dielectric constants of compounds 1 (top) and 2 (bottom) during the heating-cooling cycle at 10 kHz. (c) Temperature-dependent magnetic susceptibilities of compounds 1 (top) and 2 (bottom) during the heating-cooling cycle.
Temperature-induced reversible phase transitions are usually accompanied by obvious dielectric anomalies. Therefore, the measurement of anomalies in the dielectric constant with changes in temperature is another important way to detect the phase-transition behavior of materials [62]. Figs. S9 and S10 (Supporting information) show the dielectric constant curves of compounds 1 and 2 along the a, b and c axes during cooling and heating processes. According to the test results, the dielectric constant changes of compounds 1 and 2 in the b axis direction are the most significant. This phenomenon might imply that the b axis is the polar direction of these two compounds. During the cooling-heating process in the b axis direction, the dielectric constant curve of compound 1 increases in a "stepped-peak" shape, and dielectric anomalies occur at 253 K and 286 K. This is agreement with the DSC results. The baselines of the dielectric constant curves during the heating and cooling processes are generally similar, indicating the presence of good cyclic reversible dielectric properties. For compound 2, the dielectric constant decreases gradually in the temperature range of 295–240 K during the cooling process. When the temperature decreases below 250 K, the dielectric constant stabilizes. During the heating process, the dielectric constant remains unchanged in the temperature range of 200–250 K. When the temperature increases above 250 K, the rate of increase of the dielectric constant is significantly elevated and exhibits a “step-spike” pattern of increase. The peak value is reached at approximately 265 K, after which the dielectric constant decreases gradually and levels off. This indicates that a dielectric anomaly occurs in compound 2 at approximately 250 K (Fig. 2b). It was also observed that the temperature at which the dielectric anomaly occurs during the cooling and heating processes are similar and show consistent changes within the temperature range of thermal anomalies in DSC. These results demonstrate that compound 2 also has cyclic reversible dielectric properties. Moreover, the dielectric anomaly temperatures of compounds 1 and 2 are consistent with the variation ranges of variable-temperature infrared and variable-temperature XRD, indicating that temperature changes induce stepwise changes in the dielectric curve by regulating the molecular conformation within the crystal structure and the intermolecular interactions. It is worth noting that with cyclic changes in temperature, the dielectric signal strengths of compounds 1 and 2 remain nearly constant after four cycles. This suggests that functional switches made from compounds 1 and 2 exhibit stable dielectric signals after multiple cycles, thereby validating their dielectric stability (Figs. S11a and b in Supporting information). Such electrical switches also provide further evidence of the occurrence of reversible phase transitions.
Given the presence of the flexible organic cations [L-Val]+ and magnetic inorganic anions [FeCl4]− or [FeBr4]− in the crystal structures, we hypothesize that compounds 1 and 2 provide good magnetic response in addition to their thermal, optical, and dielectric responses [63]. Magnetism is determined by the spin states at various positions and their coupling interactions. Therefore, local changes in structure and spin state induced by spin crossover (SCO) can be used to control the charge distribution and spin arrangement within the entire framework. This leads to the induction of synergistic effects between SCO and dielectric-ferroelectric functionality [64]. Therefore, we investigated the temperature-dependent magnetic susceptibilities of compounds 1 and 2 during the heating-cooling cycle in the temperature range of 2–300 K at a magnetic field of 1000 Oe (Fig. 2c). Fig. S13 (Supporting information) shows the detailed magnetic analysis. At 300 K, compounds 1 and 2 respectively show χT values of 1.47, 1.32 and 2.77, 2.68 cm3 K/mol during the cooling-heating process. In addition, temperature dependence is similar between the χT curves of compounds 1 and 2, which can be explained by the similarity in molecular structure between the two compounds. The sharp decline in χT at 50 K can be attributed to the zero-field splitting effect or weak intermolecular antiferromagnetic interactions, indicating that the magnetic responses of compounds 1 and 2 are mainly caused by the changes in the Fe3+ coordination environment, specifically manifested as the transformation of the spin state. Interestingly, the χT curves of compounds 1 and 2 clearly exhibit reversible magnetic-phase transition hysteresis near the phase-transition temperature, as shown in the insets of Fig. 2c. Both compounds 1 and 2 demonstrate good magnetic reversibility, with the magnetic hysteresis being approximately 7 K for compound 1 (T1 = 262 K, T2 = 255 K) and 11 K for compound 2 (T3 = 250 K, T4 = 239 K). The transition temperatures determined by magnetic measurements are generally consistent with Tc. This suggests that the magnetic characteristics originate from the reversible phase transitions of the compounds, which influence the degree of orbital angular momentum quenching and lead to the tuning of SCO. Our results indicate that halogen atom substitution leads to significant thermal-magnetic coupling effects in compounds 1 and 2 [65].
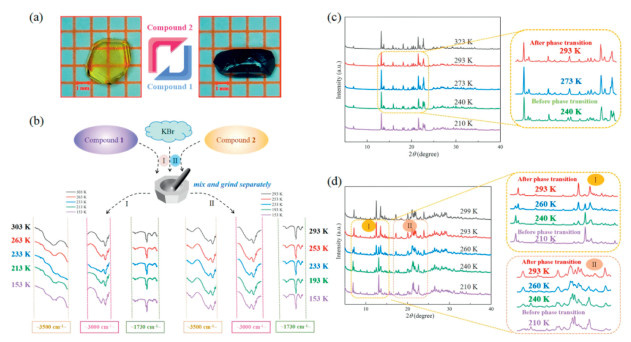
The phase purity of compounds 1 and 2 was verified by comparing the actual test values obtained by powder X-ray diffraction (PXRD) at room temperature with simulated values (Figs. S7a and b in Supporting information). Fig. S8 (Supporting information) shows the dehydration and decomposition temperatures of compounds 1 and 2 determined by thermogravimetric analysis (TGA). Decomposition is observed at approximately 430 K and 435 K for compounds 1 and 2, respectively, indicating good thermal stability in both compounds. Fig. 3a shows crystals of compounds 1 and 2. The room-temperature infrared (IR) and variable-temperature infrared (VT-IR) spectra (Fig. S6 in Supporting information) of compounds 1 and 2 were obtained with KBr pellets within the range of 4000–400 cm-1. Fig. 3b shows the VT-IR spectra of compounds 1 (left) and 2 (right). With a continuous decrease in temperature, the -OH stretching vibration peak of compound 1 at approximately 3500 cm-1 shows a significant decrease in intensity and broadening of the peak shape. It can be deduced that the slowing of thermal motion of free water molecules in compound 1 with a decrease in temperature leads to peak broadening and weakening of peak intensity. The -NH3+ stretching vibration peak at 3000 cm-1 exhibits a change in peak shape between 303 K and 233 K. Gradual fusion of the peak with the -OH stretching vibration peak leads to the formation of a broad peak. The peak shape and intensity of the C═O group at approximately 1730 cm-1 also shows significant changes with a decrease in temperature. Similarly, changes occur in the VTIR spectrum of compound 2 as the temperature decreases. The -OH stretching vibration peak at approximately 3500 cm-1 shows an increase in peak intensity and the occurrence of small split peaks between 303 K and 233 K. A possible reason is that the transition from room temperature to low temperature leads to an increase in free water molecules in compound 2, thereby causing an increase in the intensity of the -OH vibration peak. The -NH3+ stretching vibration peak at approximately 3000 cm-1 also exhibits a gradual increase in peak intensity and peak narrowing. The peak shape and intensity of the C═O group at approximately 1730 cm-1 becomes more pronounced with a decrease in temperature. This can be attributed to phase transition of the crystal structure, leading to molecular rotation within the crystal space. The resultant changes in chemical bonding ultimately cause the alteration of peak shape [66]. The IR and VT-IR data indicate that temperature changes affect the conformational changes of various molecules within the crystal structure, thereby providing a fundamental theoretical basis for elucidating the phase transitions and physical properties of compounds.
Figure 3
Figure 3.
(a) Large-sized crystals of compounds 1 and 2. (b) VT-IR spectra of compounds 1 (left) and 2 (right). PXRD spectra of (c) compound 1 and (d) compound 2.
Variable-temperature PXRD measurements of compounds 1 and 2 were performed to further validate the phase transition from LTP to RTP [67]. As shown in Figs. 3c and d, the PXRD diffraction peaks of compound 1 are similar in the range of 210–240 K. When the temperature increased to 240–293 K, subtle changes such as the disappearance or merging of individual diffraction peaks occurred. This demonstrates the presence of reversible structural changes and is agreement with the DSC curve of compound 1. For compound 2, the diffraction peaks at 7.21°, 13.12°, and 13.37° in region I disappeared or decreased abruptly when the temperature was increased to the range of 210–293 K. Diffraction peaks at 17.35°, 20.24°, 22.67°, and 22.38° in region II also exhibited shifts and a certain degree of splitting. When the temperature was increased above 293 K, the positions and intensities of the diffraction peaks of compound 2 remained almost identical without significant changes. This indicates that the structure transitions from low symmetry to high symmetry with a rise in temperature, which is consistent with the changes in space group symmetry operations of compound 2 (Fig. 1e). As expected, the changes in diffraction peaks are indicative of changes in the structures of compounds 1 and 2, and are consistent with the results of DSC analysis, thereby providing further confirmation of the structural phase-transition behavior of the compounds.
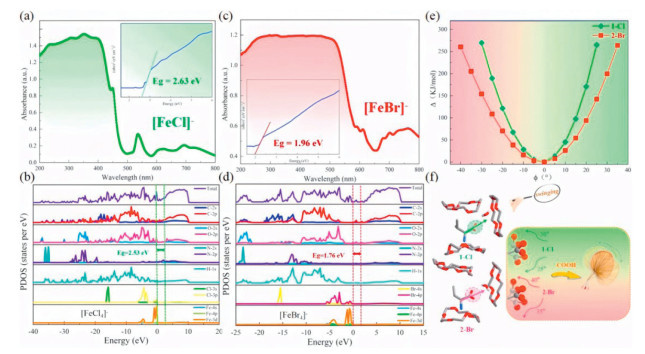
To achieve a better understanding of the cause of the different optical properties between compounds 1 and 2, solid-state ultraviolet-visible absorption (UV–vis) spectra from 200 nm to 800 nm were measured, and the densities of states were calculated [68]. Figs. 4a and c show the UV–vis spectra of compounds 1 and 2 and exhibit strong absorption peaks near 350 nm. Optical band gap (Eg) values of the compounds derived using the Tauc equation are 2.63 and 1.96 eV, respectively (insets of Figs. 4a and c). The electronic microscopic mechanisms of band gap generation were further investigated by calculating the total density of states (DOS) and partial density of states (PDOS) of compounds 1 and 2 based on density functional theory (DFT) calculations (Figs. 4b and d). Theoretically calculated energy band values were 2.53 and 1.76 eV, respectively, slightly smaller than the experimental values. This is because the generalized gradient approximation (GGA) functional tends to underestimate band gap values. Figs. 4b and d show that the peaks of the H-1s and C-2s/2p states in the PDOS spectra of compounds 1 and 2 are well-matched across nearly the entire energy range, suggesting that the C—H bonds in both compounds possess strong covalent bond characteristics. In the [FeCl4]- unit, the electronic states of Fe(Ⅲ) almost completely overlap with those of Cl, indicating the presence of strong bonding interactions in the Fe(Ⅲ)-Cl bond. Therefore, the band gap of compound 1 is primarily influenced by Fe and Cl. Similarly, in the [FeBr4]- unit, the electronic states of Fe(Ⅲ) are nearly matched with those of Br. This indicates that strong bonding interactions are also present in the Fe(Ⅲ)-Br bond. Further investigation revealed that the valence band maximum and the conduction band minimum of compound 2 are mainly controlled by the Br-4p and Fe-3d orbitals, suggesting that the band gap of compound 2 is primarily influenced by [FeBr4]−. More importantly, the Eg values of compounds 1 and 2 are smaller than those of several known excellent semiconductor materials, including [2-FBA]2PbCl4 (Eg = 3.62 eV) [69], [Cl-C6H4-(CH2)2NH3]2CdBr4 (Eg = 3.95 eV), and [Cl-C6H4-(CH2)2NH3]2CdCl4 (Eg = 4.25 eV) [70]. Therefore, a lower band gap can be achieved by substituting Cl with Br, contributing to the optimization of semiconductor properties. This provides a novel approach for the design and synthesis of novel semiconductor materials with coupled thermal, electrical, and magnetic functionalities.
Figure 4
Figure 4.
UV–vis absorption spectra and Tauc plots (inset) for (a) compound 1 and (c) compound 2, DOS and PDOS spectra for (b) compound 1 and (d) compound 2, (e) Oscillation potential energy plots for compounds 1 and 2, (f) Model for oscillation energy calculation.
Based on the DFT, the initial atomic coordinates were set to φ = 0 for the minimum potential energy [71] to calculate the oscillation energy of the carboxyl group (-COOH) of the L-Val molecules in compounds 1 and 2. Fig. 4f shows the calculation model. The calculations reveal that -COOH in compound 1 oscillates along the C—C axis in the range of −25° to +20° due to the presence of higher potential energy barriers. In contrast, oscillations of compound 2 occurred in the range of −35° to +30° (Fig. 4e). The results show that the Br atom-substituted complex forms a larger structural space around the supramolecular group, and oscillations of the group are more likely to induce excellent physical properties in compound 2.
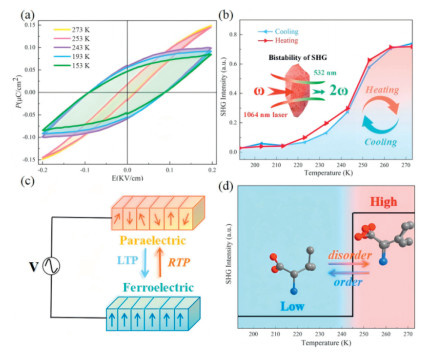
Before and after phase transition, compound 1 remains in the central space group through structural regulation of the halogen-iron-based complex. In contrast, the substitution of Cl with Br leads to an abrupt structural change in compound 2, with the room-temperature space group C2/m (point group 2/m, non-ferroelectric space group) changed to the low-temperature space group P1 (polar-ferroelectric space group). Ferroelectricity was confirmed by measuring the P-E (polarization-electric field) hysteresis loop along the a-axis (Fig. 5a). Fig. 5c shows the ferroelectric mechanism under temperature stimulation. At 243 K, the measured spontaneous polarization (Ps) value is approximately 0.092 µC/cm2, and the remnant polarization (Pr) value is approximately 0.060 µC/cm2. The Ps value is comparable to that of a recently reported ferroelectric, a C60S8 fullerene adduct (0.11 µC/cm2) [72]. In addition to dielectric switching, the switching response of SHG can serve as an excellent optical switch. As shown in Fig. 5b, the variable-temperature SHG data of compound 2 at 193–273 K demonstrate good reversibility. In LTP, the SHG intensity of compound 2 is estimated to be 0.028, indicating a low SHG intensity state. When the temperature is increased to 243 K, the SHG signal value rises sharply, and the SHG intensity increases from 0.297 to 0.714. Subsequently, the SHG intensity remains stable in RTP, exhibiting first-order phase-transition characteristics. The measurement results demonstrate that compound 2 undergoes a transition from a non-centrosymmetric to a centrosymmetric structure with a decrease in temperature. More precisely, compound 2 transitions from a nonpolar structure of the paraelectric phase (C2/m) to a polar structure of the ferroelectric phase (P1).
Figure 5
Figure 5.
Compound 2: (a) Ferroelectric hysteresis loops at different temperatures. (b) SHG intensity plots during heating-cooling cycles. (c) Temperature-stimulated cis-ferroelectric reversibility mechanism. (d) Simulation of SHG signals showing the high and low states during the heating process.
During the heating–cooling cycle, the ordered–disordered transition of L-Val cations in compound 2 triggers an SHG response. The bistability between the low-activity (SHG-low) and high-activity (SHG-high) states allows compound 2 to be well-suited for applications in the field of nonlinear optical materials (Fig. 5d). Through cyclic voltammetry (CV) testing, it was determined that the redox peaks of electrochemical properties of compounds 1 and 2 correspond to the electron transfer of Fe3+/Fe2+ within the anionic groups [FeCl4]- and [FeBr4]- [73]. The CV curves also exhibit high overlap after cycling is completed, further indicating that the electron transfer during the electrolysis process has good reversibility (Fig. S12 in Supporting information). Comprehensive electrical performance testing revealed that both materials are multifunctional semiconductor materials with switchable electrical, thermal, magnetic, and optical properties, as well as certain catalytic capacities. In particular, compound 2 exhibits excellent reversible paraelectric–ferroelectric properties as well.
In summary, we have constructed two novel L-valine-crown ether inclusion complexes with halogen-substituted iron-based complexes. With the substitution of Cl by Br in the [FeX4]- anion, the symmetry of the compound change from centrosymmetric to non-centrosymmetric space group, and the compound exhibits good ferroelectric and SHG response properties. The halogen-substituted compounds 1 and 2 show bistable state in thermal energy (DSC), dielectric properties, SHG response, and magnetic coupling induced by the oscillation of supramolecular groups. This demonstrates the feasibility of tuning the phase-transition temperature and physical properties of materials through simple structural modifications of small molecular anions. The Br-modified compound 2 showed a significantly larger range of changes in phase-transition temperature compared with compound 1, which enables broadening of the range of applicability to multifunctional switchable devices. This also indicates that halogen modification influences the internal spatial orientation and arrangement of crystals, leading to significant differences in the physical properties of compounds 1 and 2. In conclusion, the present work explored an effective pathway for obtaining novel phase-transition molecular-based paraelectric–ferroelectric materials by halogen substitution. The proposed design strategy offers new perspectives for the effective construction and structural modulation of multi-responsive integrated materials with coupled optical, electrical, thermal, and magnetic properties.
Declaration of competing interest
The authors declare that they have no known competing financial interests or personal relationships that could have appeared to influence the work reported in this paper.
This work was supported by General Program of Natural Science Foundation of Xinjiang Uygur Autonomous Region (No. 2022D01A76), Open Research Fund of Xinjiang Key Laboratory of Agricultural Chemistry and Biomaterials (No. KF202206), Key Research and Development Projects of Xinjiang Uygur Autonomous Region (Nos. 2022B02033–3, 2022B02049–3–3), National Natural Science Foundation of China (No. 21561030), Xinjiang “Tianshan talent plan” project (No. 2021061).
Supplementary materials
Supplementary material associated with this article can be found, in the online version, at doi:10.1016/j.cclet.2025.111530.
Figure 1
(a) Synthetic strategy for modulation of compounds 1 and 2 by Cl/Br halogen substitution. (b) Asymmetric unit of compound 1 at 100 K (left) and 293 K (right). (c) Asymmetric unit of compound 2 at 100 K (left) and 293 K (right). (d) Changes in space group symmetry operations of compound 1. (e) Changes in space group symmetry operations of compound 2. Hirshfeld surfaces and fingerprint plots of (f) compound 1 and (g) compound 2 at 100 K.
Figure 2
(a) DSC curves of compounds 1 (top) and 2 (bottom) during the heating-cooling cycle. (b) Temperature-dependent dielectric constants of compounds 1 (top) and 2 (bottom) during the heating-cooling cycle at 10 kHz. (c) Temperature-dependent magnetic susceptibilities of compounds 1 (top) and 2 (bottom) during the heating-cooling cycle.
Figure 3
(a) Large-sized crystals of compounds 1 and 2. (b) VT-IR spectra of compounds 1 (left) and 2 (right). PXRD spectra of (c) compound 1 and (d) compound 2.
Figure 4
UV–vis absorption spectra and Tauc plots (inset) for (a) compound 1 and (c) compound 2, DOS and PDOS spectra for (b) compound 1 and (d) compound 2, (e) Oscillation potential energy plots for compounds 1 and 2, (f) Model for oscillation energy calculation.
Figure 5
Compound 2: (a) Ferroelectric hysteresis loops at different temperatures. (b) SHG intensity plots during heating-cooling cycles. (c) Temperature-stimulated cis-ferroelectric reversibility mechanism. (d) Simulation of SHG signals showing the high and low states during the heating process.


 DownLoad:

 下载:
下载:


 下载:
下载:

