Scheme 1.
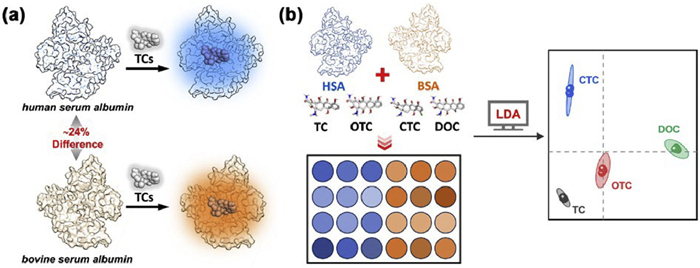
(a) The binding reaction between tetracyclines and albumins. (b) Schematic diagram of the albumin-based sensor array for tetracyclines discrimination.
Albumin-based fluorescent sensor array for differentiating of tetracyclines through host-guest recognitions
Zhongyong Xu , Jun Peng , Wenxing Zhang , Lei Wang , Xiongzhi Xiang , Bin Liu

Tetracyclines, including tetracycline (TC), oxytetracycline (OTC), chlortetracycline (CTC), and doxycycline (DOC), are broad-spectrum antibiotics effective against bacteria, atypical pathogens, and protozoan [1–3]. Their potent antibacterial properties drive widespread use in agriculture, aquaculture, and livestock industries. However, > 75% of tetracyclines residues are excreted in active form into the environment through urine, feces, and manure from animal after medication [4]. The residues of these tetracyclines in the environment fosters the proliferation and spread of antibiotic-resistant bacteria and superbugs, significantly increasing the difficulty and challenges faced by the healthcare system in managing infectious diseases [5]. On the other hand, different types of tetracyclines have different physicochemical properties (Table S1 in Supporting information), leading to variations in their toxicity [6,7]. Thus, the maximum residue limits (MRLs) for different tetracyclines vary significantly. For example, China stipulated the maximum sewage discharge of TCs for pharmaceutical industry, with 1.634 mmol/L for TC, 2.729 mmol/L for OTC, and 1.183 mmol/L for CTC (GB8978–1996). Therefore, there is an urgent need to develop a method capable of accurate detection and differentiation of tetracyclines.
Current analytical methods for tetracyclines detection, including enzyme-linked immunosorbent assays [8], capillary electrophoresis [9], surface-enhanced Raman scattering [10], fluorescence [11,12], and high-performance liquid chromatography [13], demonstrate high sensitivity but require repetitive operations for comprehensive analysis, significantly complicating multi-tetracycline detection procedures. The emergence of sensor array has addressed this challenge, offering a more comprehensive and versatile approach [14–17]. Sensor array, inspired by mammalian gustatory and olfactory systems, can provide an unique fingerprint pattern recognition for multitarget analytes [18–25]. Using pattern recognition algorithms, such as linear discriminant analysis (LDA) and hierarchical cluster analysis (HCA), these fingerprint patterns can be classified into distinct clusters, enabling effective discrimination and classification [26,27]. Recently, several fluorescent sensor arrays for tetracyclines have been reported, the detection of a single tetracycline and identification of different types of tetracyclines have been achieved (Table S2 in Supporting information) [28–35]. However, a simple, labor-saving, and easily accessible sensor array method that allows for the accurate distinction of different tetracyclines is still lacking.
Herein, we report an easily accessible sensor array that contains two common natural albumins. Previous research has demonstrated that the fluorescence of tetracyclines increases significantly when they form a complex with albumin through host-guest reaction, because tetracycline antibiotics can enter the hydrophobic binding cavities of albumin, limiting their rotation [36–38]. Based on this principle, we selected human serum albumin (HSA, purchased from the Sigma Aldrich) and bovine serum albumin (BSA) as sensing elements, due to their structural sequence difference of approximately 24% (Scheme 1a) [39,40]. Moreover, two albumins are readily accessible commercially and are available at a low cost. The binding interaction of these tetracyclines with albumins modulated the fluorescent response of the array, resulting in distinct fluorescent signals for each tetracycline species. Assisted by machine learning technique, this simple sensor array enables the simultaneous detection of four tetracycline species, as well as the recognition of different mixing ratios and the quantification of individual tetracycline species (Scheme 1b). Finally, this array successfully discriminated between different tetracycline species in real samples.
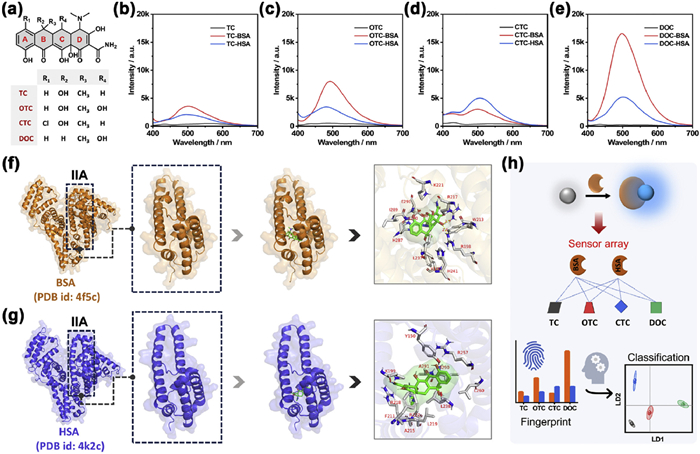
To confirm the albumin-based sensor array's effectiveness, we firstly studied the fluorescence spectra of tetracyclines binding to albumin. Each tetracycline species has multiple hydroxyl groups that allow it to bind to albumin (Fig. 1a). Figs. 1b–e reveals that tetracyclines exhibit minimal fluorescence in phosphate buffered saline (PBS) buffer but show an increase upon addition of albumin, due to the binding between tetracycline and the hydrophobic pocket of albumin. Notably, different fluorescence responses of tetracycline species to albumins were observed, due to different binding modes. Previous studies have demonstrated that tetracycline exhibits different binding constants with two albumins (Table S3 in Supporting information). To explore the binding interactions, we employed the molecular docking technique. Previous studies show tetracycline primarily binds to the IIA domain of albumin [11]. The docking results indicated that tetracycline undergoes conformational changes when entering the hydrophobic cavities of the two albumins (Figs. 1f and g, Fig. S1 in Supporting information). As illustrated in Fig. S2 (Supporting information), there are significant differences in the binding energies between different tetracyclines and albumin. Meanwhile, the hydrogen bonds formed by tetracyclines within the cavity vary depending on the specific type of tetracycline. The varying amino acid environments lead to unique fluorescence traits in the complexes, highlighting the different binding interactions of tetracycline toward albumins. After assessing the fluorescence response of tetracyclines with two albumins, we developed an albumin-based sensor array to differentiate between tetracycline species (Fig. 1h).
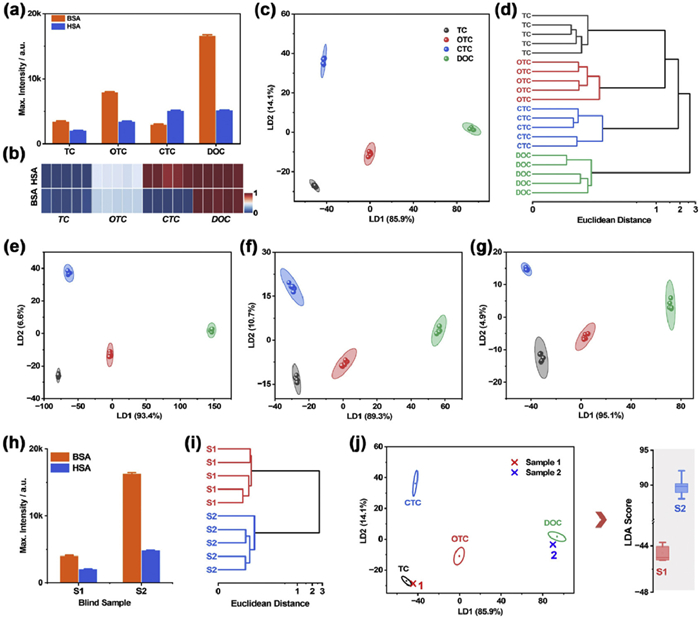
The detection performance of the array for tetracyclines was evaluated using the maximum fluorescence intensity of albumin-tetracycline complexes. Fig. 2a demonstrates that HSA and BSA produce distinct fluorescent responses to four different tetracyclines at a concentration of 20 µmol/L. The heatmap shows the unique fingerprints of these tetracycline species, enabling effective differentiation (Fig. 2b and Fig. S3 in Supporting information). The response patterns matrix (2 elements × 4 analytes × 5 replicates) was analyzed using LDA and HCA. Fig. 2c shows the LDA plot of the array, which produced four distinct clusters, achieving 100% classification accuracy for each tetracycline, as confirmed by cross-validation (Tables S4 and S5 in Supporting information). The HCA plot also correctly grouped all data without misclassification (Fig. 2d). Following the successful detection, we lowered the tetracycline concentration from 20 µmol/L to 3 µmol/L to test the identification capability of the array. Distinct heatmaps for each tetracycline concentration were generated and analyzed using LDA (Figs. 2e–g) and HCA (Fig. S4 in Supporting information). The analysis showed that all four tetracyclines were accurately distinguished without overlap, achieving 100% accuracy (Tables S6–S13 in Supporting information). These results highlight the strong ability of the array to discriminate between tetracyclines. Furthermore, two blind samples were used to further assess the predictive capability of the array for unknown samples. The two blind samples exhibited distinct fluorescent responses (Fig. 2h), and the raw data were accurately classified using an HCA plot (Fig. 2i). As illustrated in Fig. 2j, the two samples were correctly identified through an LDA plot (Table S14 in Supporting information). The aforementioned results indicate that the arrays can be used for the discrimination of unknown samples.
To assess the quantitative detection capabilities of the designed array, we recorded its fluorescence responses to individual tetracyclines at various concentrations, as shown in the radar charts (Fig. 3a and Fig. S5 in Supporting information). The array exhibited distinct responses to four different tetracycline species. Unique heatmaps for each tetracycline species were also generated (Fig. 3b and Fig. S6 in Supporting information). The LDA plot demonstrated that TC at different concentrations were accurately clustered without overlap (Fig. 3c). LD1 effectively described the distribution pattern of tetracyclines due to over 99% in the LDA. A strong linear regression was observed between LD1 and TC concentrations, ranging from 3 µmol/L to 20 µmol/L (R2 = 0.98) (Fig. 3d). Furthermore, similar linear correlations were noted for three additional tetracyclines (Fig. S7 in Supporting information). Specifically, the linear relationships between LD1 and the other tetracyclines were within the concentration range of 3–20 µmol/L, yielding R2 values of 0.98 for OTC, 0.96 for CTC, and 0.97 for DOC, respectively. The limits of detection were 2.82 µmol/L for TC, 1.83 µmol/L for OTC, 1.99 µmol/L for CTC, and 1.03 µmol/L for DOC. These findings indicate that the array possesses exceptional quantitative detection capabilities.
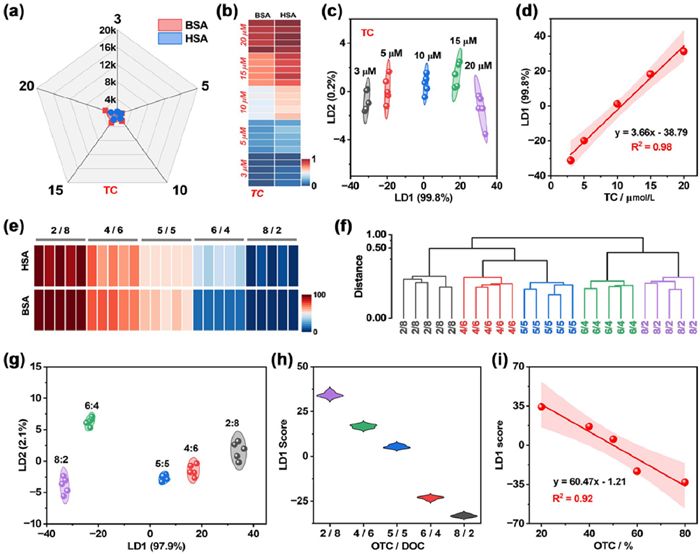
To showcase the array's ability to discriminate tetracycline mixtures, OTC-DOC mixtures at a total concentration of 20 µmol/L were tested. Fig. 3e presents a heatmap of the raw response data, revealing distinct color patterns for different mixtures, thereby highlighting the discrimination potential. Fig. 3f illustrates that the HCA plot accurately clusters these samples without errors. The LDA plot successfully classifies OTC-DOC mixtures with varying ratios (Fig. 3g and Tables S15 and S16 in Supporting information), while the violin plot emphasizes a significant difference in LD1 scores among these binary mixtures (Fig. 3h). Notably, a strong linear correlation is observed between the LD1 scores and the OTC content in the binary mixtures, which underscores the exceptional discriminative capability of the array for tetracyclines (Fig. 3i). These results demonstrate the potential application of the sensor array in real-sample analysis.
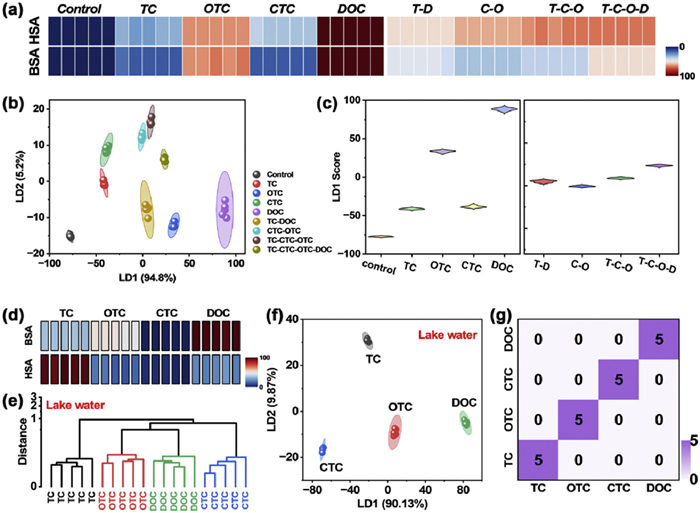
Given the alarming threat of tetracyclines residue in animal products and environment to human health, [41] the array was employed to explore the potential application in beef and lake water samples. Fresh beef was pretreated according to experimental section, and the resulting solution was used to evaluate the array through spiking analysis. Fig. 4a displays a distinct heatmap for four tetracyclines and their mixtures in the beef sample. The LDA plot shows clear group classification of the spiked samples with no overlap (Fig. 4b). Additionally, the violin plot in Fig. 4c highlights a significant difference LD1 scores between control and spiked samples. The HCA plot showed that tetracyclines and their mixtures could be clearly distinguished without any confusion or misclassification (Fig. S8 in Supporting information). Furthermore, the fluorescence response of the array to lake water sample was also detected and analyzed. From the heatmap in Fig. 4d, it becomes evident that the array can differentiate between tetracyclines. HCA plot exhibits no confusion for tetracyclines in water sample (Fig. 4e). As shown in Figs. 4f and g, as expected, each of the four tetracyclines was discriminated from each other. The interference resistance experiment demonstrated that common ions, amino acids, and proteins had no impact on the discrimination performance of the array, indicating that the array possesses excellent anti-interference capability (Fig. S9 in Supporting information). As shown in Tables S17 and S18 (Supporting information), the recovery rates ranged from 96.33% to 106.5% with RSD value (<1.56%). These results underscore the potential of the sensor array to discriminate tetracyclines and their mixtures in real samples.
In summary, we herein developed a protein-based sensor array for the differentiation of tetracyclines based on varying binding affinities between albumins and tetracyclines. Assisted by the machine learning techniques, this sensor array achieved a 100% identification accuracy for individual tetracyclines and their mixtures. Furthermore, this method can be utilized to differentiate tetracyclines and their mixtures in actual samples in the environment and food. The design strategy underlying this approach may offer a novel pathway for the advancement of innovative sensor arrays.
The authors declare that they have no known competing financial interests or personal relationships that could have appeared to influence the work reported in this paper.
Zhongyong Xu: Writing – original draft, Methodology, Formal analysis, Data curation. Jun Peng: Investigation. Wenxing Zhang: Supervision. Lei Wang: Supervision, Resources. Xiongzhi Xiang: Supervision, Data curation. Bin Liu: Writing – review & editing, Validation, Supervision, Project administration, Investigation.
We thank the financial supports from National Natural Science Foundation of China (No. 22377081), Shenzhen Science and Technology Program (No. JCYJ20230808105411023), Scientific Research Project of Education Department of Guangdong Province (No. 2022ZDJS067), the Scientific Research Project of Hanshan Normal University (No. 623012), and the Education Research Project of Hanshan Normal University (Nos. E22061, 521055). We also would like to acknowledge the help from Instrumental Analysis Center of Shenzhen University (Xili Campus).
Supplementary material associated with this article can be found, in the online version, at doi:
M.C. Roberts, Clin. Infect. Dis. 36 (2003) 462–467. doi: 10.1086/367622
Q. Liao, H.W. Rong, M.H. Zhao, et al., Sci. Total Environ. 757 (2021) 143981. doi: 10.1016/j.scitotenv.2020.143981
J. Leichtweis, Y. Vieira, N. Welter, et al., Process Saf. Environ. 160 (2022) 25–40. doi: 10.1016/j.psep.2022.01.085
L. Xu, H. Zhang, P. Xiong, et al., Sci. Total Environ. 753 (2021) 141975. doi: 10.1016/j.scitotenv.2020.141975
J. Scaria, K.V. Anupama, P.V. Nidheesh, Sci. Total Environ. 771 (2021) 145291. doi: 10.1016/j.scitotenv.2021.145291
J. Ye, Y. Du, L. Wang, et al., Toxins 9 (2017) 53. doi: 10.3390/toxins9020053
F. Ahmadijokani, H. Molavi, S. Tajahmadi, et al., Coord. Chem. Rev. 464 (2022) 214562. doi: 10.1016/j.ccr.2022.214562
W. Guo, L. Vilaplana, J. Hansson, et al., Biosens. Bioelectron. 163 (2020) 112279. doi: 10.1016/j.bios.2020.112279
P. Kowalski, J. Pharmaceut. Biomed. 47 (2008) 487–493. doi: 10.1016/j.jpba.2008.01.036
M. Rong, Y. Huang, C. Lin, et al., TrAC Trend. Anal. Chem. 178 (2024) 117839. doi: 10.1016/j.trac.2024.117839
M. Zhang, S. Zhang, Z. Xu, et al., Talanta 266 (2024) 124982. doi: 10.1016/j.talanta.2023.124982
Z. Zhang, H. Zhang, D. Tian, et al., Coord. Chem. Rev. 498 (2024) 215455. doi: 10.1016/j.ccr.2023.215455
P. Moudgil, J.S. Bedi, R.S. Aulakh, et al., Food Anal. Method 12 (2019) 338–346. doi: 10.1007/s12161-018-1365-0
J.R. Askim, M. Mahmoudi, K.S. Suslick, Chem. Soc. Rev. 42 (2013) 8649–8682. doi: 10.1039/c3cs60179j
Z. Xu, Y. Zhan, S. Zhang, et al., Chem. Commun. 61 (2025) 564–567. doi: 10.1039/d4cc05946h
S. Chen, X. Zhang, Y. Yu, et al., Chin. Chem. Lett. 32 (2021) 3043–3047. doi: 10.1016/j.cclet.2021.03.060
G. Wang, Q. Qiao, W. Jia, et al., Chin. Chem. Lett. 36 (2025) 110130. doi: 10.1016/j.cclet.2024.110130
J.J. Lavigne, E.V. Anslyn, Angew. Chem. Int. Ed. 40 (2001) 3118–3130. doi: 10.1002/1521-3773(20010903)40:17<3118::AID-ANIE3118>3.0.CO;2-Y
Y. Liu, T. Minami, R. Nishiyabu, et al., J. Am. Chem. Soc. 135 (2013) 7705–7712. doi: 10.1021/ja4015748
M. De, S. Rana, H. Akpinar, et al., Nat. Chem. 1 (2009) 461–465. doi: 10.1038/nchem.334
C.C. You, O.R. Miranda, B. Gider, et al., Nat. Nanotechnol. 2 (2007) 318–323. doi: 10.1038/nnano.2007.99
S. Rana, N.D.B. Le, R. Mout, et al., Nat. Nanotechnol. 10 (2015) 65–69. doi: 10.1038/nnano.2014.285
N. Das Saha, S. Pradhan, R. Sasmal, et al., J. Am. Chem. Soc. 144 (2022) 14363–14379. doi: 10.1021/jacs.2c05969
M.A. Ivy, L.T. Gallagher, A.D. Ellington, et al., Chem. Sci. 3 (2012) 1773–1779. doi: 10.1039/c2sc20083j
S. Hasegawa, T. Sawada, T. Serizawa, ACS Appl. Bio. Mater. 6 (2023) 4598–4602. doi: 10.1021/acsabm.3c00736
X.Y. Lu, H.P. Wu, H. Ma, et al., Anal. Chem. 96 (2024) 7959–7975. doi: 10.1021/acs.analchem.4c01639
S. Stewart, M.A. Ivy, E.V. Anslyn, Chem. Soc. Rev. 43 (2014) 70–84. doi: 10.1039/C3CS60183H
S. Lu, X. Dong, B. Zhang, et al., J. Mol. Liq. 351 (2022) 118371. doi: 10.1016/j.molliq.2021.118371
Y. Zhang, T. Wang, H. Guo, et al., Biosens. Bioelectron. 231 (2023) 115266. doi: 10.1016/j.bios.2023.115266
B. Liu, Z. Tang, J. Pan, et al., ACS Sens. 9 (2024) 433–443. doi: 10.1021/acssensors.3c02229
J. Zhu, Y. Wu, C. Xue, et al., Chem. Eng. J. 500 (2024) 156839. doi: 10.1016/j.cej.2024.156839
X. Zhou, H. Wu, X. Chen, et al., Food Chem. 438 (2024) 137983. doi: 10.1016/j.foodchem.2023.137983
J. Xu, X. Chen, H. Zhou, et al., Talanta 266 (2024) 125122. doi: 10.1016/j.talanta.2023.125122
L. Zhu, Q. Wu, X. Mei, et al., Adv. Compos. Hybrid Mater. 6 (2023) 221. doi: 10.1007/s42114-023-00805-2
B. Liu, J. Liu, J. Pan, et al., Sens. Actuators B: Chem. 397 (2023) 134671. doi: 10.1016/j.snb.2023.134671
M. Mukherjee, P. Saha Sardar, S.K. Ghorai, et al., PLoS One 8 (2013) e60940. doi: 10.1371/journal.pone.0060940
L. Ding, Y. Zhao, H. Li, et al., J. Hazard. Mater. 416 (2021) 125759. doi: 10.1016/j.jhazmat.2021.125759
S.K. Ghorai, S.K. Samanta, M. Mukherjee, et al., Inorg. Chem. 52 (2013) 1476–1487. doi: 10.1021/ic302218m
A. Bujacz, Acta Crystallogr. Sect. D 68 (2012) 1278–1289. doi: 10.1107/S0907444912027047
Y. Wang, F. Huo, C. Yin, J. Phys. Chem. B 128 (2024) 1121–1138. doi: 10.1021/acs.jpcb.3c06915
L. Charuaud, E. Jarde, A. Jaffrezic, et al., J. Hazard. Mater. 361 (2019) 169–186. doi: 10.1016/j.jhazmat.2018.08.075

Scheme 1 (a) The binding reaction between tetracyclines and albumins. (b) Schematic diagram of the albumin-based sensor array for tetracyclines discrimination.

Figure 1 (a) Chemical structures of tetracyclines. (b–e) Fluorescence spectra of tetracyclines (20 µmol/L) in the presence and absence of albumins (10 µmol/L). The binding model of TC with (f) BSA (PDB: 4f5s) and (g) HSA (PDB: 4k2c). (h) Schematics of albumin-based sensor array for discriminating tetracyclines.

Figure 2 Analytical performance of the array for tetracyclines. (a) The fluorescence response, (b) heatmap, (c) LDA plot, and (d) HCA plot of the array for tetracyclines at a concentration of 20 µmol/L. LDA plot of the array for tetracyclines at a concentration of (e) 10 µmol/L, (f) 5 µmol/L, and (g) 3 µmol/L. (h) The fluorescence response, (i) HCA, and (j) LDA score plot of the array toward two blind samples. Error bars represent the standard deviations calculated from five measurements. Eclipses represent confidence intervals at 95%.

Figure 3 (a) The radar maps of the array for TC with different concentrations. (b) Heatmap and (c) LDA plot of the array for TC with different concentrations. (d) Plot of LD1 score as function of the concentration of TC. (e) The heatmap, (f) HCA plot, (g) LDA plot, and (h) violin plot of the array for the binary mixture of OTC-DOC with the total concentration of 20 µmol/L. (i) The linear calibration plot between LD1 and the content of OTC in binary mixture. Eclipses represent confidence intervals at 95%.

Figure 4 Performance of the array for the discrimination of tetracyclines and their mixtures in real samples. (a) The heatmap, (b) LDA plot, and (c) violin plot of the array for tetracyclines and their mixtures in beef sample. (d) The heatmap, (e) HCA plot, (f) LDA plot, and (g) the confusion matrix of LDA of the array for tetracyclines with the total concentration of 20 µmol/L.

 扫一扫看文章

扫一扫关注我们
 DownLoad:
 下载:
下载:
 下载:
下载: