Received Date:
27 March 2025 Accepted Date:
27 June 2025 Revised Date:
20 June 2025 Available Online:
15 January 2026
Abstract:
Metal-support interaction (MSI) is crucial for fine-tuning the active-site structure of supported catalysts and enhancing performance. Here, we present an ammonia-directed reactive gas-metal-support interaction (RGMSI), in which NH3 reduces ZnO and assembles an anti-perovskite Ni3ZnN structure with interstitial nitrogen, significantly boosting hydrogenation efficiency. Nitrogen incorporation expands the lattice parameter, increasing the (111) lattice spacing from 2.04 Å in Ni to 2.18 Å in Ni3ZnN, with an extended Ni-Ni interatomic distance from 2.49 Å to 2.65 Å. Additionally, Ni-N coordination shifts the d-band center downward and induces electron deficiency in Ni via charge transfer. These modifications optimize reactant adsorption on the tailored Ni3ZnN structure compared to Ni, leading to a remarkable increase in 1,3-butadiene hydrogenation selectivity from 30.0% to 92.9%, along with an enhanced TOF from 0.067 s−1 to 0.079 s−1. These findings highlight RGMSI as a versatile and effective strategy for designing supported metal catalysts, offering new insights into selective hydrogenation catalysis.
Metal-support interaction, achieved through charge or material transfer across the metal-support interface, is a key strategy for regulating the structure and performance of supported catalysts [1-5]. Reactive metal-support interaction (RMSI) is one such approach that incorporates support components into the supported metal to form alloys, thereby tuning both the electronic and geometric properties of the catalysts [6,7]. Early studies on metal-oxide systems, such as Pd-ZnO, revealed excellent CO selectivity in methanol steam reforming, which was attributed to the formation of PdZn intermetallic compounds under reaction conditions [8,9]. These discoveries motivated further research into forming alloy structures by selecting suitable supports and applying specific pretreatments. For instance, PtZn/ZnO and PdIn/In2O3 catalysts have demonstrated superior performance in selective hydrogenation of crotonaldehyde and methanol steam reforming reactions [10,11]. More recently, RMSI has been expanded to non-oxide supports like carbides, enabling the incorporation of support elements at moderate conditions to form Pt-based alloys [12-14]. Additionally, RMSI has demonstrated atomic-scale precision in structural control. For example, with increasing temperatures, surface reconstruction occurs in Pd2Ga supported on Ga2O3, transitioning from continuous Pd3 to isolated Pd1 arrangements [15]. These studies highlight the potential of RMSI for precise control over alloy structures and active sites, thereby expanding its application in the regulation of catalyst performance.
Compared to RMSI, which alters atomic arrangements and coordination through compositional substitution in alloying and transfers these properties to the surface to regulate reaction behaviors. Recent studies have found that the subsurface interstitial sites of metals can be occupied by light elements dissociated from reactant molecules, forming metastable structures under reaction conditions [16-19]. These interstitial atoms can regulate the metal structure without changing the surface atomic arrangement and even participate in reactions, potentially altering catalytic performance. For instance, the published works have shown that subsurface hydrogen atoms in Ni can react with ethylene to produce ethane, whereas surface hydrogen remains unreactive [20,21]. Similarly, Schlögl and co-workers demonstrated that Pd catalysts form PdCx and PdHx subsurface structures under different reaction conditions and showed selectivity for alkene and alkane products, respectively [22,23]. These studies have prompted further exploration into regulating metal structures and surface reactions through subsurface interstitial atoms. Our group has also introduced interstitial carbon atoms into Ni using an interstitial site modulation approach, resulting in Ni3ZnC0.7 and Ni3GaC0.5 structures that exhibited excellent selectivity in hydrogenation reactions [24,25]. The interstitial atom regulation was subsequently extended to fabricate Ni3InC0.5 and Ni3GaCx catalysts, which demonstrated enhanced performance in CO2 hydrogenation and dry reforming of methane [26,27]. Consequently, interstitial atom modification is gradually emerging as an effective strategy to regulate active-site structure and performance in heterogeneous catalysis [28-30].
RMSI is characterized by introducing support elements into metals to form alloys and thus constrained by the composition of the support, typically resulting in bimetallic alloys that rely on precise control of element ratios to regulate active sites. Additionally, the heterogeneity of particle sizes and metal-support interfaces, along with the solid solution ranges in bimetallic alloys, limits precise control in RMSI [31,32]. Therefore, based on the investigations of RMSI and interstitial atoms, we propose an approach that applies additional control to establish a reactive gas-metal-support interaction (RGMSI), in which support reduction and interstitial atom introduction occur simultaneously through specific gaseous treatments. Given the characteristics of this strategy, small molecules containing hydrogen and light elements (e.g., hydrocarbons and ammonia), which serve as both reductants and structural components, become promising choices. Among these, ammonia offers advantages, as the excess nitrogen atoms can desorb as nitrogen gas, thereby avoiding active site coverage and deactivation, issues potentially encountered in carbon-based systems [33].
Herein, following this approach, we achieve support reduction and interstitial nitrogen introduction simultaneously by treating a Ni/ZnO system with NH3, thereby constructing an anti-perovskite Ni3ZnN structure (Fig. 1a). The catalysts obtained via RMSI and RGMSI were characterized using X-ray diffraction (XRD) and transmission electron microscopy (TEM) to identify their phase structures and microstructural features. The composition and elemental distribution of the Ni-based nanoparticles (NPs) were further analyzed through electron energy loss spectroscopy (EELS) and energy dispersive X-ray spectroscopy (EDX)-mapping. Furthermore, X-ray photoelectron spectroscopy (XPS) and X-ray absorption fine structure (XAFS) spectroscopy techniques were employed to elucidate changes in the electronic and coordination structures of Ni, accompanied by theoretical calculations of the density of states (DOS) and d-band center after the introduction of Zn and N. These observed structural variations were correlated with the catalytic performance in 1,3-butadiene hydrogenation reaction. The established RGMSI aims to offer an additional dimension of control, allowing for more comprehensive tuning of supported catalyst structures.
Figure 1
Figure 1.
(a) Schematic illustration of the synthesis approaches for Ni3Zn/ZnO and Ni3ZnN/ZnO catalysts via RMSI and RGMSI, respectively. (b) XRD patterns of Ni/ZnO, Ni3Zn/ZnO, and Ni3ZnN/ZnO catalysts. (c, d) TEM images of the synthesized Ni3Zn/ZnO and Ni3ZnN/ZnO catalysts, respectively, with insets showing the PSD histograms of the Ni3Zn and Ni3ZnN NPs.
ZnO nanorods with a uniform rod-like morphology were synthesized using a hydrothermal method (Fig. S1 in Supporting information). These nanorods served as a support to uniformly anchor Ni species and provide a potential source of zinc for fabricating Ni-Zn-based structures. XRD patterns and TEM images (Figs. S2 and S3 in Supporting information) confirmed the characteristic wurtzite structure of the ZnO nanorods, which primarily expose the (100) facets. Ni was then loaded on the calcined ZnO nanorods through a typical impregnation method, followed by air calcination at 400 ℃ to yield NiO/ZnO catalyst. The XRD pattern (Fig. S4 in Supporting information) indicates that the Ni species were fully oxidized to NiO phase (Fm3m, PDF #97–064–6096) after annealing in air. TEM image and the corresponding particle size distribution (PSD, Fig. S5 in Supporting information) further revealed that the NiO NPs were uniformly distributed on ZnO nanorods, with an average size of approximately 9.9 nm (5 wt% loading).
Subsequently, the structural evolution of the NiO/ZnO catalyst under various chemical environments was investigated using XRD. As shown in Fig. 1b, in addition to the diffraction peaks corresponding to the ZnO support, the new peaks appeared at 44.5° and 51.8° following reduction in a hydrogen atmosphere at 350 ℃, confirming the formation of monometallic nickel (Fm3m, a = b = c = 3.52 Å, PDF #97–026–0169). When the reduction temperature was elevated to 500 ℃, the (111) and (200) peaks shifted to lower angles at 43.7° and 50.9°, respectively. These shifts indicate the formation of Ni3Zn structure (Pm3m, a = b = c = 3.58 Å, PDF #04–004–4485), demonstrating that RMSI facilitate the alloying of Ni and Zn. Upon treatment in an NH3 atmosphere at 500 ℃, the characteristic peaks associated with Ni3ZnN structure (Pm3m, a = b = c = 3.78 Å, PDF #97–018–3370) emerged. This result suggests that hydrogen atoms generated from adsorbed NH3 on the Ni surface and promote the reduction of ZnO and alloying with Ni, with simultaneous incorporation of nitrogen atoms to assemble the Ni3ZnN structure via RGMSI. Specifically, the (111) and (200) peaks shifted from 44.5° and 51.8° to 41.3° and 48.1°, indicating an increase in plane spacing from 2.04 Å and 1.76 Å to 2.18 Å and 1.89 Å, respectively. This expansion of the plane spacing in Ni3ZnN reflects the significant increase in lattice parameters following the incorporation of Zn and N atoms. The above XRD results revealed the effects of RMSI and RGMSI on tuning the phase structures of Ni-based catalysts.
The microstructure of above-prepared three catalysts was further investigated using TEM equipped with EDX and EELS. As shown in Figs. 1c and d, and Fig. S6 (Supporting information), TEM results indicate that the ZnO nanorods in both Ni/ZnO and Ni3ZnN/ZnO catalysts retained their original morphology and size, while significant morphological changes were observed in the ZnO nanorods of Ni3Zn catalyst. The Ni-based NPs were uniformly distributed on the ZnO support in all three catalysts, with particle sizes ranging from ~8 nm to 10 nm. The uniform size of the NPs allows for an accurate assessment of structural variations on catalytic reactions, effectively minimizing influences related to size effects. High-resolution TEM (HRTEM) was subsequently employed to analyze the atomic-scale microstructure of the catalysts. As depicted in Figs. 2a–c, HRTEM images and their corresponding fast Fourier transforms (FFTs) reveal that the observed NPs exhibit a single-crystalline structure. Furthermore, as Zn and N were incorporated into Ni, forming Ni3Zn and Ni3ZnN, their lattice parameters increased sequentially. This increase was indicated by the (200) lattice spacing, which expanded from 1.76 Å in Ni to 1.77 Å in Ni3Zn and further to 1.89 Å in Ni3ZnN (Fig. S7 in Supporting information), consistent with the XRD results. The HRTEM results also showed that Ni and Ni3Zn NPs were prone to oxidation during ex-situ characterization, forming a relatively thick oxide layer. In contrast, the Ni3ZnN structure exhibited improved oxidation resistance, with only a thin oxide layer on the surface. Additionally, slight morphological differences were observed among the NPs. The Ni and Ni3Zn NPs displayed a spherical shape, primarily exposing the (111) and (200) facets, whereas Ni3ZnN NPs tended to expose a greater proportion of (200) facets.
Figure 2
Figure 2.
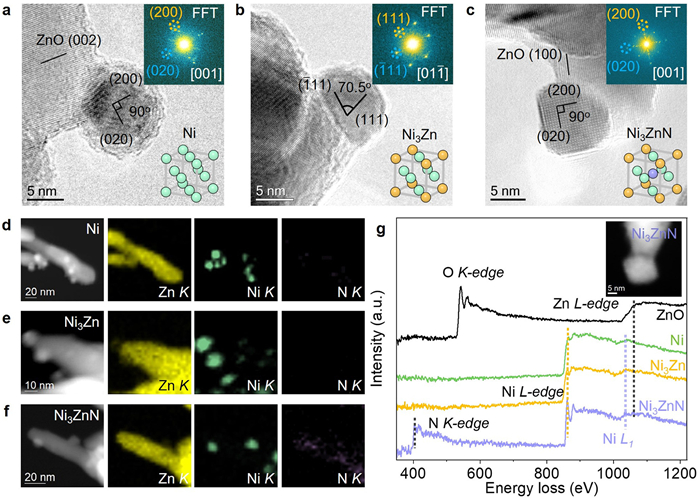
HRTEM images of the representative Ni (a), Ni3Zn (b), and Ni3ZnN (c) NPs. The insets show the corresponding FFT patterns (top-right) and schematic unit cell structures (bottom-right) for Ni, Ni3Zn, and Ni3ZnN, respectively. HAADF-STEM images and corresponding EDX elemental maps of Ni/ZnO (d), Ni3Zn/ZnO (e), and Ni3ZnN/ZnO (f) catalysts, respectively. The yellow, green, and purple colors represent the Ni, Zn, and N elements, respectively. (g) The EELS spectra of Ni, Ni3Zn, Ni3ZnN, and ZnO, and the inset shows the STEM image of the selected region in Ni3ZnN/ZnO.
The EDX elemental mapping reveals a uniform distribution of Ni within the Ni-based NPs, with Zn largely localized in the ZnO support for the Ni-based catalysts (Figs. 2d–f). However, in Ni3Zn and Ni3ZnN catalysts, Zn is distributed throughout Ni3Zn and Ni3ZnN NPs, suggesting that RMSI induces Zn migration and alloying with Ni from the ZnO support. In the case of Ni3ZnN, a homogeneous distribution of N across the Ni3ZnN NPs (Fig. 2f) confirms the incorporation of N atoms facilitated by RGMSI. To further validate the presence of these elements, EELS analysis was employed for localized elemental characterization. As shown in Fig. 2g, the EELS spectra of Ni3ZnN exhibits Ni L-, Zn L-, and N K-edges signals, corroborating the presence of Ni, Zn, and N elements as observed in EDX analysis. For comparison, only Ni signals are detected in the Ni catalyst, while both Ni and Zn signals are present in Ni3Zn.
As shown in Fig. S8 (Supporting information), the N K-edge spectrum of Ni3ZnN presents four distinct peaks, aligning well with the simulated result. Analysis of the projected density of states (PDOS) in Fig. S9 (Supporting information) reveals that the peaks observed at 398, 400, and 407 eV correspond to unoccupied states resulting from the hybridization of N 2s/2p orbitals with Ni 2p/3d orbitals. The broader peak centered around 415 eV is attributed to electron backscattering from the nearest coordination shell around the ionized nitrogen atom [34]. Notably, the N K-edge spectrum of Ni3ZnN exhibits an approximately 2 eV shift to lower energy compared to the boron nitride reference spectrum, indicating a pronounced p-d hybridization between N 2p and Ni 3d orbitals. This hybridization alters the valence electron density and leads to a reduction in the valence state of N atoms. XRD and TEM analyses further confirm the successful synthesis of Ni3ZnN through the RGMSI approach, which is characterized by an expanded lattice parameter and increased Ni-Ni interatomic distances due to nitrogen incorporation, relative to the Ni3Zn structure synthesized via RMSI.
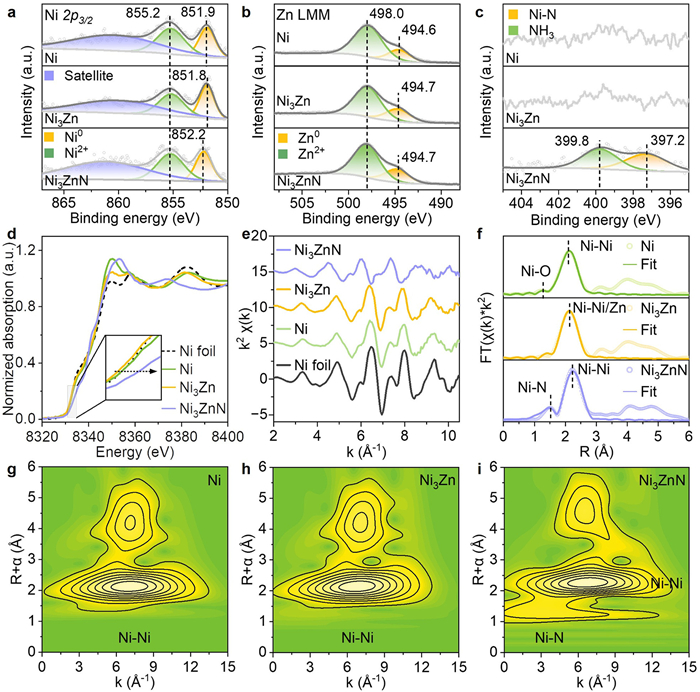
In addition to the geometric effect of interatomic distance on adsorption, electronic modifications directly influence the interaction between reactants and active sites, thus impacting catalytic performance. Thus, to explore the electronic structure variations of the Ni-based catalysts, we performed XPS measurements. As displayed in Fig. S10 (Supporting information), the Ni 2p, Zn 2p, and N 1s peaks in the XPS spectrum confirm the presence of Ni, Zn, and N in Ni3ZnN catalyst, and Ni and Zn in Ni3Zn catalyst. Deconvolution of the Ni 2p3/2 XPS spectra for each catalyst revealed three peaks (Fig. 3a), corresponding to Ni0, Ni2+, and satellite peaks, respectively. In the monometallic Ni catalyst, the prominent peak of metallic Ni (Ni0) appears at 851.9 eV. However, the migration of Zn atoms from ZnO support to Ni via RMSI after reduction at 500 ℃ [31,35], resulting in the formation of Ni3Zn alloy, causes a slight shift in the Ni0 peak to a lower binding energy (from 851.9 eV to 851.8 eV), attributed to electronic effects from Ni-Zn alloying. Notably, the formation of Ni3ZnN leads to the Ni0 peak shift to a higher binding energy by 0.4 eV, reaching 852.2 eV. This shift indicates significant electronic interaction and charge transfer between Ni and N atoms. Two peaks at 855.2 and 860.4 eV, corresponding to oxidized Ni (Ni2+ and satellite peak), are also observed, likely due to slight oxidation from air exposure. The Zn LMM Auger spectra in Fig. 3b show two main peaks at ~494.6 and 498.0 eV, representing metallic Zn0 and ZnO species. Semiquantitative analysis of peak areas indicates a slightly higher metallic Zn0 content in Ni3Zn/ZnO and Ni3ZnN/ZnO than that in Ni/ZnO catalysts (Table S1 in Supporting information), suggesting greater Zn reduction from the ZnO support during RMSI and RGMSI. The alloying and N incorporation both shift the binding energy of Zn0 from 494.6 eV to 494.7 eV, indicating the transfer charge mainly occurs between N with Ni rather than the reduced Zn species. Meanwhile, the N 1s XPS spectra of the Ni3ZnN structure (Fig. 3c) reveal a metal-N coordination peak at 397.2 eV, along with a physically adsorbed N peak at 399.8 eV [36,37], further confirming the successful incorporation of N with Ni atom.
Figure 3
Figure 3.
XPS spectra of Ni 2p (a), Zn LMM (b), and N 1s (c) regions for Ni, Ni3Zn, and Ni3ZnN catalysts. (d) Normalized Ni K-edge XANES spectra of Ni foil, Ni, Ni3Zn, and Ni3ZnN catalysts. (e) EXAFS oscillation functions at the Ni K-edge of Ni foil, Ni, Ni3Zn, and Ni3ZnN catalysts. (f) k2-weighted Fourier transform spectra of EXAFS for Ni, Ni3Zn, and Ni3ZnN catalysts at the Ni K-edge. Wavelet transform (WT) contour plots of EXAFS spectra for Ni (g), Ni3Zn (h), and Ni3ZnN (i) catalysts.
To further investigate the coordination environment and local structure of Ni sites, XAFS spectroscopy was conducted. As shown in Fig. 3d, the normalized XANES spectra compare the Ni K-edge of Ni foil, monometallic Ni, Ni3Zn and Ni3ZnN catalysts. The absorption edge of Ni3Zn exhibits a negative shift relative to Ni foil and monometallic Ni, suggesting electron enrichment at Ni sites during the RMSI process. In contrast, the Ni K-edge of Ni3ZnN shifts to a higher energy, primarily due to N coordination and charge transfer involving Ni. These XANES results align with the Ni0 trends observed in XPS, confirming the electronic interactions among N, Zn, and Ni. The k2-weighted EXAFS oscillation at the Ni K-edge (Fig. 3e) shows that Ni3ZnN exhibits shorter periods and weaker amplitudes compared to Ni, indicating alterations in local coordination environment of Ni due to Zn and N incorporation. Fourier transform (FT) EXAFS analysis was then conducted to further elucidate the coordination structure of Ni. As shown in Fig. 3f, monometallic Ni displays a prominent peak at ~2.09 Å, corresponding to Ni-Ni coordination. A relatively weak peak at approximately 1.25 Å corresponds to Ni-O coordination, likely due to surface oxidation of Ni. In the Ni3Zn catalyst, alloying with Zn shifts the Ni-Ni/Zn coordination peak to ~2.15 Å. Notably, the Ni3ZnN structure exhibits a first-shell scattering peak at ~1.51 Å, corresponding to the Ni-N bond as confirmed by EXAFS fitting (Fig. S11 in Supporting information). Additionally, the Ni-Ni/Zn bond shifts to a higher R-value of approximately 2.24 Å, attributed to the coordination effects of Zn and N atoms. To further clarify the coordination environment, the wavelet transform (WT) analysis of EXAFS spectra in both R- and k-space was conducted. The WT-EXAFS contour plots of Ni (Fig. 3g), Ni3Zn (Fig. 3h), and Ni3ZnN (Fig. 3i) show intensity maxima at 7.03, 6.81, and 6.79 Å−1, corresponding to Ni-Ni and Ni-Ni/Zn coordination, respectively. A new feature at 3.67 Å−1 in Ni3ZnN catalyst suggests Ni-N coordination, further confirming the successful formation of Ni3ZnN anti-perovskite structure via RGMSI. Furthermore, EXAFS fitting yielded a Ni-N bond length of 1.89 Å, in excellent agreement with theoretical values (Fig. S11 and Table S2 in Supporting information). The Zn and N coordination extends the Ni-Ni bond length from 2.49 Å to 2.51 Å and 2.65 Å, respectively, strongly supporting the modulation of interatomic distances achieved by RMSI and RGMSI.
The density of states (DOS) of Ni was subsequently analyzed using density functional theory (DFT) calculations to elucidate changes in electronic density. As shown in Fig. S12 (Supporting information), the Ni d-band center in Ni3Zn shifts upward to −1.04 eV, approaching the Fermi level (Ef) relative to the Ni (−1.42 eV), suggesting an increase in electron density, which aligns with XPS and XANES results. However, the further incorporation of N atoms causes charge redistribution, decreasing the electron density on Ni within the Ni3ZnN structure and downshift of the d-band center to −1.49 eV. This change implies that the Ni-N interaction weakens the adsorption strength of Ni sites for adsorbates, facilitating the desorption of target products and thus enhancing the selectivity in hydrogenation reactions [38,39]. Overall, the combined experimental and theoretical findings confirm substantial modulation of the geometric and electronic structure of Ni through Zn and N incorporation.
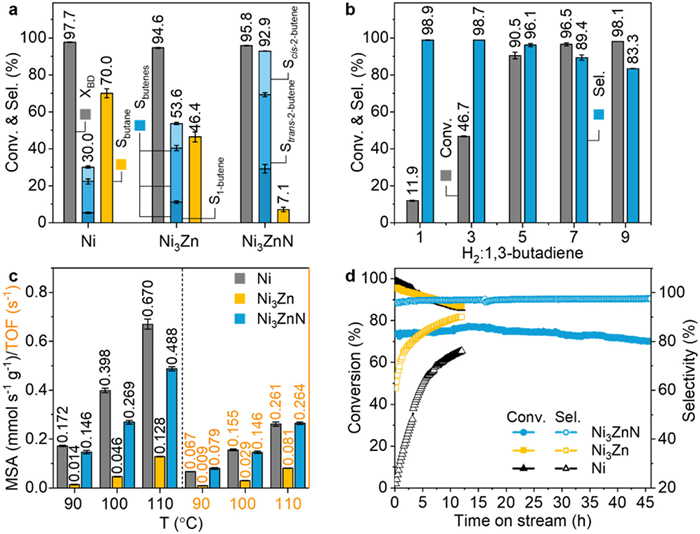
Selective hydrogenation of 1,3-butadiene is a critical industrial process for purifying alkenes from petroleum cracking, and the development of non-noble catalysts with high selectivity and activity is of great importance for improving the process efficiency [40,41]. Therefore, after the systematic characterization of Ni-based structures obtained through RMSI and RGMSI, the impact of geometric and electronic modifications of Ni on catalytic performance in 1,3-butadiene hydrogenation was evaluated. The selectivity was first evaluated by maintaining a 1,3-butadiene conversion of approximately 95% at around 100 ℃, with space velocity controlled to regulate conversion (Fig. 4a). Typically, achieving higher conversion makes selectivity control more challenging due to the potential for over-hydrogenation. In the monometallic Ni/ZnO catalyst, at a 1,3-butadiene conversion of 97.7%, the catalyst exhibited a low butenes selectivity of around 30.0%. The product distribution consisted of 5.3% 1-butene, 17.0% trans-2-butene, and 7.7% cis-2-butene, with nearly 70% of the 1,3-butadiene fully hydrogenated to butane. This suggests that the monometallic Ni catalyst tends to over-hydrogenation, likely due to the strong adsorption of reactant on Ni. In contrast, the Ni3Zn/ZnO catalyst, constructed via RMSI, exhibited enhanced butenes selectivity of 53.6% at 94.6% conversion, with 11.0% 1-butene, 29.3% trans-2-butene, and 13.3% cis-2-butene. Only 46.4% of the 1,3-butadiene was fully hydrogenated to butane. This improved selectivity can likely be attributed to the introduction of Zn, which partially isolates the Ni active sites and weakens the adsorption of the alkenes, thereby promoting their desorption before hydrogenation [42,43]. The Ni3ZnN catalyst, constructed through RGMSI by incorporating both Zn and N, demonstrated exceptional performance. At a 95.8% conversion, it achieved an impressive 92.9% butenes selectivity, with the product distribution consisting mainly of 29.2% 1-butene, 40.1% trans-2-butene, and 23.6% cis-2-butene. This remarkable performance underscores the role of nitrogen incorporation in optimizing the adsorption and hydrogenation of 1,3-butadiene, leading to superior selectivity at high conversion. Additionally, the effect of the H2 to 1,3-butadiene ratio on catalytic performance was further examined. As shown in Fig. 4b, the activity of Ni3ZnN catalyst increased as the H2 to 1,3-butadiene ratio was raised from 1:1 to 9:1, while butenes selectivity slightly decreased from 98.9% to 83.3%. This suggests that Ni3ZnN catalyst can operate stably under varying conditions, demonstrating significant potential for industrial applications.
Figure 4
Figure 4.
(a) Product selectivity of Ni, Ni3Zn, and Ni3ZnN catalysts at about 95% conversion in the 1,3-butadiene hydrogenation reaction. (b) Conversion of 1,3-butadiene and selectivity toward butenes for the Ni3ZnN catalyst at different H2/1,3-butadiene ratios. (c) Mass-specific activity (MSA) and turnover frequency (TOF) at 90, 100, and 110 ℃ for various Ni-based catalysts. (d) Long-term stability comparison of Ni, Ni3Zn, and Ni3ZnN in terms of conversion and selectivity over time.
Typically, the improvements in selectivity are accompanied by a reduction in activity, which is critical for hydrogenation reactions. Therefore, both mass-specific activity (MSA) and turnover frequency (TOF) were evaluated for the catalysts. As shown in Fig. 4c, the Ni/ZnO catalyst demonstrated the highest MSA at various temperatures (90, 100, and 110 ℃), with values of 0.172, 0.398, and 0.670 mmol s−1 g−1, respectively, slightly surpassing the Ni3ZnN/ZnO catalyst (0.146, 0.269, and 0.488 mmol s−1 g−1). Both catalysts exhibited significantly higher MSA than the Ni3Zn/ZnO catalyst, which had values of 0.014, 0.046, and 0.128 mmol s−1 g−1. This trend is consistent with previous studies, where selectivity enhancement generally occurs at the expense of activity [44,45]. Although the butenes selectivity of Ni3Zn increased from approximately 30% to 53.6%, its MSA decreased by 5–12 times. In terms of TOF, Ni3ZnN exhibited activity comparable to or even higher than Ni, with a TOF of 0.079 s−1 at 90 ℃, surpassing that of Ni at 0.067 s−1, while Ni3Zn showed the lowest TOF at 0.009 s−1. The differences in MSA and TOF can be attributed to variations in particle size, with average diameters of 7.9 nm for Ni, 10.1 nm for Ni3Zn, and 8.6 nm for Ni3ZnN.
In addition to activity and selectivity, the stability is a crucial factor for evaluating catalysts in industrial applications. As shown in Fig. 4d, the Ni3ZnN catalyst exhibited excellent stability during a 46-h test, maintaining both 1,3-butadiene conversion and butene selectivity, indicating the durability of the Ni3ZnN anti-perovskite structure in the hydrogenation reaction. In contrast, both Ni and Ni3Zn catalysts exhibited gradual deactivation over time (Fig. 4d), with conversion rates decreasing from 98.8% and 95.7% to 85.9% and 86.8% within an 11-h test, respectively. TEM images further confirmed that the structure and morphology of the spent Ni3ZnN catalyst remained well-preserved after the stability test, with the nanoparticles uniformly distributed and showing no significant agglomeration (Fig. S13 in Supporting information). These results highlight the effectiveness of constructing the Ni3ZnN structure via RGMSI, which optimizes the geometric and electronic properties of the Ni sites, leading to significant improvements in selectivity, activity, and stability, thereby demonstrating the potential of this strategy for selective hydrogenation and catalyst design.
In summary, we developed an ammonia-directed RGMSI approach that enables simultaneous support reduction and interstitial nitrogen incorporation, resulting in the formation of a stable anti-perovskite Ni3ZnN structure. The lattice expansion resulting from nitrogen incorporation was confirmed through XRD and TEM analyses, while EELS and EDX mapping validated the presence of N and Zn in the NPs formed on ZnO via RGMSI and RMSI. Ni-N coordination induced an electron-deficient state in Ni, accompanied by a downward shift in the d-band center. These geometric and electronic modifications weaken reactant adsorption on the Ni3ZnN surface, resulting in an increase in selectivity from 30.0% to 92.9% in the 1,3-butadiene hydrogenation reaction. Additionally, Ni3ZnN demonstrated activity comparable to or even higher than that of Ni. For instance, at 90 ℃, the TOF of Ni3ZnN was 0.079 s−1, slightly higher than Ni (0.067 s−1) and significantly surpassing that of the Ni3Zn alloy (0.009 s−1). These findings highlight the effectiveness of interstitial atom modulation in tuning catalytic properties. The RGMSI approach extends beyond conventional RMSI by introducing an additional dimension of control, offering greater flexibility in tailoring the geometric and electronic structures of supported catalysts. This work not only advances the understanding of metal-support interactions but also opens new avenues for the development of efficient, selective, and durable catalysts in heterogeneous catalysis.
Declaration of competing interest
The authors declare that they have no known competing financial interests or personal relationships that could have appeared to influence the work reported in this paper.
The authors gratefully acknowledge the financial support provided by the National Natural Science Foundation of China (Nos. 22072164, 22472180, 22002173), Energy Revolution S & T Program of Yulin Innovation Institute of Clean Energy (No. E411030705), Natural Science Foundation of Liaoning Province (No. 2022-MS-004), China Postdoctoral Science Foundation (No. 2020M680999), and the Research Fund of Shenyang National Laboratory for Materials Science.
Supplementary materials
Supplementary material associated with this article can be found, in the online version, at doi:10.1016/j.cclet.2025.111520.
[1]
T.W. van Deelen, C. Hernández Mejía, K.P. de Jong, Nat. Catal. 2 (2019) 955–970. doi: 10.1038/s41929-019-0364-x
Figure 1
(a) Schematic illustration of the synthesis approaches for Ni3Zn/ZnO and Ni3ZnN/ZnO catalysts via RMSI and RGMSI, respectively. (b) XRD patterns of Ni/ZnO, Ni3Zn/ZnO, and Ni3ZnN/ZnO catalysts. (c, d) TEM images of the synthesized Ni3Zn/ZnO and Ni3ZnN/ZnO catalysts, respectively, with insets showing the PSD histograms of the Ni3Zn and Ni3ZnN NPs.
Figure 2
HRTEM images of the representative Ni (a), Ni3Zn (b), and Ni3ZnN (c) NPs. The insets show the corresponding FFT patterns (top-right) and schematic unit cell structures (bottom-right) for Ni, Ni3Zn, and Ni3ZnN, respectively. HAADF-STEM images and corresponding EDX elemental maps of Ni/ZnO (d), Ni3Zn/ZnO (e), and Ni3ZnN/ZnO (f) catalysts, respectively. The yellow, green, and purple colors represent the Ni, Zn, and N elements, respectively. (g) The EELS spectra of Ni, Ni3Zn, Ni3ZnN, and ZnO, and the inset shows the STEM image of the selected region in Ni3ZnN/ZnO.
Figure 3
XPS spectra of Ni 2p (a), Zn LMM (b), and N 1s (c) regions for Ni, Ni3Zn, and Ni3ZnN catalysts. (d) Normalized Ni K-edge XANES spectra of Ni foil, Ni, Ni3Zn, and Ni3ZnN catalysts. (e) EXAFS oscillation functions at the Ni K-edge of Ni foil, Ni, Ni3Zn, and Ni3ZnN catalysts. (f) k2-weighted Fourier transform spectra of EXAFS for Ni, Ni3Zn, and Ni3ZnN catalysts at the Ni K-edge. Wavelet transform (WT) contour plots of EXAFS spectra for Ni (g), Ni3Zn (h), and Ni3ZnN (i) catalysts.
Figure 4
(a) Product selectivity of Ni, Ni3Zn, and Ni3ZnN catalysts at about 95% conversion in the 1,3-butadiene hydrogenation reaction. (b) Conversion of 1,3-butadiene and selectivity toward butenes for the Ni3ZnN catalyst at different H2/1,3-butadiene ratios. (c) Mass-specific activity (MSA) and turnover frequency (TOF) at 90, 100, and 110 ℃ for various Ni-based catalysts. (d) Long-term stability comparison of Ni, Ni3Zn, and Ni3ZnN in terms of conversion and selectivity over time.


 DownLoad:

 下载:
下载:


 下载:
下载:
