Red and near-infrared emissive nitrogen-sulfur co-doped carbonized nanoparticles for red laser-induced synergistic photothermal and photodynamic tumor therapy
Citation:
Zhenjian Li, Xue Wu, Lingyun Li, Bingzhe Wang, Guichuan Xing, Yupeng Liu, Songnan Qu. Red and near-infrared emissive nitrogen-sulfur co-doped carbonized nanoparticles for red laser-induced synergistic photothermal and photodynamic tumor therapy[J]. Chinese Chemical Letters,
2026, 37(5): 111501.
doi:
10.1016/j.cclet.2025.111501
Red and near-infrared emissive nitrogen-sulfur co-doped carbonized nanoparticles for red laser-induced synergistic photothermal and photodynamic tumor therapy
English
Red and near-infrared emissive nitrogen-sulfur co-doped carbonized nanoparticles for red laser-induced synergistic photothermal and photodynamic tumor therapy
Joint Key Laboratory of the Ministry of Education, Institute of Applied Physics and Materials Engineering (IAPME), University of Macau, Macau SAR, China
b.
College of Chemistry and Materials Science, and Guangdong Provincial Key Laboratory of Supramolecular Coordination Chemistry, Jinan University, Guangzhou 510632, China
c.
Zhuhai UM Science and Technology Research Institute, University of Macau, Zhuhai 519031 China
Received Date:
22 April 2025 Accepted Date:
23 June 2025 Revised Date:
12 June 2025 Available Online:
15 May 2026
Abstract:
Metal-free nanoparticles capable of executing synergistic photothermal therapy (PTT) and photodynamic therapy (PDT) under the action of a single-wavelength laser have garnered considerable attention. Here, a novel type of nitrogen-sulfur co-doped carbon nanoparticles (TG-CNPs) was synthesized from taurine and genipin using a solvothermal method in dimethylformamide. The TG-CNPs, with an average size of approximately 25 nm, demonstrated red and near-infrared absorption/emission in aqueous solution. TG-CNPs exhibited negligible dark cytotoxicity, excellent biocompatibility, and remarkable lysosomal localization ability. Upon 655-nm laser irradiation, TG-CNPs exhibited strong photothermal performance with a photothermal conversion efficiency of 30% along with the efficient generation of superoxide radicals (•O2−). Leveraging the enhanced permeability and retention (EPR) effect, TG-CNPs facilitated passive targeting and accumulation at the tumor site. Notably, following a single round of 655-nm laser treatment, the tumors in the mice were completely eradicated, with no evidence of recurrence observed over the subsequent five months. This study introduces a promising metal-free, heteroatom-doped carbon nanoparticle platform for effective synergistic PTT/PDT in tumor treatment.
Cancer remains a critical global health threat, characterized by an increasing incidence and mortality rate, positioning it as one of the foremost public health challenges worldwide [1,2]. This escalating burden underscores the urgent need for innovative therapeutic modalities [3,4]. Among emerging strategies light-mediated therapies have garnered considerable attention due to their spatiotemporal precision, non-invasiveness and stimulus-responsive properties [5–7]. Light-mediated cancer diagnosis and therapies primarily encompass photothermal therapy (PTT) and photodynamic therapy (PDT) [8,9]. Among these, PTT employs photothermal conversion materials that absorb light and excited electrons to an excited state, followed by non-radiative relaxation to release energy as heat [10]. This localized heat causes thermal damage, denaturation of proteins, and disruption of cell membranes in tumor cells, leading to apoptosis or necrosis, while also damaging tumor vasculature and inhibiting progression [11]. In contrast, PDT employs photosensitizers that absorb photons to excite electrons, generating highly reactive oxygen species (ROS) through type Ⅰ and type Ⅱ mechanisms [12]. Type Ⅱ ROS produce singlet oxygen (1O2) via energy transfer and exhibit selective oxidation of specific targets, but their efficacy is limited by the hypoxic tumor microenvironment [13,14]. Type Ⅰ ROS, like superoxide anion radicals (•O2−), peroxides, and hydroxyl radicals (•OH), generated through electron transfer, are more oxidative and can indiscriminately damage biomacromolecules such as lipids, proteins, and DNA, making them more effective in PDT [15].
Compared to single-mode treatment, the combined treatment of PTT, and PDT significantly enhances therapeutic accuracy and efficacy [16–19]. This synergistic approach not only reduces thermal damage to normal tissues resulting from excessive PTT temperature but also introduces tumor-selective ROS cytotoxicity, effectively eliminating residual dispersed tumor cells following photothermal ablation [20–23]. For example, Shi et al. developed samarium-doped carbon dots (CDs) via a one-step hydrothermal method realizing PTT and PDT by •O2− and •OH under near-infrared (NIR) irradiation [24]. Wang et al. assembled a platform from red CDs with photothermal properties and Chlorin-e6 with photosensitivity through amide reaction, achieving PTT and PDT under a single wavelength laser [25]. Su et al. composited nitrogen-doped CDs synthesized from citric acid and ethylenediamine with photosensitive curcumin to generate 1O2 and heat under 405 nm and 808 nm irradiation [26]. However, the current research on functionalized carbon-based nanocomposites for combined photothermal and photodynamic therapy primarily relies on metal doping or the integration of different photothermal and photodynamic materials, which often leads to disadvantages such as poor biocompatibility, inadequate photostability, and the requirement of multiple light sources. Therefore, a significant challenge remains in developing a multifunctional, metal-free carbon-based nanoplatform capable of synergistic tumor phototherapy under a single light source treatment.
In this study, we synthesized nitrogen-sulfur co-doped carbonized nanoparticles (TG-CNPs) employing taurine and genipin as precursors through a solvothermal method in dimethylformamide (DMF). The introduction of sulfur-containing electron-withdrawing groups and nitrogen-containing electron-donating groups modulate the electronic structure of TG-CNPs, resulting in a dominant absorption band in the red region and a should band in the NIR region. TG-CNPs exhibit a uniform particle size of approximately 25 nm and excellent lysosomal localization while demonstrating effective tumor accumulation through the enhanced permeability and retention (EPR) effect. The synergistic interaction between the carbon core and surface functional groups promotes photoinduced electron-hole separation, enabling simultaneous photothermal conversion and type Ⅰ ROS (•O2−) generation under a single 655 nm laser irradiation, thereby achieving PTT/PDT synergistic treatment of tumors. After one round of 655 nm laser irradiation, the TG-CNPs accumulated tumors in the mice completely disappeared, and no recurrence was observed in five months. This multimodal synergistic tumor-killing capacity demonstrates potent anticancer efficacy, offering a promising avenue for clinical tumor phototherapy.
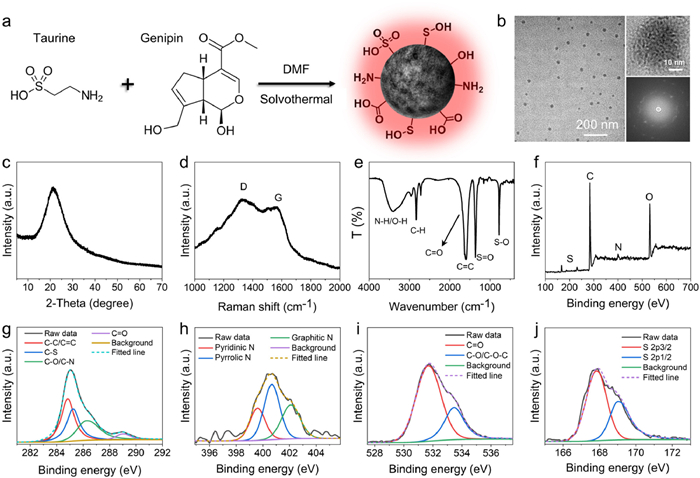
The TG-CNPs were synthesized via a solvothermal reaction of taurine and genipin in DMF. The crude product was purified through dialysis in deionized water to remove residual solvents and small molecules, followed by lyophilization to obtain the final black powder (Fig. 1a). Transmission electron microscopy (TEM) image revealed uniformly dispersed spherical TG-CNPs with an average particle size of about 25 nm (Fig. 1b). Dynamic light scattering (DLS) measurement indicated an increased hydrodynamic diameter of about 68 nm (Fig. S1 in Supporting information), which facilitates passive tumor targeting through the EPR effect [27]. High-resolution TEM (HR-TEM) image exhibited faint lattice fringes with weak diffraction spots in selected area electron diffraction (SAED) patterns, suggesting disordered graphene-like stacking or defective structures [28]. TG-CNPs showed a −29.38 mV zeta potential in aqueous solution (Fig. S2 in Supporting information), which might be due to the abundant sulfonic acid groups on their surface. X-ray diffraction (XRD) analysis showed a characteristic peak at 21.3° corresponding to the (002) crystal plane of graphite (Fig. 1c), with low-angle shift due to expanded interlayer spacing caused by amorphous carbon domains and edge-bonded groups [29,30]. Raman spectra displayed characteristic defect band (D-band) at 1325 cm-1 and graphite band (G-band) at 1555 cm-1 with an intensity ratio of 1.06 (Fig. 1d), indicative of abundant sp3 defects and amorphous characteristics and also confirms the results of HR-TEM [31].
Figure 1
Figure 1.
(a) Schematic of the preparation process of TG-CNPs. (b) TEM, HRTEM images, and SAED pattern of TG-CNPs. (c) XRD pattern, (d) Raman, and (e) FT-IR spectra of TG-CNPs. (f) XPS survey spectrum of TG-CNPs. High-resolution XPS spectra of (g) C 1s, (h) N 1s, (i) O 1s, and (j) S 2p of TG-CNPs.
Fourier transform infrared (FT-IR) spectra and X-ray photoelectron spectroscopy (XPS) were further employed to identify the chemical structure of TG-CNPs. A broad absorption at 3400 cm-1 corresponds to stretching vibrations of N–H/O–H (Fig. 1e) and peaks at 2960–2830 cm-1 arise from C–H stretching. The sharp peak at 1600 cm-1 reflects C=C stretching in sp2 networks, along with the shoulder peaks at 1687 cm-1 and 1631 cm-1 assigned to C=O and amide Ⅱ bands originated from the generated amide bond (Fig. S3 in Supporting information). The peak at 1364 cm-1 demonstrates S=O symmetric vibrations from residual sulfonic groups, while the 774 cm-1 peak corroborates S-O vibrations, which both confirm the successful doping of sulfur [32].
XPS survey confirmed elemental composition (C: 70.65%, O: 21.27%, N: 5.05%, S: 3.02%) with characteristic binding energies: C 1s (285 eV), O 1s (531 eV), N 1s (400 eV), S 2s (231 eV), and S 2p (168 eV) (Fig. 1f). High-resolution C 1s spectra deconvoluted into five components: C–C/C=C (284.8 eV), C-S (285.2 eV), C–O/C–N (286.2 eV), and C=O (289.0 eV) (Fig. 1g) [33]. As depicted in Fig. 1h, N 1s spectra resolved into pyrrolic N (399.6 eV), pyridinic N (400.7 eV), and graphitic N (402.1 eV), indicating the formation of graphitized N-doped carbon core [34]. O 1s peaks at 531.7 eV (C=O) and 533.5 eV (C–O/C–O-C) were observed (Fig. 1i). S 2p spectra exhibited two components of S 2p3/2 (167.7 eV) and S 2p1/2 (168.9 eV) (Fig. 1j) [35]. Structural analyses revealed that nitrogen-sulfur co-doping and high defect density in TG-CNPs modulate band structures via heteroatom introduction, narrowing bandgaps, and extending light absorption into the near-infrared region. The electron-withdrawing sulfur elevates conduction band potential for enhanced reductive capacity, while electron-donating nitrogen adjusts valence band positions to facilitate hole-mediated oxidation, collectively sustaining electron supply. These structural merits endow TG-CNPs with superior photoactivity, demonstrating remarkable physicochemical responsiveness and biological efficacy under illumination.
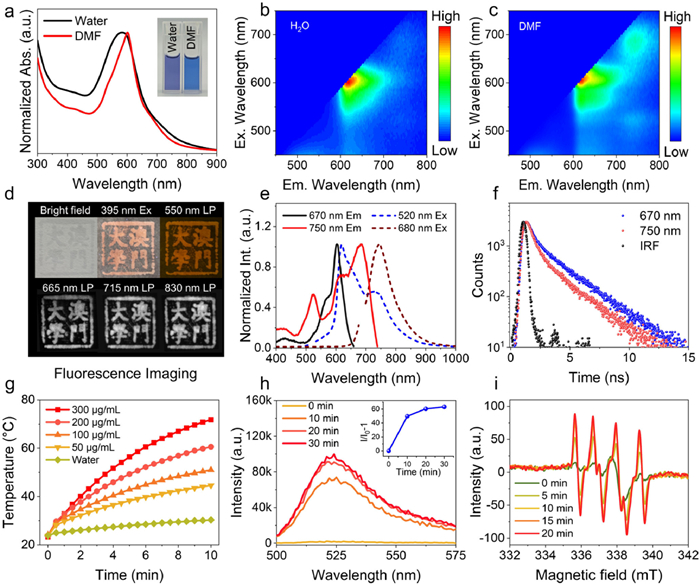
The photophysical properties of TG-CNPs were systematically investigated. In the UV–vis absorption spectra, TG-CNPs aqueous solution exhibited a prominent absorption band near 600 nm and extended to the NIR region, which was slightly redshifted and more centralized in DMF solution (Fig. 2a), demonstrating potential for biological window applications. The bright-field images of TG-CNPs aqueous and DMF solution in cuvettes were displayed in Fig. 2a, inset. Fluorescence emissions in aqueous solution were measured under 450–750 nm excitation, with maximum intensity at 620 nm when excited at 600 nm (Fig. 2b) with a weak NIR emission centered at 740 nm. Structural defects and N/S co-doping create diverse localized electronic states with multi-level energy distributions, establishing multiple emissive centers in TG-CNPs. Moreover, the NIR fluorescent emission at 750 nm was more apparent in the DMF solution (Fig. 2c). Fluorescent patterning was demonstrated by imprinting "University of Macau" Chinese characters on filter paper using TG-CNPs solutions. The imprints showed faint visibility under a bright field but exhibited red fluorescence under 395 nm UV light. Green light excitation with 550 nm long-pass (LP) filtering produced spectrally purified red emission. Multispectral imaging revealed persistent fluorescence through various LP filter combinations: 610/665 nm (589 nm excitation), 695/715 nm (655 nm excitation), and 780/830 nm (740 nm excitation), confirming their red-NIR broad imaging adaptability (Fig. 2d) and reaffirmed the multi-center emission characteristics of TG-CNPs. Fluorescence excitation spectrum analysis revealed triple excitation peaks of 525/570/605 nm for 670 nm emission, while 750 nm emission exhibited excitation bands at 525/630/685 nm (solid line in Fig. 2e). Simultaneously, excitation with 520 nm or 680 nm lasers generated emissions at 620/730 nm or 745 nm respectively (dash line in Fig. 2e). The excitation spectral overlap between the red emission center (620 nm) and NIR emission center (750 nm) established the rationale for selecting 655 nm as the optimal single excitation wavelength to concurrently activate both PTT and PDT therapeutic modalities. Fluorescence lifetime decay profiles under 640 nm excitation showed distinct lifetimes of 1.88 ns for 670 nm emission versus 1.49 ns for 750 nm emission, indicating structurally distinct luminescent centers (Fig. 2f).
Figure 2
Figure 2.
(a) UV–vis absorption spectrum of TG-CNPs aqueous solution (inset: photographs of TG-CNPs aqueous and DMF solutions). Excitation-emission maps of TG-CNPs (b) aqueous and (c) DMF solutions. (d) Photographs of the fluorescent pattern of “University of Macau” on the filter paper. (e) Excitation spectra monitored at 670/750 nm (solid line) and emission spectra under 520/680 nm excitation (dash line) of TG-CNPs DMF solution. (f) Fluorescence lifetime decay curves at 670 nm and 750 nm respectively under 640 nm laser. (g) Temperature evolutions of TG-CNPs aqueous solutions of various concentrations under 655 nm laser irradiation at 1 W/cm2. (h) Total ROS generation of TG-CNPs aqueous solution under 655 nm laser at 1 W/cm2 identified by DCFH-DA. (i) ESR spectra of TG-CNPs DMSO solution under 655 nm laser at 1 W/cm2 at different irradiation times.
Under 655 nm laser irradiation with 1 W/cm2, TG-CNPs aqueous solutions demonstrated concentration-dependent photothermal heating profiles, exhibiting rapid temperature elevation within 30 s and progressive increase over 10 min (Fig. 2g). Maximum equilibrium temperatures increased proportionally with concentration. TG-CNPs aqueous solution in 300 µg/mL concentration achieved 71.8 ℃ with excellent photostability over four heating-cooling cycles (Fig. S4 in Supporting information), yielding a calculated photothermal conversion efficiency of 30%. TG-CNPs aqueous solutions in lower concentrations with 200, 100, and 50 µg/mL attained 60.6, 51.0, and 44.6 ℃, respectively. Under 730 nm laser irradiation with 1 W/cm2, 1 mL of TG-CNPs aqueous solution in 300 µg/mL also exhibited photothermal property (Fig. S5 in Supporting information). The temperature of TG-CNPs aqueous solution raise to 55 ℃, which is lower than that of 655 nm laser irradiation, due to the lower absorption at 730 nm. The photophysical characterization of TG-CNPs substantiates the promising potential for developing photothermal applications.
The photodynamic characteristics of TG-CNPs were further evaluated. Photodynamic total ROS generation was quantified using a dichloro-dihydro-fluorescein diacetate (DCFH-DA) assay. A surprising 63-fold fluorescence enhancement at 525 nm after 30-min irradiation was observed, indicating ROS saturation beyond this duration (Fig. 2h). Electron spin resonance (ESR) spectroscopy demonstrated four signal peaks with an intensity ratio of 1:1:1:1, which is the characteristic of •O2−. Under 730 nm laser irradiation, TG-CNPs DMSO solution also exhibited photodynamic property (Fig. S6 in Supporting information). This indicates that •O2− was the predominant ROS species, showing time-dependent accumulation under continuous illumination (Fig. 2i).
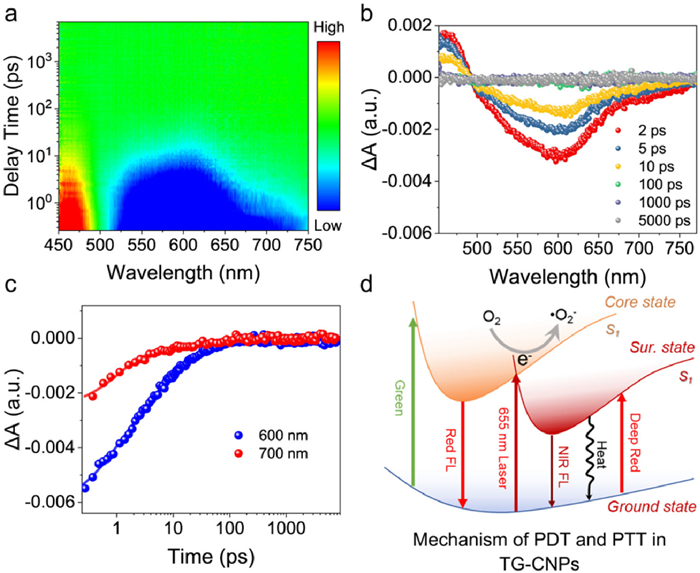
Transient absorption (TA) spectroscopy with 400 nm pump laser elucidated the excited state photophysical dynamics of TG-CNPs aqueous solution. Upon the pump laser of 400 nm, the positive (red) signal attributed to photoinduced absorption (PIA) signals emerged at 450–475 nm, where accompanied by negative (blue) broad ground-state bleaching (GSB) spanning 500–750 nm (Figs. 3a and b) [36]. In the broad GSB signal, a long attenuation component is observed at 600 nm, while a short attenuation component is noted at 700 nm [37]. Comparatively slower decay was detected at 600 nm with a longer lifetime (36.6 ps) associated with electron transfer processes to produce •O2−, followed by rapid decay kinetics at 700 nm with a shorter lifetime (24.2 ps) indicating thermal energy release through the non-radiative quenching (Fig. 3c).
Figure 3
Figure 3.
(a) 2D pseudo-color maps of TA spectrum of TG-CNPs aqueous solution. (b) TA spectrum of TG-CNPs aqueous solution at indicated delay times. (c) TA kinetic traces of TG-CNPs aqueous solution collected at 600 nm and 700 nm at a pump wavelength of 400 nm. (d) Diagram depicting potential photophysical mechanisms in TG-CNPs.
Based on the comprehensive structural characterization and photophysical analysis presented above, we propose the mechanisms of red and NIR dual emission, as well as the photodynamic and photothermal mechanisms of TG-CNPs (Fig. 3d). Our previous studies indicate that surface electron-withdrawing groups can induce narrow-bandgap NIR luminescence, suggesting that the NIR emission of TG-CNPs arises from the sulfur-doped (S-O/S=O) surface state. Due to the relatively weak NIR luminescence in aqueous solution, most excited electrons might undergo non-radiative transitions, facilitating photothermal conversion. Conversely, the red emission is attributed to the nitrogen-doped sp2 core state. Notably, the excited state energy levels of the nitrogen-doped sp2 carbon core and the S-O/S=O-related surface states exhibit partial overlap, allowing for simultaneous excitation by a single light source at 655 nm. This excitation results in photoinitiated electron transfer from the core state, generating superoxide radicals (•O2−), while the excited electrons from the surface state dissipate energy as heat through non-radiative transitions. The selection of a 655 nm excitation wavelength effectively overlaps with both excitation ranges, thereby activating both photothermal and photodynamic therapeutic pathways. This coordinated mechanism demonstrates significant potential for synergistic treatment modalities encompassing PTT/PDT.
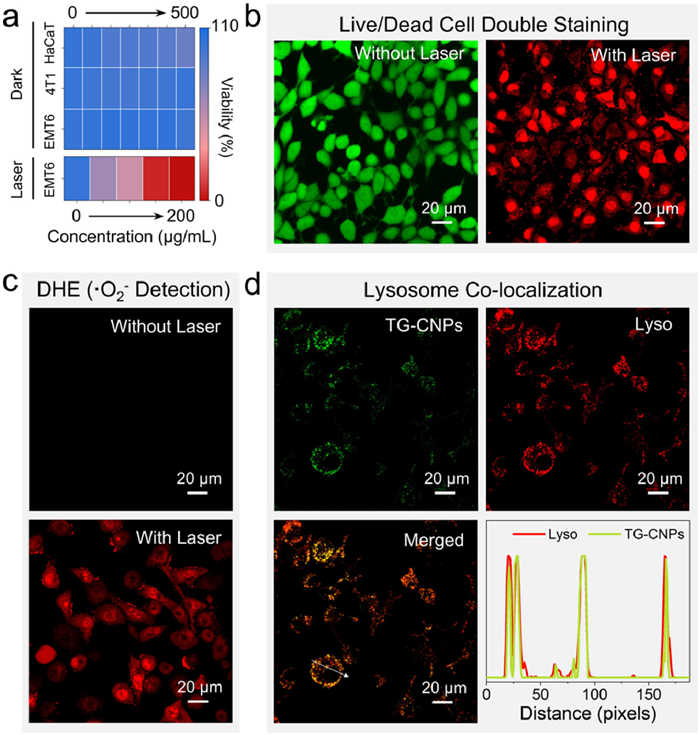
To evaluate the cytotoxicity of TG-CNPs, three cell lines (EMT6 and 4T1 cancer cells, HaCaT normal keratinocytes) were co-incubated with TG-CNPs at varying concentrations, with cellular viability assessed via CCK-8 assay (Fig. 4a). The results demonstrated negligible cytotoxic effects of TG-CNPs with concentrations up to 500 µg/mL on all three cell lines, thereby confirming their biocompatibility and validating their suitability for subsequent biomedical applications. To evaluate the photothermal and photodynamic effects of TG-CNPs on cancer cells, EMT6 cancer cells were treated with gradient concentrations from 25 µg/mL to 200 µg/mL and then exposed to 655 nm laser irradiation (10 min, 1 W/cm2). CCK-8 analysis revealed the dose-dependent cytotoxicity, in which 100 µg/mL eradicated 90% of populations, and 200 µg/mL accomplished complete tumor cell elimination. Live/dead double staining visualized laser-induced cytotoxicity, with calcein-AM (green) indicating viable cells and propidium iodide (red) marking membrane-compromised cells (Fig. 4b). The observed field exhibited uniform green fluorescence before irradiation, whereas post-treatment samples showed nuclear red staining.
Figure 4
Figure 4.
(a) EMT6, 4T1, and HaCaT cells were incubated with TG-CNPs solutions at various concentrations, and cell viability of EMT6 cells with different concentrations of TG-CNPs under 655 nm laser irradiation. Cell viability was assessed by the CCK-8 assay. Data are expressed as mean ± standard deviation (n = 5). (b) Live/death cell of EMT6 cells treated with TG-CNPs before and after 655 nm laser irradiation at 1W/cm2. (c) DHE imaging assay of EMT6 cells treated with TG-CNPs before and after laser irradiation at 655 nm. (d) Fluorescent images of TG-CNPs and commercial organelle probe of lysosome. The fluorescence intensity along the white lines in the corresponding merged photo.
At the same time, the dihydroethidium (DHE) fluorescent probe was used to detect the production of superoxide anions before (Fig. 4c) and after 655 nm laser irradiation. Baseline measurements showed minimal DHE oxidation, while irradiated cells exhibited intense nuclear red fluorescence, directly visualizing light-triggered •O2− production correlating with cytotoxicity. The remarkably potent tumoricidal effects of TG-CNPs through photothermal-photodynamic synergy under 655 nm irradiation, achieved even at minimal dosages, provide pivotal guidance for optimizing in vivo antitumor therapeutic regimens. The intracellular behavior of TG-CNPs was further investigated. Confocal microscopy revealed cytoplasmic localization of fluorescent TG-CNPs in EMT6 cells post-coincubation (Fig. S7 in Supporting information). To further explore the binding of TG-CNPs to organelles, we conducted organelle co-localization experiments (Fig. 4d). It was found that the green fluorescence of TG-CNPs overlapped with the red fluorescence of lysosome localization dyes, indicating that TG-CNPs can bind to lysosomes and achieve co-localization of lysosomes in cells.
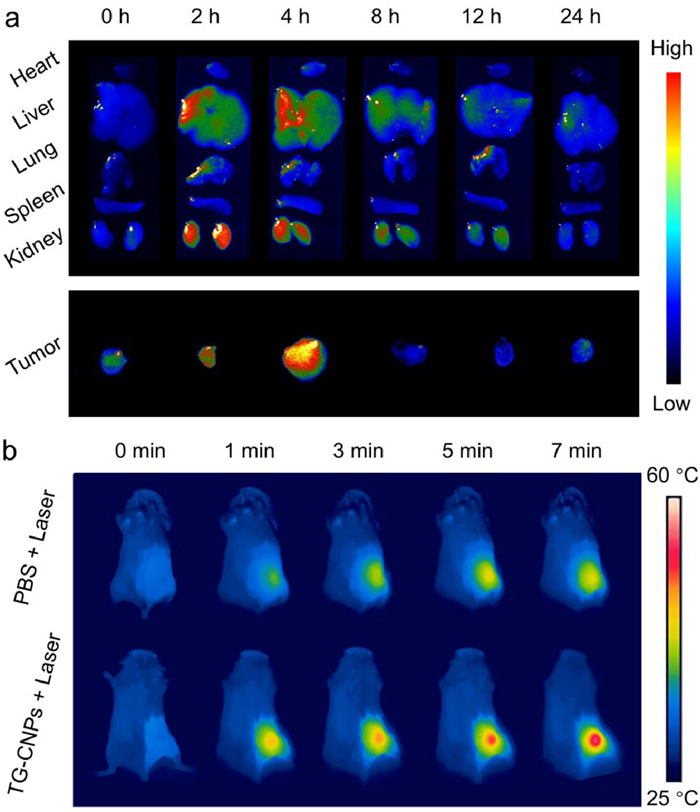
Prior to in vivo tumor therapy evaluation, the biocompatibility of TG-CNPs was systematically assessed in mice. All animal experiments were approved by the University of Macau Animal Ethics Committee under protocol No. UMARE-048–2023. TG-CNPs solutions (100 µL, 500 µg/mL) were administered via tail vein injection, with subsequent resection of tumors and major organs (heart, liver, spleen, lung, kidney) at designated time points for fluorescence imaging-based metabolic tracking (Fig. 5a). Quantitative fluorescence analysis revealed complete systemic liver and renal clearance within 24 h. By comparing the changes in fluorescence on the tumor with the increase of time after tail vein injection, it was seen that the fluorescence intensity on the tumor was gradually increasing and reached the maximum at 4 h. This indicates that after tail vein injection, TG-CNPs were passively targeted and accumulated in the tumor site through the EPR effect, thereby providing a crucial prerequisite for subsequent tumor treatment. In vivo photothermal performance was subsequently evaluated through intra-tumoral temperature monitoring 4 h post-injection (Fig. 5b). Under 655 nm irradiation (1 W/cm2), the PBS group only rose to 33 ℃, while the TG-CNPs group achieved 55 ℃ within 7 min, confirming the preserved photothermal conversion capability of TG-CNPs in vivo.
Figure 5
Figure 5.
(a) Fluorescence images of dissected major organs and tumor tissues from mice with and without the intravenous injection of TG-CNPs solution (100 µL, 500 µg/mL) at different post-injection time points under 589 nm laser excitation with 665 nm LP optical filter. (b) Thermal images of mice at 4 h post intravenous injection with PBS or TG-CNPs solutions under 655 nm laser irradiation (1 W/cm2) at different times.
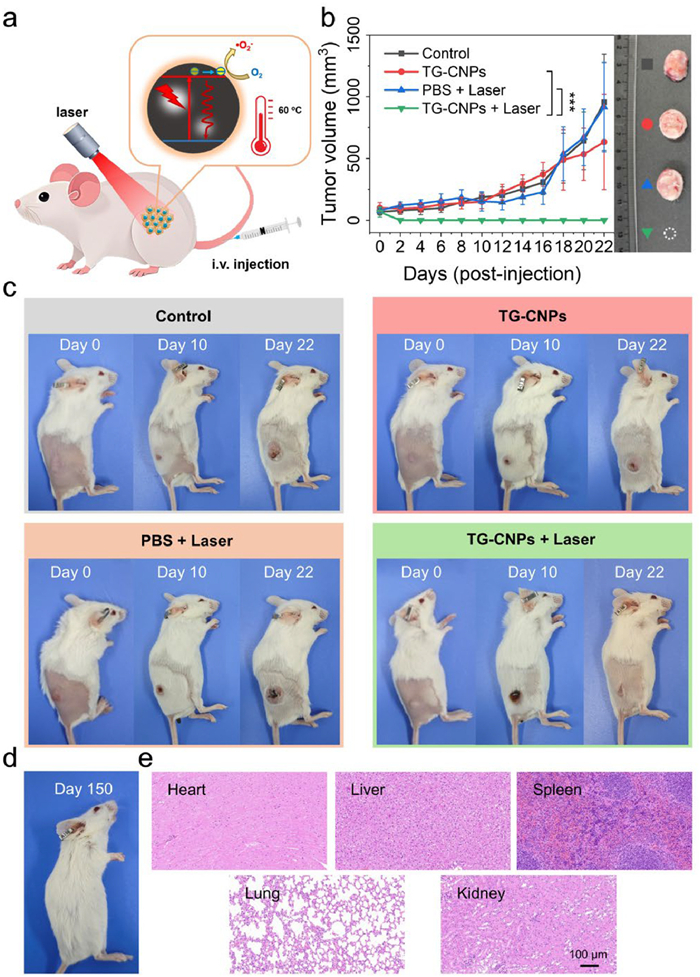
The PTT/PDT synergistic therapy protocol first involved intravenous injection of TG-CNPs followed by EPR effect-mediated tumor accumulation. Under 655 nm irradiation, concurrent photothermal conversion and •O2− generation synergistically eradicated tumor cells through thermal ablation and oxidative stress (Fig. 6a) [38]. Tumor growth kinetics monitoring revealed progressive expansion in blank control, TG-CNPs only, and PBS + laser-only groups (Figs. 6b and c, and Fig. S8 in Supporting information). Conversely, the TG-CNPs (100 µL, 500 µg/mL) + Laser cohort exhibited complete tumor ablation with no tumor recurrence in 5 months (Fig. 6d and Fig. S9 in Supporting information). Histopathological analysis via hematoxylin and eosin (H&E) staining confirmed no significant organ damage (Fig. 6e), validating the systemic biosafety of TG-CNPs and the potential for tumor PTT/PDT synergistic therapy.
Figure 6
Figure 6.
(a) Schematic diagram of combinatorial PPT/PDT by TG-CNPs. (b) Tumor growth curves and representative tumors on day 22. Data represent mean ± SD (n = 5). **P < 0.01, ***P < 0.001. (c) Representative brightfield photographs of mice on corresponding days after different treatments. (d) The TG-CNPs + Laser group were monitored for tumor recurrence up to 5 months after treatment. (e) H&E staining of major organs of mice after therapy.
In summary, a multifunctional CNPs platform for synergistic PPT/PDT tumor therapy was successfully developed in this work. The TG-CNPs with nitrogen-sulfur co-doping were synthesized via a solvothermal reaction using taurine and genipin in DMF with a size of approximately 25 nm. The TG-CNPs exhibited strong absorption and emission in the red and NIR regions, along with negligible dark cytotoxicity, excellent biocompatibility, and remarkable lysosomal localization capabilities. Furthermore, TG-CNPs exhibit dual photothermal and type-Ⅰ photodynamic therapeutic functions under single light irradiation of 655 nm laser, which enabled the PTT/PDT synergistic tumor therapy after passive tumor targeting accumulation via the EPR effect following tail vein injection. In the group treated with tail vein injection of TG-CNPs aqueous solution followed by 655 nm laser irradiation, the tumor completely disappeared within 22 days, and no recurrence was observed for 5 months. This study overcomes the limitations of single-mode tumor therapeutic agents and offers new insights for designing multi-functional anti-tumor platforms.
Declaration of competing interest
The authors declare that they have no known competing financial interests or personal relationships that could have appeared to influence the work reported in this paper.
This work was financially supported by the Science and Technology Development Fund of Macau SAR (Nos. 0139/2022/A3, 0002/2024/TFP, 0007/2021/AKP, 0005/2024/AKP) and the University of Macau – Dr. Stanley Ho Medical Development Foundation “Set Sail for New Horizons, Create the Future” Grant 2025 (No. SHMDF-OIRFS/2025/001) and the National Natural Science Foundation of China (No. 62205384).
Supplementary materials
Supplementary material associated with this article can be found, in the online version, at doi:10.1016/j.cclet.2025.111501.
[1]
R.L. Siegel, T.B. Kratzer, A.N. Giaquinto, et al., CA Cancer J. Clin. 75 (2025) 10. doi: 10.3322/caac.21871
[2]
B. Han, R. Zheng, H. Zeng, et al., J. Natl. Cancer. Ctr. 4 (2024) 47–53.
[3]
D. Peer, J.M. Karp, S. Hong, et al., Nat. Nanotech. 2 (2007) 751–760. doi: 10.1038/nnano.2007.387
H. Liu, Q. Peng, J. Ren, et al., J. Iran. Chem. Soc. 18 (2021) 2649–2656. doi: 10.1007/s13738-021-02220-0
[36]
Y. Liu, J.H. Lei, G. Wang, et al., Adv. Sci. 9 (2022) 2202283.
[37]
Z. Shi, H. Bai, J. Wu, et al., Research 6 (2023) 0169.
[38]
N. Sultana, R. Pathak, S. Samanta, N. Sen Sarma, Process Biochem. 148 (2025) 17–31.
Figure 1
(a) Schematic of the preparation process of TG-CNPs. (b) TEM, HRTEM images, and SAED pattern of TG-CNPs. (c) XRD pattern, (d) Raman, and (e) FT-IR spectra of TG-CNPs. (f) XPS survey spectrum of TG-CNPs. High-resolution XPS spectra of (g) C 1s, (h) N 1s, (i) O 1s, and (j) S 2p of TG-CNPs.
Figure 2
(a) UV–vis absorption spectrum of TG-CNPs aqueous solution (inset: photographs of TG-CNPs aqueous and DMF solutions). Excitation-emission maps of TG-CNPs (b) aqueous and (c) DMF solutions. (d) Photographs of the fluorescent pattern of “University of Macau” on the filter paper. (e) Excitation spectra monitored at 670/750 nm (solid line) and emission spectra under 520/680 nm excitation (dash line) of TG-CNPs DMF solution. (f) Fluorescence lifetime decay curves at 670 nm and 750 nm respectively under 640 nm laser. (g) Temperature evolutions of TG-CNPs aqueous solutions of various concentrations under 655 nm laser irradiation at 1 W/cm2. (h) Total ROS generation of TG-CNPs aqueous solution under 655 nm laser at 1 W/cm2 identified by DCFH-DA. (i) ESR spectra of TG-CNPs DMSO solution under 655 nm laser at 1 W/cm2 at different irradiation times.
Figure 3
(a) 2D pseudo-color maps of TA spectrum of TG-CNPs aqueous solution. (b) TA spectrum of TG-CNPs aqueous solution at indicated delay times. (c) TA kinetic traces of TG-CNPs aqueous solution collected at 600 nm and 700 nm at a pump wavelength of 400 nm. (d) Diagram depicting potential photophysical mechanisms in TG-CNPs.
Figure 4
(a) EMT6, 4T1, and HaCaT cells were incubated with TG-CNPs solutions at various concentrations, and cell viability of EMT6 cells with different concentrations of TG-CNPs under 655 nm laser irradiation. Cell viability was assessed by the CCK-8 assay. Data are expressed as mean ± standard deviation (n = 5). (b) Live/death cell of EMT6 cells treated with TG-CNPs before and after 655 nm laser irradiation at 1W/cm2. (c) DHE imaging assay of EMT6 cells treated with TG-CNPs before and after laser irradiation at 655 nm. (d) Fluorescent images of TG-CNPs and commercial organelle probe of lysosome. The fluorescence intensity along the white lines in the corresponding merged photo.
Figure 5
(a) Fluorescence images of dissected major organs and tumor tissues from mice with and without the intravenous injection of TG-CNPs solution (100 µL, 500 µg/mL) at different post-injection time points under 589 nm laser excitation with 665 nm LP optical filter. (b) Thermal images of mice at 4 h post intravenous injection with PBS or TG-CNPs solutions under 655 nm laser irradiation (1 W/cm2) at different times.
Figure 6
(a) Schematic diagram of combinatorial PPT/PDT by TG-CNPs. (b) Tumor growth curves and representative tumors on day 22. Data represent mean ± SD (n = 5). **P < 0.01, ***P < 0.001. (c) Representative brightfield photographs of mice on corresponding days after different treatments. (d) The TG-CNPs + Laser group were monitored for tumor recurrence up to 5 months after treatment. (e) H&E staining of major organs of mice after therapy.

 DownLoad:

 下载:
下载:


 下载:
下载:
