Citation:
Yi-Xin Zhang, Fang-Qi Zhang, Ao-Pei Peng, Tao Jiang, Ya-Xi Meng, Yang Li, Shuang-Xi Gu, Yuan-Yuan Zhu. Enantioselective recognition of amino acids in water using emission-tunable chiral fluorescent probes[J]. Chinese Chemical Letters,
2026, 37(1): 111500.
doi:
10.1016/j.cclet.2025.111500
Enantioselective recognition of amino acids in water using emission-tunable chiral fluorescent probes
English
Enantioselective recognition of amino acids in water using emission-tunable chiral fluorescent probes
Key Laboratory for Green Chemical Process of Ministry of Education, Hubei Key Laboratory of Novel Reactor and Green Chemical Technology, School of Chemical Engineering and Pharmacy, Wuhan Institute of Technology, Wuhan 430205, China
b.
School of Chemistry and Environmental Engineering, Wuhan Institute of Technology, Wuhan 430205, China
c.
Key Laboratory of Clean Dyeing and Finishing Technology of Zhejiang Province, School of Textile Science and Engineering, Shaoxing University, Shaoxing 312000, China
Received Date:
19 March 2025 Accepted Date:
23 June 2025 Revised Date:
07 June 2025 Available Online:
15 January 2026
Abstract:
The detection of amino acid enantiomers holds significant importance in biomedical, chemical, food, and other fields. Traditional chiral recognition methods using fluorescent probes primarily rely on fluorescence intensity changes, which can compromise accuracy and repeatability. In this study, we report a novel fluorescent probe (R)-Z1 that achieves effective enantioselective recognition of chiral amino acids in water by altering emission wavelengths (> 60 nm). This water-soluble probe (R)-Z1 exhibits cyan or yellow-green luminescence upon interaction with amino acid enantiomers, enabling reliable chiral detection of 14 natural amino acids. It also allows for the determination of enantiomeric excess through monitoring changes in luminescent color. Additionally, a logic operation with two inputs and three outputs was constructed based on these optical properties. Notably, amino acid enantiomers were successfully detected via dual-channel analysis at both the food and cellular levels. This study provides a new dynamic luminescence-based tool for the accurate sensing and detection of amino acid enantiomers.
Amino acids as the fundamental building blocks of functional macromolecules in biology, are essential for protein formation in living organisms [1-3]. They are also critical components in many drug molecules [4]. The chiral recognition of amino acids is pivotal in various fields including the construction of living organisms, the food industry, natural products, and pharmaceuticals [5-7]. However, differentiating among various types of chiral amino acids, particularly between their enantiomeric pairs with similar structures, presents significant challenges due to the overlapping nature of their characteristic spectra [8]. Various spectroscopic methods have been employed for enantioselective analysis of amino acids, including chromatography [9], circular dichroism (CD) [10], absorption [11], phosphorescence [12], fluorescence [13], and nuclear magnetic resonance (NMR) [14]. Among these techniques, fluorescence analysis stands out for its rapid analysis and direct imaging capabilities of chiral substrates [15,16]. Many research laboratories focus on the enantioselective fluorescence recognition of free amino acids [17-20]. Currently, most chiral recognition methods for amino acids rely on the intensity difference between two enantiomers mediated by fluorescent probes [21,22]. However, due to the inherent variability in fluorescence intensity, the accuracy and reproducibility of fluorescence-based methods can be compromised [23]. Moreover, these chiral fluorescent receptors typically require a known concentration of amino acid enantiomers for measurement [24].
In addition to changes in fluorescence intensity, if the emission wavelength of the fluorescent probe also varies with external stimuli, the resulting color differences due to wavelength shifts will enhance the contrast between the two amino acid enantiomers [25]. Moreover, given the limited factors influencing wavelength and luminescent color changes, precise recognition of chiral amino acid can be achieved. Currently, most chiral fluorescent detection methods for amino acids are conducted in organic or mixed phases [26,27]. These probes are not suitable for identifying chiral amino acids in pure aqueous solutions, which limits their effectiveness for detecting water-soluble amino acids and chiral amino acid molecules used as disease biomarkers [28,29]. Recently, our team and other research groups have reported that certain fluorescent probes can detect chiral amino acids in water through changes in fluorescence intensity [30-32]. However, due to the significant challenges in designing probes with emission wavelengths dependent on the enantiomeric composition of amino acids, there have been no reports on the enantioselective detection of amino acids in aqueous solutions utilizing emission wavelength changes.
Herein, we report the first detection of chiral amino acids in aqueous solution via the emission wavelength shifts of a fluorescent probe. The water-soluble probes (R)-Z1 and (R)-Z2 are designed and synthesized by ingeniously incorporating carboxyl groups into the 1,1′-bi-2-naphthol (BINOL) framework. Specifically, chiral fluorescent probe (R)-Z1 containing one carboxyl group can enantioselectively recognize 14 types of amino acids in water through distinct luminescent colors (Fig. 1), whereas probe (R)-Z2 with two carboxyl groups can only detect enantiomers of three types of chiral amino acids. Moreover, the probe (R)-Z1 can further determine enantiomeric excess by changes in luminescent color. Studies using CD, density functional theory (DFT), NMR, and mass spectrometry provide insights into the observed high enantioselectivity. Leveraging the wavelength variation and distinct luminescent colors for chiral amino acid detection, an INHIBIT logic gate with three inputs and two outputs has been successfully constructed. Additionally, we utilize the wavelength variation of probe (R)-Z1 to establish dual-channel detection of chiral amino acids within food and cells.
Figure 1
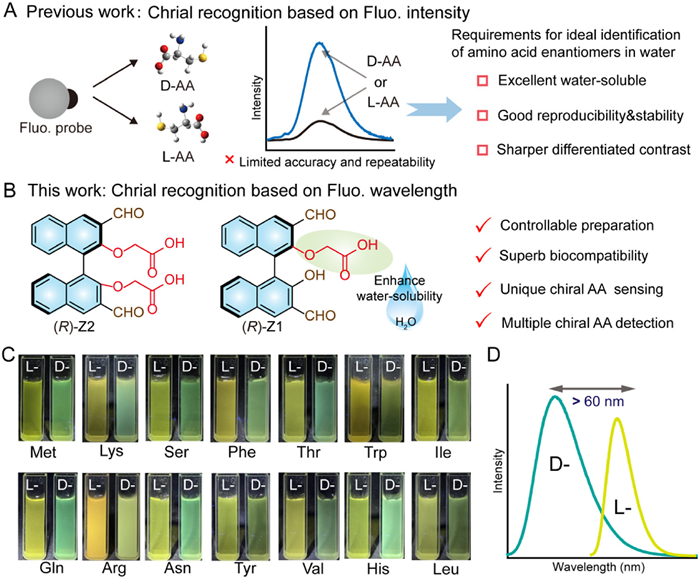
Figure 1.
(A) The previously reported chiral fluorescent probe for detecting amino acid enantiomers in water. (B) The molecular structure of the water-soluble chiral fluorescent probes (R)-Z1 and (R)-Z2. (C) The probe (R)-Z1 can distinguish D/L-enantiomers of multiple amino acids through changes in luminescence color (365 nm excitation). (D) Specifically, the chiral fluorescent probe developed in this study distinguishes D/L-amino acids by wavelength shifts exceeding 60 nm. Fluo.: fluorescence, AA: amino acid.
In order to enhance the applicability of fluorescent probe while optimizing their photophysical properties for identification of chiral amino acids, our group has been focused on developing high-performance chiral fluorescent molecule, such as leveraging BINOL scaffold [33]. We selected the carboxyl group as the preferred water-soluble fragment and incorporated it into the BINOL structure. The chiral fluorescent molecules (R)-Z1 and (R)-Z2 were synthesized through straightforward and efficient synthetic routes, which included nucleophilic substitution and hydrolytic reactions. These reactions utilized readily available intermediates (R)-7 (Scheme S1 in Supporting information) [34]. The chiral compounds (R)-Z1 and (R)-Z2 were effectively identified and characterized through the use of 1H and 13C NMR spectroscopy, along with HR-MS (Figs. S1–S12 in Supporting information). The compounds (S)-Z1 and (S)-Z2 were synthesized through the same synthetic routes as their enantiomers, using (S)-BINOL as the starting material (Figs. S13–S18 in Supporting information).
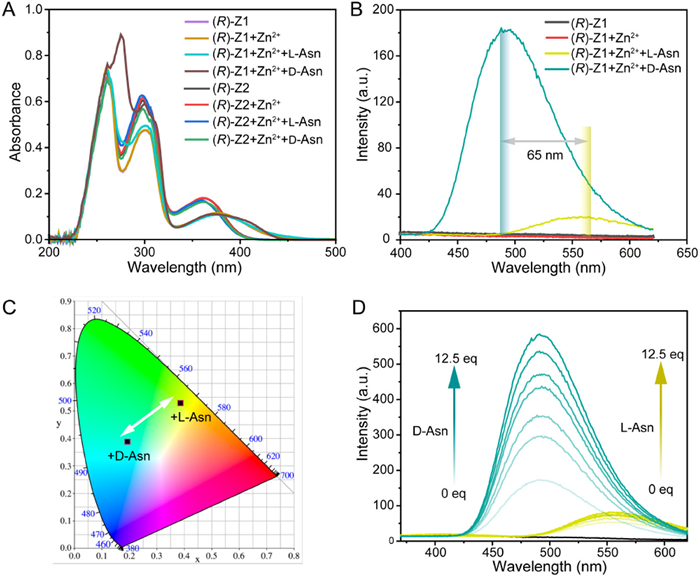
The UV-vis absorption spectra of the molecules (R)-Z1 and (R)-Z2 indicated that their respective maximum absorption wavelengths were 380 nm and 360 nm (Fig. 2A). Notably, the absorption wavelengths of (R)-Z1 and (R)-Z2 showed minimal changes upon reacting with zinc ions and D/L-asparagine (Asn) compared to their pre-reaction states. As illustrated in Fig. 2B, the emission peak of (R)-Z1 shifted from 555 nm after reacting with L-Asn to 490 nm after reacting with D-Asn, resulting in a wavelength difference of 65 nm. The Commission Internationale de l′Eclairage (CIE) coordinates were utilized to demonstrate the color change in the photoluminescence emission of (R)-Z1+Zn2+ following the reaction with D/L-Asn (Fig. 2C). In contrast, the emission peaks of (R)-Z2 remained at 520 nm after reacting with both L-Asn and D-Asn (Fig. S19 in Supporting information). These findings suggest that (R)-Z1 can effectively detect L-Asn and D-Asn in aqueous solutions by monitoring changes in emission wavelength. Moreover, we investigated the quantum yield (QY) and fluorescence lifetime of the probe (R)-Z1 before and after adding zinc ions and L-/D-amino acid enantiomers (Figs. S20 and S21 in Supporting information). The QY of (R)-Z1+Zn2+ with D-Asn were significantly higher than those of L-Asn addition, consistent with the fluorescence intensity trend. Additionally, the fluorescence lifetime decreased in the presence of D- or L-Asn compared to the probe alone or with zinc ions, which indicated that the probe molecules form rigid complexes with amino acids in the presence of Zn2+, leading to rapid excited-state energy dissipation and consequently shortened fluorescence lifetime.
Figure 2
Figure 2.
(A) UV–vis absorption spectra of (R)-Z1, (R)-Z1+Zn2+, (R)-Z1+Zn2++ D-/L-Asn, (R)-Z2, (R)-Z2+Zn2+, (R)-Z2+Zn2++ D-/L-Asn in water. (B) Fluorescence spectra of (R)-Z1, (R)-Z1+Zn2+, (R)-Z1+Zn2++ D-/L-Asn (excited by 317 nm). (C) CIE of (R)-Z1+Zn2++ D-/L-Asn, with varying emission wavelength in aqueous solution in accordance with (B). (D) Fluorescence spectra of (R)-Z1 with different concentrations of D/L-Asn in the emission window of 450−750 nm (excitation wavelength: 317 nm).
Further investigation showed a relationship between the fluorescence intensity of (R)-Z1 (555 nm, 490 nm) and amino acid concentration. The intensity of (R)-Z1+Zn2+ increased with D/L-Asn concentration within a certain range (Fig. 2D). Specifically, the fluorescence stabilized after adding 7 equiv. of D-Asn but only 2 equiv. of L-Asn (Fig. S22 in Supporting information). This indicates that (R)-Z1 correlates positively with L-Asn at 555 nm and D-Asn at 490 nm within specific ranges. Notably, the emission peak wavelengths for D-Asn (490 nm) and L-Asn (555 nm) remained constant regardless of concentration changes. This confirms that distinguishing amino acid chirality by emission wavelength differences is a precise analytical method.
Subsequently, we examined the correlation between the fluorescent intensity of probe (R)-Z1 and reaction time. Fluorescence intensity increased gradually within the first 60 min and stabilized between 60 min and 180 min (Fig. S23 in Supporting information). These results show that the probe provides a stable chirality-sensitive fluorescent response for enantioselective recognition. The fluorescent response of (R)-Z1 toward Asn was tested in buffer solutions across pH values (Fig. S24 in Supporting information). The result illustrates the relationship between enantioselective fluorescence enhancement ratio [ef, (ID-I0)/(IL-I0)] and pH values. (R)-Z1 exhibited robust enantioselectivity toward Asn at pH 7.4–8.6, with the highest ef value at pH 7.4. We also investigated the effect of Zn(Ⅱ) on enantioselectivity. Compared with other studied metal ions (Mg2+, Cu2+, Fe2+, Ni2+, Ca2+ and Ba2+), Zn(Ⅱ) markedly enhances the enantioselectivity of the probe towards Asn (Figs. S25 and S26 in Supporting information). As shown in Fig. 3A, adding Zn(Ⅱ) (0–2 equiv.) markedly increased fluorescence intensity for both L-Asn and D-Asn solutions, with D-Asn showing a more pronounced enhancement. These findings indicate that Zn(Ⅱ) complexation enhances enantioselectivity. We further investigated the performance of (R)-Z1 + Zn2+ in recognizing D-/L-amino acids in the presence of various cations and anions (Fig. S27 in Supporting information). Upon the addition of Zn2+, 16 different ions (Mg2+, Cu2+, Fe2+, Ni2+, Ca2+, Ba2+, Li+, K+, Ag+, Ru3+, Fe3+, Pb2+, F−, Cl−, NO3− and AcO−) were introduced individually. The introduction of Cu2+, Fe2+, Fe3+ and Ru3+ led to a pronounced change in the fluorescence intensity of L-/D-Asn, while all the involved cations and anions exerting minimal influence on the emission wavelength (Fig. S28 in Supporting information). This observation clearly demonstrates that the proposed method exhibits exceptional anti-interference capability, enabling (R)-Z1 to achieve efficient enantioselective recognition of chiral amino acids in water by modulating the emission wavelength.
Figure 3
Figure 3.
(A) The maximum fluorescence intensity of (R)-Z1 (1 equiv.) + L/D-Asn (25 equiv.) versus the equivalent amount of Zn2+ (λex = 317 nm, slits: 5/5 nm). (B) CD spectra of (R)-Z1, (S)-Z1, (R)-Z2 and (S)-Z2 (2.0 × 10⁻⁵ mol/L, pH 7.4). (C) The emission color changes of (R)-Z1 and (S)-Z1 with the ee of L-Asn (%).
Additionally, the chiroptical properties of BINOL derivatives containing (R)-Z1 and (R)-Z2 were characterized using CD spectroscopy. As shown in Fig. 3B, both (R)-Z1 and (R)-Z2 displayed positive-to-negative Cotton effects within the 200 nm to 350 nm range in aqueous solutions, while their (S)-enantiomers exhibited mirror-image CD spectra with similar intensity. These observations confirm that both (R)-Z1 and (S)-Z1, as well as (R)-Z2 and (S)-Z2, exhibit well-defined chiral structures.
We further investigated the interaction of both (R)- and (S)-Z1 with Asn possessing various enantiomeric compositions and visualized the enantiomeric composition of the amino acid through fluorescence analysis (Fig. 3C). We observed that as the enantiomeric excess (ee) of L-Asn increased, the emission color of probe (R)-Z1 progressively shifted from cyan to yellow-green under UV lamp irradiation, whereas the emission color of probe (S)-Z1 progressively shifted from yellow-green to cyan under UV light. This chromatic shift serves as an indicator of the enantiomeric composition of the amino acid, a phenomenon that has not been previously reported. Simultaneously, under daylight, the solution of (R)-Z1 gradually changed from colorless to yellow, while the solution of (S)-Z1 gradually changed from yellow to colorless. The fluorescence response of each enantiomeric probe was plotted as a function of the ee values of Asn (Fig. S29 in Supporting information). Furthermore, the CIE chromaticity diagram revealed that the CIE coordinates vary with the ee values.
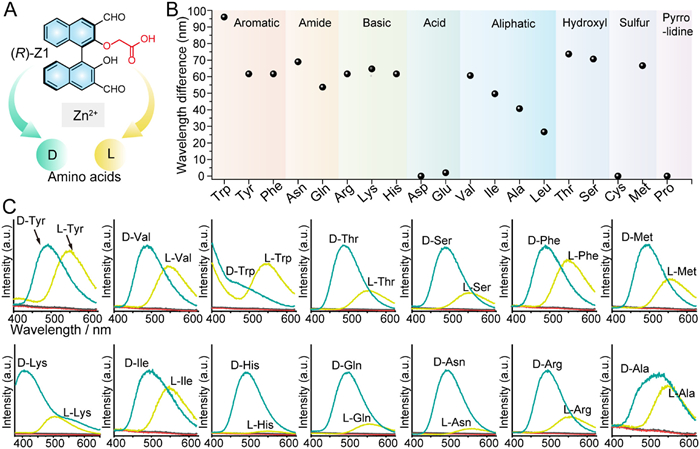
To demonstrate the universality of the (R)-Z1 molecule for fluorescence chiral sensing in aqueous solutions, we applied the established protocol to a series of chiral amino acids as shown in Fig. 4A. All 19 natural chiral amino acids were individually reacted with the probe (R)-Z1 and zinc ion complex, and the wavelength difference values for each enantiomer pair were recorded (Fig. 4B). Among these, 14 pairs of amino acid enantiomers could be reliably discriminated in water (Fig. S30 in Supporting information). And most of the amino acid enantiomers showed a wavelength change greater than 60 nm after interaction with the probe (R)-Z1. The relative fluorescence intensity of (R)-Z1 + Zn2+, and (R)-Z1 + Zn2+ + L-/D-amino acid was illustrated in Fig. 4C. Notably, from the perspective of fluorescence intensity, the probe exhibits significantly stronger chiral recognition capabilities for the three amino acids of Asn, His, and Gln, compared to the other 16 amino acids. Additionally, based on the signal differences in emission wavelengths, the probe demonstrates high chiral recognition ability for 14 amino acids. Amino acids containing aromatic, hydroxyl, basic and amide groups, exhibited superior distinguishability both visually and spectroscopically. Conversely, the chirality of two acid amino acids (Asp and Glu) could not be discerned.
Figure 4
Figure 4.
(A) The chemical structure of the fluorescent probe used for the detection of nineteen chiral amino acids. (B) Emission wavelength difference for chiral amino acids grouped into various structural categories. (C) Fluorescence spectra of (R)-Z1, (R)-Z1 +Zn2+, (R)-Z1 + Zn2++D-/L-amino acids (excited by 317 nm). The red line indicates (R)-Z1, and the black line indicates (R)-Z1+Zn2+.
Additionally, the fluorescence responses of (R)-Z2 in combination with Zn(OAc)2 toward 19 common amino acids are shown in Fig. S31 (Supporting information). Compared to (R)-Z1, which can recognize over a dozen amino acids, (R)-Z2 detects only a few amino acids (Arg, Gln, Lys) through changes in luminescent color. These results indicate that (R)-Z1 outperforms (R)-Z2 in the ability to recognize the chirality of amino acids in water through color and wavelength changes.
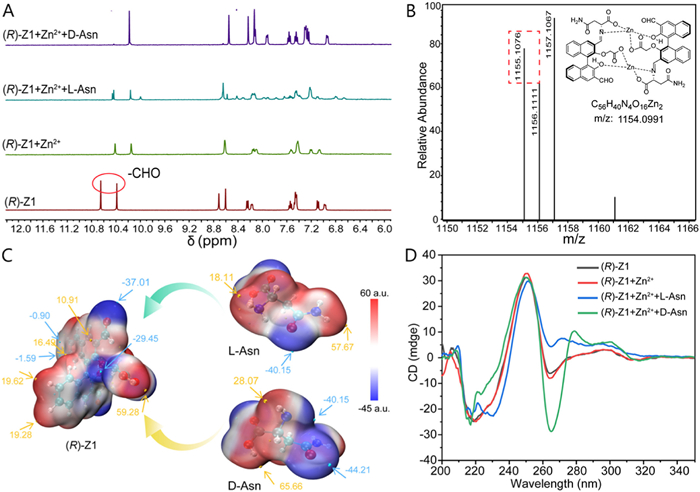
To better comprehend the pronounced enantioselective fluorescent response of (R)-Z1 towards amino acids, we performed a 1H NMR spectroscopic analysis of the interaction between (R)-Z1 and Asn in the presence of Zn2+. As shown in Fig. 5A, upon adding Zn2+ (1.0 equiv.) to a solution of (R)-Z1 in HEPES (2-[4-(2-hydroxyethyl)piperazin-1-yl]ethanesulfonic acid) buffer, the 1H NMR signals broadened and shifted up-field. Subsequent addition of L-Asn (12.5 equiv.) resulted in a mixture of products, with a significant amount of unreacted (R)-Z1 remaining. In contrast, after introducing D-Asn (12.5 equiv.), one of the aldehyde proton signal at δ 10.40 almost completely disappeared (Fig. 5A). These findings suggest that out of the two aldehyde groups in the probe molecule, only one is involved in the reaction with amino acids.
Figure 5
Figure 5.
(A) 1H NMR spectra of the (R)-Z1 (line 1), (R)-Z1 (2 mmol/L, 1 equiv.) + Zn2+ (1 equiv.) (line 2), (R)-Z1 (2 mmol/L, 1 equiv.) + Zn2+ (1 equiv.) + L-Asn (12.5 equiv.) (line 3), (R)-Z1 (2 mmol/L, 1 equiv.) + Zn2+ (1 equiv.) + D-Asn (12.5 equiv.) (line 4), the solvents are pH 7.4 HEPES buffer prepared by D2O. (B) HRMS of the mixture of (R)-Z1 (2 mmol/L, 1 equiv.), Zn2+ (1 equiv.) and D-Asn (12.5 equiv.), the solvent is pH 7.4 HEPES buffer. (C) The calculated distribution of ESP in (R)-Z1, D-Asn, and L-Asn at B3LYP/Def2SVP level. (D) CD spectra of (R)-Z1 (2.0 × 10⁻⁵ mol/L, pH 7.4) + Zn2+ in the presence of D- and L-Asn.
To further elucidate the mechanism of the fluorescent enantioselective enhancement of probe (R)-Z1 toward Asn, HRMS was conducted on the mixtures of (R)-Z1 with D- or L-enantiomers of Asn in the presence of Zn2+. As shown in Fig. 5B, HRMS analysis of the reaction between (R)-Z1 + Zn2+ and D-Asn revealed a signal at m/z = 1155.1076, corresponding to the resulting product [M + H]+ (calcd. for [M + H]+ 1155.0991). Additionally, CD spectroscopy was employed to investigate the interaction of (R)-Z1 + Zn2+ with D- and L-Asn in aqueous solution (Fig. 5D). (R)-Z1 exhibited a negative CD signal at 265 nm. The addition of Zn2+ alone did not significantly alter the CD spectrum. However, the simultaneous addition of Zn2+ and D-Asn intensified the negative signal, while the co-addition of Zn2+ and L-Asn caused a shift from a negative to a positive signal at 265 nm. These CD spectra suggest significant structural changes in the probe upon interaction with amino acid enantiomers. Integrating the results from 1H NMR, HRMS, and CD spectroscopy, it is evident that the differential reactivity of the probe molecule with amino acid enantiomers induces the observed enantioselective fluorescent response.
DFT calculations were conducted to further elucidate the luminescence mechanism of the probes. The theoretical feasibility of this fluorescence enhancement mechanism was validated through structure optimization and frequency analysis. DFT calculations were utilized to investigate the recognition mechanism of (R)-Z1. Specifically, we analyzed the molecular electrostatic potential (ESP) distributions at the B3LYP/Def2SVP level using Gaussian 16 (Fig. 5C) [35]. Our results indicate that the aldehyde group of (R)-Z1 exhibits a negative ESP value (-37.01 kcal/mol). Notably, the amino group in D-Asn displays a more positive ESP value compared to that in L-Asn. Based on these ESP distributions, it is reasonable to infer that D-Asn is more likely to undergo nucleophilic addition reactions with (R)-Z1 than L-Asn due to stronger electrostatic interactions. These theoretical findings are consistent with our experimental observations.
Specifically, the energy band gaps (ΔE) between the highest occupied molecular orbital (HOMO) and the lowest unoccupied molecular orbital (LUMO) for (R)-Z1 + D-Asn and (R)-Z1 + D-Asn+Zn2+ were determined to be 3.79 eV and 3.65 eV, respectively (Fig. S32 in Supporting information). Notably, the molecular frontier orbitals of (R)-Z1+D-Asn exhibit localized excited-state features, with both the HOMO and LUMO confined to a single naphthalene ring within the BINOL framework. In contrast, for (R)-Z1 + D-Asn+Zn2+, the LUMO is delocalized across the entire BINOL structure, while the HOMO remains primarily localized on the same naphthalene ring. This spatial distribution facilitates more efficient intramolecular charge transfer in the excited state of (R)-Z1 + D-Asn + Zn2+, which likely accounts for the observed enhancement in fluorescence intensity. Moreover, the dihedral angles of (R)-Z1 + D-Asn + Zn(Ⅱ) (113° and 120°) are larger than those of (R)-Z1 + D-Asn (97°), indicating weaker π-π stacking interactions in the (R)-Z1 + D-Asn + Zn(Ⅱ) complex. This difference in π-π stacking may contribute to variations in fluorescence intensity when distinguishing between D- and L-amino acids.
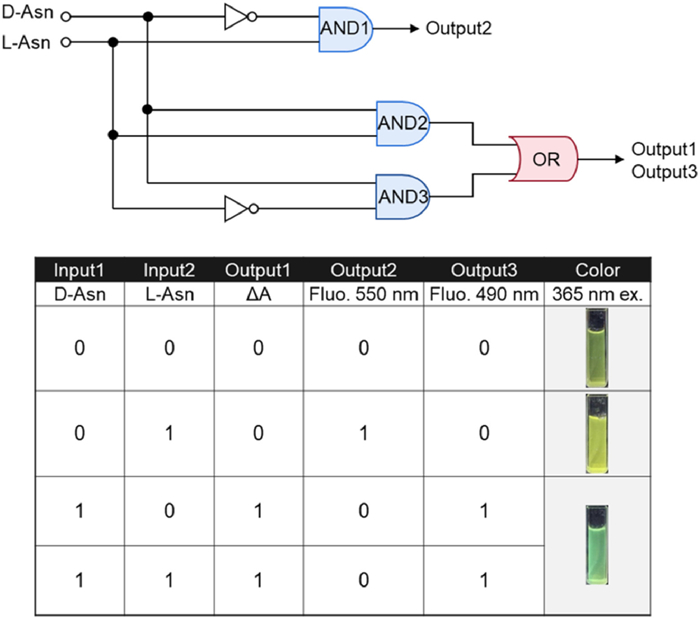
By constructing multiple logic gates, including AND, OR, and INHIBIT, we achieved fluorescence visualization screening of Asn enantiomers. Utilizing the principles of Boolean algebra, molecular logic gates convert binary chemical signals into corresponding binary outputs, thereby enabling the development of intelligent sensors. We designed a combination of two or three simple logic gates to transform two inputs into three distinct output signals. Specifically, the presence and absence of L- and D-Asn are defined as "1" and "0", respectively, serving as inputs. As illustrated in Fig. 6, the table summarizes the truth values for these logic gates, demonstrating the probe's responses under various input conditions. In the absence of amino acids, no change in ΔA was observed, and no emission peaks were detected, resulting in the PASS 0 gate output (0, 0, 0). The presence of D-Asn, whether in enantiomerically pure solutions or racemic mixtures, triggers an output signal of (1, 0, 1). An enantiomerically pure L-Asn solution produces an output signal of (0, 1, 0). Representative colors in the truth table include bright yellow for L-Asn and cyan for D-Asn. This molecular circuit holds significant potential for intelligent analysis of enantiomeric purity in chiral compounds through fluorescence emission color identification.
Figure 6
Figure 6.
Block diagrams and truth tables for the logical analysis instrument used in monitoring the enantiopurity of Asn.
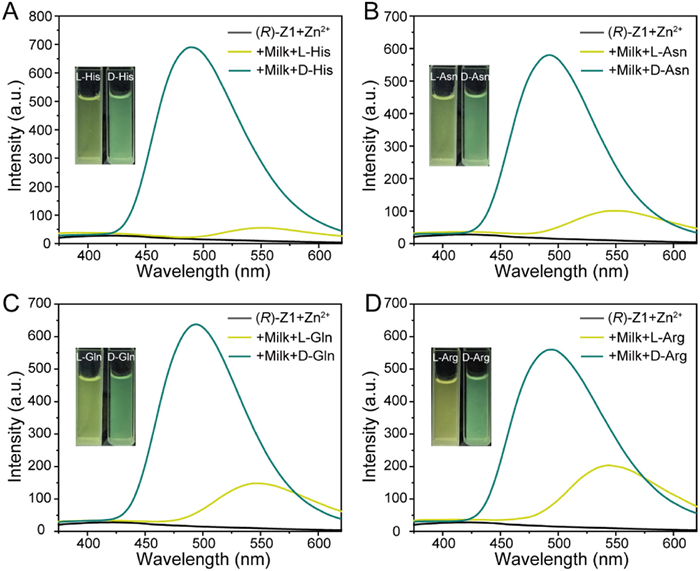
Inspired by the fluorescent probe (R)-Z1, which exhibits high selectivity, sensitivity and the ability to detect chiral amino acids via distinct channels, we evaluated its potential for detecting chiral amino acids in milk. L-type amino acids in milk are essential nutrients that support life activities and promote growth and development, while abnormal accumulation of D-type amino acids may have adverse effects on health. Investigating their chiral properties is crucial for optimizing dairy processing techniques, developing infant formula, and ensuring food safety. To further assess the efficacy of (R)-Z1 in detecting chiral amino acids such as Asn, His, Gln, and Arg in milk, L/D-amino acids were added to milk solutions, and visualization images were obtained under 365 nm ultraviolet light irradiation. As shown in Fig. 7, probe (R)-Z1 effectively differentiated the D- and L-enantiomers of Asn, His, Gln, and Arg in these samples through distinct luminescence intensity and color changes. Fluorescence spectroscopy confirmed the ability of (R)-Z1, in combination with Zn2+, to distinguish D- from L-amino acids in milk. Specifically, the fluorescence emission wavelength exhibited a red shift in the presence of L-amino acids (520–600 nm channel) compared to D-amino acids (420–500 nm channel). These results demonstrate that probe (R)-Z1 can accurately detect chiral amino acids in food samples such as milk through changes in emission wavelength.
Figure 7
Figure 7.
Fluorescence response of (R)-Z1+Zn2+ to D-/L-amino acids in milk: (A) His, (B) Asn, (C) Gln, and (D) Arg. Inset images: Corresponding luminescent images of D-/L-amino acids excited by 365 nm laser.
Subsequently, chiral amino acids at the cellular level were detected via dual channels employing the (R)-Z1 probe. The feasibility and biosafety of (R)-Z1 were assessed in HeLa cells via standard MTT assays (Fig. S33 in Supporting information). The results demonstrated that (R)-Z1 showed negligible cytotoxicity across a wide range of concentrations, confirming its excellent biocompatibility. The results of enantioselective fluorescence imaging of amino acids are presented in Fig. S34 (Supporting information). The images from left to right correspond to blue channel imaging (420–500 nm), green channel imaging (520–600 nm), and merged field imaging. When HeLa cells were incubated with (R)-Z1 and Zn2+, no detectable blue or green fluorescence was observed. Upon incubation with L-Asn, Zn2+, and (R)-Z1, only faint blue fluorescence was detected, while significant green fluorescence was observed. Conversely, when incubated with D-Asn, Zn2+, and (R)-Z1, only faint green fluorescence was detected, while significant blue fluorescence was observed. The relative intensity of the green and blue fluorescent signal was quantified using ImageJ software. The green fluorescent intensity of HeLa cells incubated with L-Asn was 4 times higher than that of cells incubated with D-Asn, whereas the blue fluorescence intensity of HeLa cells incubated with D-Asn was 14 times higher than that of cells incubated with L-Asn. These findings indicate that probe (R)-Z1 can perform enantioselective fluorescent imaging of Asn through dual blue and green channels in cells, effectively distinguishing chiral amino acids at the cellular level.
In summary, we have successfully synthesized a water-soluble fluorescent probe (R)-Z1 with exceptional enantiomeric recognition ability for amino acids through rational chiral molecular design. In aqueous solution, in the presence of zinc ions, (R)-Z1 emits blue light with a maximum emission peak at 490 nm when bound to D-Asn, and green light with a maximum emission peak at 555 nm when bound to L-Asn. This difference in emission wavelength and color allows for precise discrimination of chiral Asn. Beyond Asn, (R)-Z1 can efficiently detect the other 13 common amino acid enantiomeric pairs (Tyr, Val, Trp, Thr, Ser, Phe, Met, Lys, Ile, His, Gln, Ala, Arg) via changes in emission wavelength (> 60 nm) and color differences. Furthermore, the enantiomeric composition of amino acids can be visualized using the luminescent color changes induced by (R)-Z1. By leveraging variations in wavelength and unique luminescent colors, we have successfully constructed an INHIBIT logic gate with three inputs and two outputs for detecting chiral amino acids. Importantly, we have also achieved dual-channel imaging of Asn enantiomers within milk and cells using (R)-Z1. Our research focuses on the enantioselective recognition of amino acids and provides a robust water-soluble chiral fluorescent probe. Moreover, it paves the way for the development of intelligent fluorescent sensors capable of precise enantioselective detection of chiral amino acids in the fields of biomedicine, chemistry, and food science.
Declaration of competing interest
The authors declare that they have no known competing financial interests or personal relationships that could have appeared to influence the work reported in this paper.
CRediT authorship contribution statement
Yi-Xin Zhang: Writing – original draft, Methodology, Investigation, Formal analysis. Fang-Qi Zhang: Investigation, Data curation. Ao-Pei Peng: Investigation, Data curation. Tao Jiang: Formal analysis, Data curation. Ya-Xi Meng: Data curation. Yang Li: Writing – review & editing, Resources, Investigation. Shuang-Xi Gu: Writing – review & editing, Supervision, Resources, Methodology. Yuan-Yuan Zhu: Writing – review & editing, Funding acquisition, Conceptualization.
Acknowledgments
We gratefully acknowledge the financial support from the National Natural Science Foundation of China (Nos. 22377097, 22307036, 22074114), Natural Science Foundation of Hubei Province of China (Nos. 2020CFB623, 2021CFB556), Engineering Research Center of Phosphorus Resources Development and Utilization of Ministry of Education (No. LCX202305).
Supplementary materials
Supplementary material associated with this article can be found, in the online version, at doi:10.1016/j.cclet.2025.111500.
[1]
Y. Liu, Z. Wu, D.W. Armstrong, H. Wolosker, Y. Zheng, Nat. Rev. Chem. 7 (2023) 355–373. doi: 10.1038/s41570-023-00476-z
[2]
N. Manoranjan, W. Fang, Y. Zhu, J. Jin, Angew. Chem. Int. Ed. 64 (2025) e202417088. doi: 10.1002/anie.202417088
L. Yang, S. Qin, X. Su, et al., Org. Biomol. Chem. 8 (2010) 339–348. doi: 10.1039/B908540H
[33]
Y.Y. Zhu, X.D. Wu, S.X. Gu, L. Pu, J. Am. Chem. Soc. 141 (2019) 175–181. doi: 10.1021/jacs.8b07803
[34]
H.C. Zhang, W.S. Huang, L. Pu, J. Org. Chem. 66 (2001) 481–487. doi: 10.1021/jo001276s
[35]
J. Huang, C. Li, P. Zhang, et al., Sens. Actuator B: Chem. 423 (2025) 136861. doi: 10.1016/j.snb.2024.136861
Figure 1
(A) The previously reported chiral fluorescent probe for detecting amino acid enantiomers in water. (B) The molecular structure of the water-soluble chiral fluorescent probes (R)-Z1 and (R)-Z2. (C) The probe (R)-Z1 can distinguish D/L-enantiomers of multiple amino acids through changes in luminescence color (365 nm excitation). (D) Specifically, the chiral fluorescent probe developed in this study distinguishes D/L-amino acids by wavelength shifts exceeding 60 nm. Fluo.: fluorescence, AA: amino acid.
Figure 2
(A) UV–vis absorption spectra of (R)-Z1, (R)-Z1+Zn2+, (R)-Z1+Zn2++ D-/L-Asn, (R)-Z2, (R)-Z2+Zn2+, (R)-Z2+Zn2++ D-/L-Asn in water. (B) Fluorescence spectra of (R)-Z1, (R)-Z1+Zn2+, (R)-Z1+Zn2++ D-/L-Asn (excited by 317 nm). (C) CIE of (R)-Z1+Zn2++ D-/L-Asn, with varying emission wavelength in aqueous solution in accordance with (B). (D) Fluorescence spectra of (R)-Z1 with different concentrations of D/L-Asn in the emission window of 450−750 nm (excitation wavelength: 317 nm).
Figure 3
(A) The maximum fluorescence intensity of (R)-Z1 (1 equiv.) + L/D-Asn (25 equiv.) versus the equivalent amount of Zn2+ (λex = 317 nm, slits: 5/5 nm). (B) CD spectra of (R)-Z1, (S)-Z1, (R)-Z2 and (S)-Z2 (2.0 × 10⁻⁵ mol/L, pH 7.4). (C) The emission color changes of (R)-Z1 and (S)-Z1 with the ee of L-Asn (%).
Figure 4
(A) The chemical structure of the fluorescent probe used for the detection of nineteen chiral amino acids. (B) Emission wavelength difference for chiral amino acids grouped into various structural categories. (C) Fluorescence spectra of (R)-Z1, (R)-Z1 +Zn2+, (R)-Z1 + Zn2++D-/L-amino acids (excited by 317 nm). The red line indicates (R)-Z1, and the black line indicates (R)-Z1+Zn2+.

 DownLoad:


 下载:
下载:


 下载:
下载:
