Figure 1.
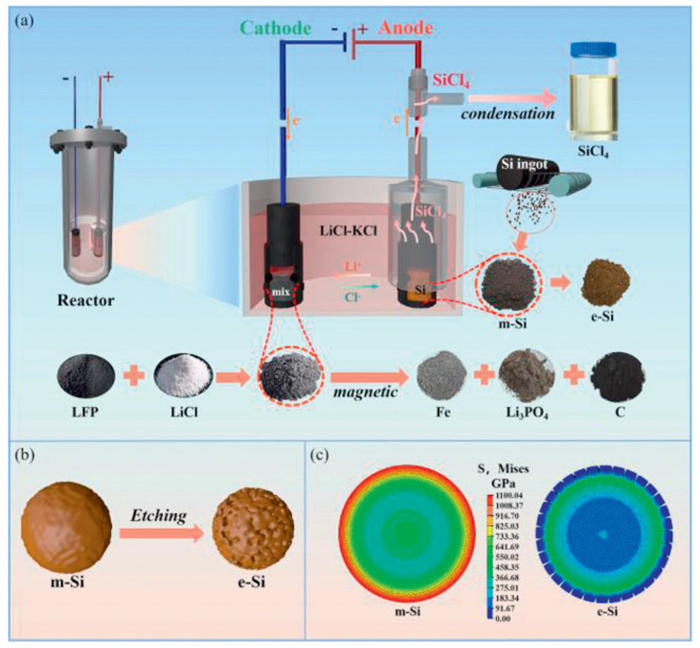
(a) Process diagram of molten salt electrolytic chlorination. (b) Diagram of m-Si Etching. (c) Abaqus finite element stress analysis of the lithium insertion process in Si powder cross-section.
Electrochemical etching of photovoltaic micron-silicon scrap in molten KCl-LiCl for high-performance lithium-ion battery anodes
Yagang Yang , Hanqing Dong , Kai Yu , Qiushi Song , Zhiqiang Ning , Hongwei Xie

The development of solar silicon-based (SoG-Si) photovoltaic cell technology has brought a huge amount of clean electrical energy to mankind [1]. However, >40% of a SoG-Si ingot becomes powder and goes into slurry waste in the conventional wafer slicing process, generating a significant amount of micron-sized silicon scrap (m-Si) [2]. Approximately 2.0 × 10⁵ tons of micron-sized SoG-Si scrap is generated in China, causing serious environmental pollution [3]. Therefore, the utilization of the m-Si scrap as raw material is currently a hot topic [4], such as silicon alloys [5], silicon nitrides [6], and anode material for lithium-ion batteries (LIBs) [7-9]. Among them, its practice as an anode material of LIBs has attracted widespread attention due to the high theoretical specific capacity of silicon (3579 mAh/g at room temperature and 4200 mAh/g at elevated temperatures) [10-14]. However, m-Si cannot be used directly as an anode material in LIBs because its large particle size results in volumetric changes during the charge-discharge cycles, and further pulverization and detachment from the electrode [15,16]. To address this problem, researchers have made efforts in many methods such as high-energy ball milling to reduce the size of the particles [17], chemical etching to make them porous and small size [18]. Ball milling not only requires an inert atmosphere to prevent Si oxidation, but also struggles to achieve the smaller nanostructures [19]. Chemical etching methods are marked by their low energy consumption, including both indirect and direct etching methods. The indirect method is a multi-step design technique that typically involves forming an alloy of the m-Si with an active metal element M to create M-Si (M = Mg [20,21], Al [22], Li [23], Ca [24]) followed by removing the alloying element from the matrix, thereby processing m-Si into a high performance porous silicon anode material. Ma et al. first alloyed m-Si with Mg, and then electrochemically removed Mg from the formed Mg2Si alloy to prepare high performance porous silicon anode materials for LIBs [7]. Xu et al. employed P, Sr composite modification and increased cooling rates to refine the microstructure of cast Al-20Si alloy, followed by etching with hydrochloric acid and hydrofluoric acid to prepare porous silicon from Al-20Si [22]. However, expensive active metal raw materials and multiple steps limit the widespread use of the indirect etching method. The direct chemical etching method is a relatively simple and one step preparation of the porous m-Si using acids with noble metal catalysts or alkali solutions. Myungbeom et al. obtained a porous Si-C composite by etching the m-Si/C composite with NaOH [25]. Abdul et al. used AgNO3 assisted HF etching of monocrystalline silicon to prepare silicon nanowires [26]. However, these direct methods are either expensive, or use toxic acid or corrosive base reagents, which are also disadvantageous for widespread application. Therefore, the improvement of micronized silicon for lithium-ion anodes with environmental friendliness is still on the way.
Herein, we develop a novel electrochemical etching of m-Si to obtain high performance silicon anode materials for LIBs. The process involves an electrode pair with m-Si as the anode, and recycled lithium iron phosphate cathodes (LFP) from spent lithium-ion batteries as the cathode, in molten KCl-LiCl. The electrochemical etching of m-Si is carried out at the anode, which is a single step and avoids the direct use of conventional hazardous reagents, such as HF, Cl2 gas [27,28]. In addition, recently, with the increasing disposal of a large number of lithium iron phosphate batteries, the environmental and resource issues associated with these used batteries have become more focused, making the recycling and utilization of LFP an urgent issue that needs to be addressed [29]. In our design, the prepared e-Si-50 has superior specific capacity of 1061.2 mAh/g at 2.0 A/g, after 800 cycles. The electrochemical reduction of LFP from spent lithium-ion batteries at the cathode is not only converted to Li3PO4, Fe, and C, but also highly effectively separates these products by magnetic separation without acid or base. The new process not only enables the conversion from m-Si to high performance Si anode material of LIBs, but also covers the recycling of spent LIBs, which is simple, environmentally friendly and has a good application prospect.
Anhydrous LiCl (purity > 97.0%) and KCl (purity > 99.5%) powders were obtained from Xilong Scientific Co., Ltd. The m-Si (particle size ~10 µm, purity > 99.6%) was provided by Jiangsu Haobo New Materials Co., Ltd. The LFP was derived from the cathode sheets of pouch cells manufactured by a certain company, which were separated by calcination at 400 ℃. Analytical-grade chemicals were used without further purification, and all experiments used ultrapure water.
First, pre-dried LiCl-KCl (300 g, Li:K = 0.6:0.4, mol%) was placed into an alumina crucible (with an inner diameter of 83 mm and a height of 82 mm), sealed in a stainless-steel container heated by a vertical tube furnace, and heated in an argon atmosphere at a rate of 5 ℃/min to 500 ℃, held for 2 h until the mixed salt were completely melted. Secondly, a graphite sheet anode (20 × 20 × 3 mm3, > 99.9%) and a nickel foam cathode (15 × 15 × 1.5 mm3) were used for pre-electrolysis at 2.0 V for 6 h to further eradicate H2O residuals and Faradaic-interfering species from the molten salt. Then, electrochemical tests and electrolysis experiments were carried out. The cyclic voltammetry (CV) test used a three-electrode system, employing a graphite cavity electrode filled with m-Si (W) as the working electrode for the CV test (Fig. S1a in Supporting information), with a silver pole (R) of diameter 1.0 mm and purity > 99.99% as the quasi-reference electrode, and a small open-hole graphite crucible (Fig. S1b in Supporting information) carrying LFP as the counter electrode (C). The CV data were collected using a computer-controlled electrochemical workstation (CHI1130C, CH Instruments Ins., China), with a voltage range of −1~2.5 V and a scanning rate of 0.06 V/s. The linear sweep voltammetry (LSV) test used a two-electrode system, with the working electrode still being the W electrode, and both the reference and counter electrodes being the C electrode, with a voltage range of −1~3.5 V and a scanning rate of 0.06 V/s.
The molten salt electrolysis was performed in a custom two-electrode configuration operated in galvanostatic mode. Identical perforated graphite crucibles were employed as reaction vessels: One loaded with LFP serving as the cathode, and the other containing m-Si particles functioning as the anode (Fig. S1b). The constant-voltage electrolysis voltage was determined through analysis of CV and LSV tests. Subsequently, constant-voltage electrolysis was conducted, and the electrolysis was considered complete when the electrolysis current fell below 20 mA, simultaneously, the gases emanating from electrolysis were introduced to a blue wet cloth strip to test for the presence of chlorine gas, leveraging its oxidative bleaching property in this experiment. Furthermore, the electrolysis equipment used in the experiment was provided by the cell tester of Neware Electronics Co., Ltd., located in Shenzhen, China.
Following electrolysis, the electrochemical cell was preserved under an Ar atmosphere. Electrode extraction was conducted following system cooling to ambient temperature (25 ± 1 ℃). The anode product was washed with ultrapure water and dried by vacuum at 80 ℃ for 5 h. At the same time, the cathode products were separated by grinding magnetic separation.
This paper also refers to the thermomechanical strain model of silicon powders, with the particle size of the silicon powders being 5 mm, an elastic modulus of 160 GPa, a Poisson's ratio of 0.25, a thermal conductivity of 149 W m−1 K−1, and a thermal expansion coefficient of 0.01 m/K. The temperature difference is 300 K, corresponding to the lithiation expansion variation.
Microstructural and morphological analyses were conducted via field-emission scanning electron microscopy (FE-SEM; FEI Quanta FEG 250, 5.0 kV acceleration voltage). Crystallographic characterization employed X-ray diffraction (XRD; Bruker D8 Advance, Cu Kα radiation, λ = 1.5418 Å). Surface chemical states were probed using X-ray photoelectron spectroscopy (XPS; Thermo Fisher Scientific ESCALAB 250Xi, monochromatic Al Kα source, hν = 1486.6 eV). Nitrogen physisorption measurements at 77.3 K (Quantachrome Nova 4000e) enabled specific surface area determination through brunauer emmett teller (BET) analysis. Pore size distributions were derived from desorption branches using both barrett joyner halenda (BJH) formalism and non-local density functional theory (NLDFT) models, with total pore volumes quantified at P/P0 = 0.99.
The electrochemical performance of m-Si, e-Si-10, and e-Si-50 was evaluated using coin cells of the CR2025 type. The electrode slurry formulation consisted of 60 wt% active silicon, 20 wt% Super P Li (conductive carbon additive), and 20 wt% polyacrylic acid (PAA) binder. This homogeneous mixture was doctor-bladed onto oxygen-free copper foil to fabricate working electrodes, achieving precise mass loading control at 0.6 mg/cm2 through gravimetric calibration. The coated copper foils were then vacuum-dried at 85 ℃ for 10 h to dry the electrode and ensure adhesion. Subsequently, the dried coated copper foils were die-cut into round discs with a diameter of 12 mm, which were used as the working electrodes. Lithium foil served as both the counter electrode and the reference electrode. A polyethylene separator (Celgard 2400) was used to prevent direct contact among the electrodes, and 1 mol/L LiPF6 electrolyte, dissolved in a mixture of ethylene carbonate (EC), diethyl carbonate (DEC), and fluoroethylene carbonate (FEC) with a volumetric ratio of 3:6:1, was utilized for the electrolyte solution. The coin cells were assembled in an argon-filled glove box to minimize exposure to ambient moisture and oxygen.
The electrochemical performance of the batteries was evaluated with a LAND CT2001A battery testing system (Wuhan Land Electronics Co., Ltd., China). Galvanostatic charge-discharge (GCD) and constant current intermittent titration technique (GITT) measurements were performed within a voltage window of 0.01–1.5 V (vs. Li+/Li). Prior to testing, all cells underwent three GCD activation cycles at 0.1 A/g to stabilize their initial states. Subsequently, GCD tests were carried out at multiple current densities (0.2–2.0 A/g) to evaluate rate capability. For GITT analysis, cells were first cycled 10 times at 2.0 A/g, followed by applying a 1.0 A/g pulse current for 15 min with 1 h rest intervals between pulses, covering the 0.01–1.5 V range. Cyclic voltammetry (CV) were conducted on a CHI 760E electrochemical workstation (Shanghai, China). CV curves were obtained at 0.1 mV/s (0.01–1.5 V), with additional scans at 0.2–1.0 mV/s to analyze kinetic behavior.
Fig. 1 illustrates the schematic diagram of the process. The m-Si anode, and the lithium iron phosphate (LiFePO4, LFP) cathode are filled into the graphite crucible current collector, respectively. The LFP is reduced to form the Li3PO4 and Fe extracted by magnetic separation, respectively. The m-Si is electrochemically etched to form the e-Si (Figs. 1a and b). The preliminary thermodynamic calculations (Fig. S2 in Supporting information) show that the chlorination potential of silicon is of 1.45 V vs. Cl/Cl− from Cl− and Si to form the SiCl4 at the experimental temperature of 500 ℃, and is significantly more positive than that of the derived CCl4 (−0.03 V vs. Cl/Cl−). The result means that silicon can be chloritized before C. The reduction potentials of Li+/Li (−3.57 V vs. Cl/Cl−) and K+/K (−3.76 V vs. Cl/Cl−) are significantly more negative than that of the LiFePO4/Fe (−1.45 V vs. Cl/Cl−). Therefore, our electrode pair designation of the Si anode and the LFP cathode is theoretically feasible. In addition, the Abaqus finite element analysis in Fig. 1c shows that the internal stress of the derived e-Si with 456 GPa after etching is significantly lower than that of m-Si with 1100 GPa, implying that the etching can effectively decrease the internal stress of m-Si.
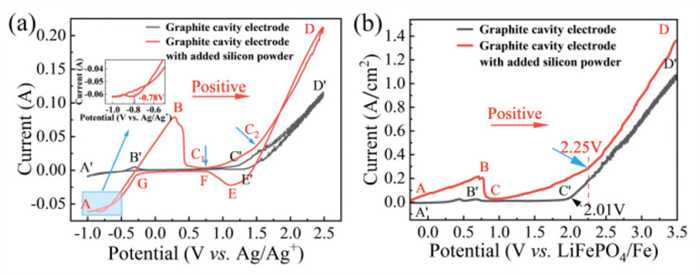
Fig. 2a shows the measured CV curves on the cavity electrode with and without Si. The CV curve (black) on the graphite cavity electrode without Si shows that there is almost no oxidation current except for a faint oxidation current wave (B') at approximately −0.29 V when the potential is positively scanned from −1.0 V to 1.25 V (A' → C'). Then oxidation current (C') of Cl− to Cl2 occurs at about 1.25 V and increases sharply as the potential rises from 1.25 V to 2.5 V (C' → D') [30]. Comparing the potential of peak B' with the that of peak C' reveals a difference of about 1.54 V, which is similar to the difference value (about 1.57 V) of potentials between carbon monoxide and chlorine gas derivatives in Fig. S3 (Supporting information, thermodynamic potential diagram). It indicated that oxidation peak B' corresponds to the oxidation of residual O2− (Li2O) in the molten salt [31], forming COx (where x = 1 or 2). However, a negative current appeared on the CV curve (red) of the graphite cavity electrode with silicon (Si) when the potential was scanned from −1.0 V to 2.5 V. As shown in the inset of Fig. 2a, the reduction current onset changed sharply above a potential of about −0.78 V (A). Next, the potential was about −0.29 V when the reduction current reached zero. Then, the oxidation current increased continuously and dropped sharply to about zero. Next, the oxidation current began to rise again at a potential of 0.75 V (C1). Finally, the oxidation current sharply increased at a potential of 1.5 V (C2). The potential of C1 pose is positive 1.04 V than that of COx gas on the CV curve (black), and is negative 0.75 V than that of C2 pose. As shown in Fig. S3, it can be found that the derived potential of SiCl4 is positive 0.67–0.81 V than that of COx gas, and is negative 0.76 V than that of Cl2 gas. The derived potential of COx gas is positive than that of SiO2 derivation. Therefore, it can be inferred that the potential of C1 is corresponding to the derivation of SiClx (x = 1, 2, 4) [32]. A little different of potential is attributed to passivation phenomenon of SiCl4 gas. The potential of C2 → D is corresponding to the derivation of Cl2 [33,34]. The reduction current may be attributed to the reduction of natural silica on the surface of the silicon from potential of −0.78 V (A) to −0.29 V. Then, the continuous increase in current was attributed to the oxidation of O2− on the silicon surface from potential of −0.29 V to 0.75 V(C1). The peak current (B) drops to zero from 0.3 V to 0.75 V (B → C1), a phenomenon that may arise from two factors: (1) The passivation of the electrode due to the formation of a SiO2 layer on the silicon surface [28]; (2) The complete consumption of O2− in the molten salt electrolyte. Referring to the graphite electrode, which only exhibits a weak oxidation peak at point B', we conclude that the abrupt drop in current from B → C1 is more predominantly associated with the depletion of O2− in the molten salt. The results prove that the electrochemical chlorination etching of silicon is feasible within the electrolysis windows of molten LiCl-KCl. The LSV curves of the anode with and without Si in the two-electrode system (Fig. 2b) suggest that the 2.25 V is the lowest cell voltage for the continuous evolution of SiCl4. Therefore, we set the cell potential of 3.0 V to electrochemically chlorination etch the Si for continuously to prepare the high performance Si anode material of LIBs. Of course, it may induce the Cl2 because the oxidation current in the LSV increases sharply above a potential of 2.25 V. However, the emissions gas analysis shows that the blue cloth strip did not experience any discoloration (Fig. S4 in Supporting information).
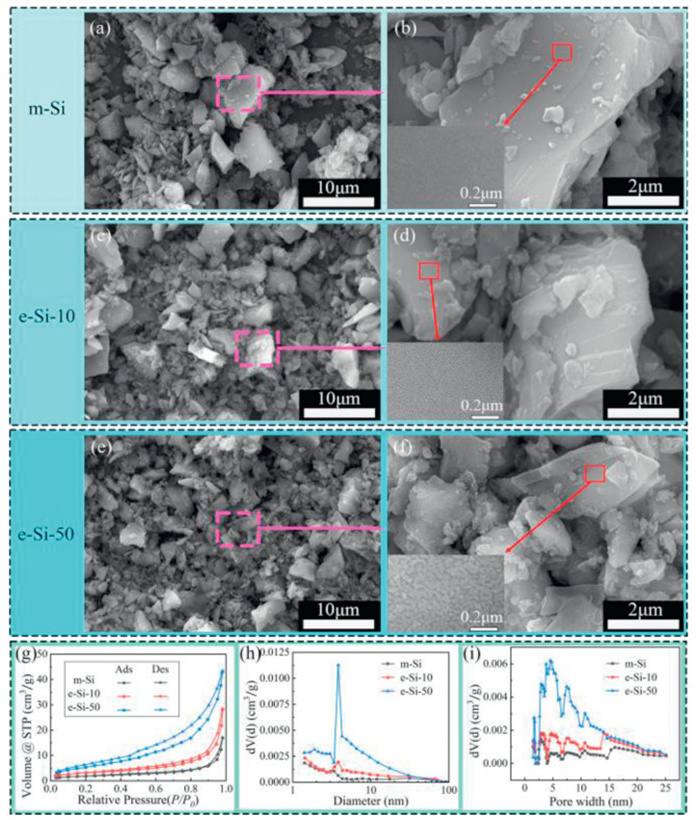
The SEM images of m-Si, the etched e-Si-10, and e-Si-50 at a cell voltage of 3.0 V are shown in (Figs. 3a–h), respectively. As the etch amount increases, the silicon particles become more uniform, in which large-size decrease significantly and their size decrease from 10 µm to 5 µm (Figs. 3a, c and e). Moreover, the insets in their local enlarged SEM image (Figs. 3b, d and f) show that the surface of the etched Si particle also gradually becomes rough. The adsorption-desorption isotherm curves in Fig. 3g show that m-Si, e-Si-10, and e-Si-50 have a hysteresis loops in the relative pressure (P/P0) range of 0.9–1.0, the 0.05–1.0 and lower P/P0 ranges, respectively. The results indicate that their pore characteristics conform to type Ⅲ isotherms [34], are mesoporous structures, and also gradually increase with the increase of etching amount. In addition, the BJH and DFT pore size distribution in (Figs. 3h and i) shows that the e-Si-10 has an increased mesopore range of 3–70 nm compared to that of m-Si, in which is particularly noticeable within the 3–30 nm interval and the small pore size range of 2–3 nm is observed. The e-Si-50 shows a marked increase in the quantity of micropores within the 1.4–2 nm range as the etch amount increases. The calculated BET specific surface areas of m-Si, e-Si-10, and e-Si-50 are 6.734, 11.414, and 20.323 m2/g, respectively, and gradually increase. These results indicate that electrochemical chlorination etching can make silicon particles become small and porous structures, which would play an important role in buffering volume expansion and potentially improving the stability and cycle life of silicon anode materials in lithium-ion battery applications [7]. Obviously, the e-Si-50 has above advantages.
The XRD pattern of m-Si, e-Si-10 and e-Si-50 in Fig. S5 (Supporting information) shows that their intense and sharp diffraction peaks are clearly attributed to the crystal structure of silicon (JCPDS No. 27–1402) [33], indicating that the electrochemical chloritizing etching process does not change the phase structure of Si. However, the XPS spectra of m-Si, e-Si-10 and e-Si-50 show that the chemical compositions on their surface are the primary elements Si and O (Fig. S6a in Supporting information). In addition, the elements N and S were also detected on the m-Si surface, which are attributed to the coolants used in the photovoltaic silicon cutting process. The high-resolution Si 2p spectra in Figs. S6b–d (Supporting information) reveal that there are three characteristic peaks located at 99.9, 100.5, and 103.9 eV, corresponding to the Si-Si and Si-O bonding states of silicon. The presence of the Si-O peak is the result of unavoidable minor oxidation of silicon when exposed to air [35,36]. Notably, removing residues from the coolants is typically challenging for conventional processes [37,38]. They can be directly removed in our process due to decomposition at the high temperatures.
The rate performance of m-Si, e-Si-10, and e-Si-50 is shown in Fig. 4a. The e-Si-10 delivers an average reversible capacity of 3084.3, 2862.9, 2508.7, 2104.4, 1598.3, and 1151.4 mAh/g at current densities of 0.1, 0.2, 0.5, 1.0, 2.0, and 3.0 A/g, respectively. Its capacity retention rates at 0.2 and 0.5 A/g are 92.8% and 81.3% of its average discharge capacity at 0.1 A/g. The e-Si-50 delivers an average reversible capacity of 3015.1, 2615.5, 2309.2, 1983.7, 1591.1, and 1300.3 mAh/g at current densities of 0.1, 0.2, 0.5, 1.0, 2.0, and 3.0 A/g, respectively. Its capacity retention rates at 0.2 and 0.5 A/g are 86.7% and 76.6% of its average discharge capacity at 0.1 A/g. Both e-Si-10 and e-Si-50 exhibit good rate performance, which significantly improved the cycling performance of m-Si (Table S1 in Supporting information). Even at 3.0 A/g, the capacity of the e-Si-50 anode is 1300.3 mAh/g Additionally, when the current density was returned to 0.1 A/g, the reversible capacities for m-Si, e-Si-10, and e-Si-50 were 119.8, 2656.7, and 2637.8 mAh/g, respectively, demonstrating that the etched silicon possesses good structural stability.
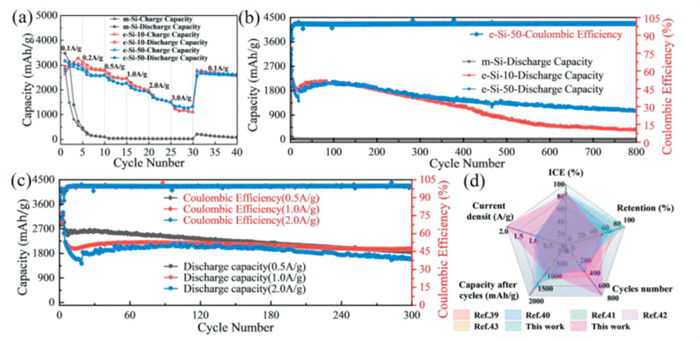
Fig. 4b shows the e-Si-50 electrode demonstrated excellent cycling stability after 800 cycles at 2.0 A/g, retaining a capacity of 1062.1 mAh/g, which corresponds to a capacity retention rate of 60.1% compared to the 10th cycle. Its initial discharge capacity is of 3066.2 mAh/g, corresponding to an initial Coulombic efficiency (ICE) of 84.7%. The initial discharge specific capacity of e-Si-10 is 3098.1 mAh/g, with ICE of 86.0%. The cycle stability of e-Si is significantly better than that of m-Si.
Fig. 4c shows the cycling performance of the e-Si-50 electrode at current densities of 0.5, 1.0, and 2.0 A/g. The e-Si-50 exhibited good cycling performance. The initial discharge capacities were 2832.3, 3224.2, and 3066.2 mAh/g, respectively, with ICEs of 85.9%, 85.8%, and 84.7%. After 300 cycles, it was still possible to achieve capacities of 1832.5, 1970.2, and 1690.9 mAh/g, with capacity retention rates of 69.9%, 99.0%, and 91.0%. Compared with other previously reported micron silicon anodes [39-43], the e-Si-50 exhibits good properties in all electrochemical performance indices (Fig. 4d and Table S2 in Supporting information).
To further study the lithium ion diffusion dynamics in the e-Si-50 electrode, the GITT analysis was used to quantitatively calculate the lithium ion diffusion coefficient
|
|
(1) |
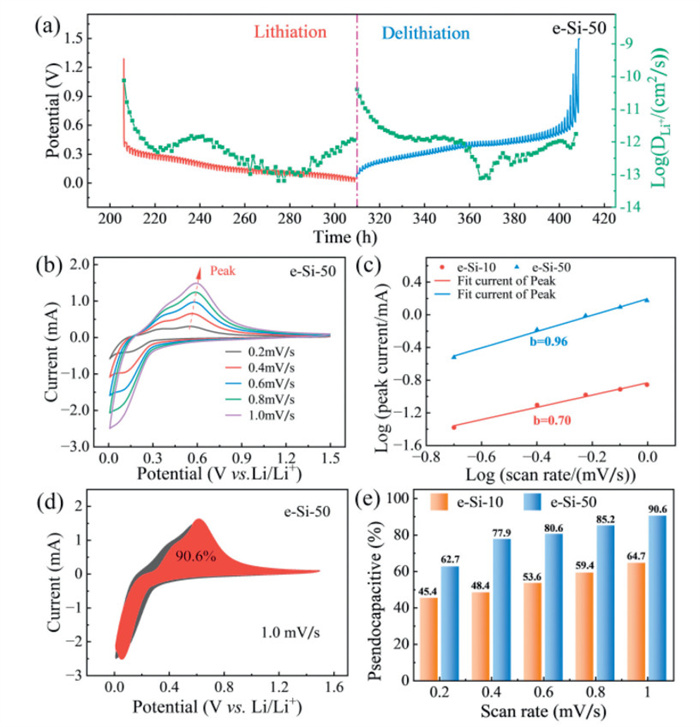
where mAM is the mass of the active material, MAM is the molar mass, VM is the molar volume, A is the electrode area, τ is the constant current pulse duration, ΔEs is the change in steady-state voltage per GITT step, ΔEτ is the total cell voltage change during constant current (after iR-drop correction). These parameters are derived from the data in Fig. S8b (Supporting information). The
Scan rate-dependent cyclic voltammetry (CV) tests were performed at 0.2–1.0 mV/s to analyze the charge storage mechanism and capacitive contributions of the e-Si-50 electrode in lithium storage (Fig. 5b). The electrochemical kinetics were quantified using Eq. 2 [41]:
|
|
(2) |
where a is a constant and b is the slope of the linear line b value of 0.5 indicates diffusion control and 1 indicates capacitive control. From the slope of the linear curve (Fig. 5c), the b values for the anodic peaks of the e-Si-50 electrode are calculated to be 0.96, indicating the coexistence of both diffusion and capacitive contributions [44]. In addition, it has also been demonstrated in Fig. S7 (Supporting information) that e-Si-50 conforms to the charging and discharging characteristics of silicon. Overall, the introduction of an abundant nanoporous structure improves the diffusion kinetics of Li+ and the high-rate capability.
In a further step, the capacitive and diffusion contributions were further quantified using Eq. 3 [45]:
|
|
(3) |
where k1 and k2 are constants, k1v represents the capacitive contribution, and k2v1/2 corresponds to the diffusion-controlled process. Through integration of the CV curves, the capacitive contribution dominates 90.6% of the total Li+ storage capacity for the e-Si-50 electrode at 1.0 mV/s (Fig. 5d). Fig. 5e further demonstrates that the pseudocapacitive contribution increases with scan rate (0.2–1.0 mV/s), with the e-Si-50 electrode exhibiting the highest pseudocapacitive ratio, consistent with its superior capacity retention in Fig. 4a. Comparative CV profiles of m-Si and e-Si-10 electrodes are provided in Figs. S8c and d (Supporting information).
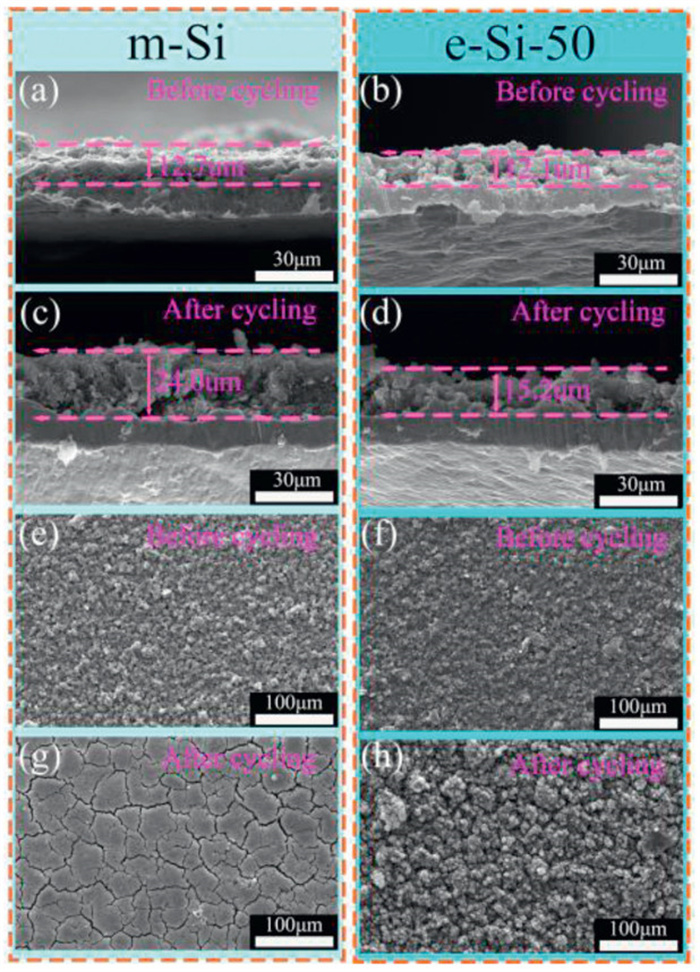
Fig. 6 illustrates the cross-sectional and surface morphological evolution of the electrodes before and after 800 cycles of discharge. The thickness of the m-Si electrode increases from 12.7 mm (Fig. 6a) to 24.0 mm (Fig. 6c), resulting in a volume expansion of 89.0%. Severe cracking and delamination of active material from the Cu current collector are observed (Fig. 6c). Additionally, the surface morphology transitions from a dense structure (Fig. 6e) to a cracked network (Fig. 6g). This is because m-Si has limited self-buffering capacity during the charge-discharge process and the severe volume change leads to the destruction of the electrode structure and agglomeration (Fig. S9 in Supporting information) [46]. In contrast, the e-Si-50 electrode exhibits minimal thickness variation, increasing from 12.1 mm (Fig. 6b) to 15.2 mm (Fig. 6d), corresponding to a volume change of only 25.6% (<0.3 of the m-Si electrode). Notably, the e-Si-50 electrode (Figs. 6f and h) maintains structural integrity without visible cracks post-cycling, demonstrating exceptional mechanical stability. These results confirm that the electrochemical chlorination etching process effectively enhances the electrochemical performance of m-Si.
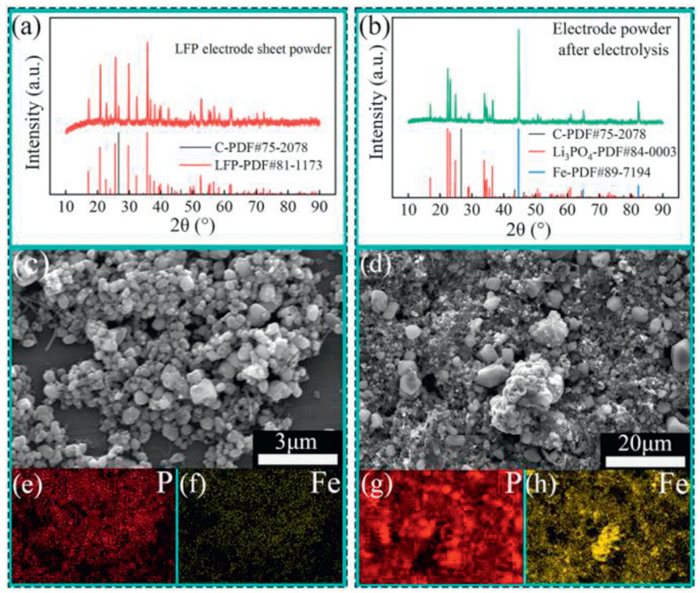
The XRD patterns of raw LFP and after electrolysis are shown in Figs. 7a and b, respectively. Raw LFP phases are composed of LiFePO4 (JCPDS No. 81–1173) and C (JCPDS No. 75–2078). The electrolysis product has Li3PO4 (JCPDS No. 84-0003), Fe (JCPDS No. 87–7194), and C (JCPDS No. 75–2078), demonstrating that the LFP has been successfully electro-decomposited into Li3PO4 and Fe. Calculations show that P loses about 6.3% before and after electrolysis. The SEM of raw LFP and electrolysis product (Figs. 7c and d) show that the raw LFP with regular and small shaped particles convert into the morphologies with the integrated shape particles, refined particles and a few of big irregular agglomerates. Their EDSs map (Figs. 7e–h) show that the even distribution of P and Fe elements in LFP become significantly completely segregated. Grinding and magnetic separation results indicated that the mixture of Li3PO4 and Fe could be easily separated (Fig. S10 in Supporting information).
We developed a novel electrode pair by combining the m-Si anode, and the LFP cathode from spent LIBs. The m-Si was successfully etched without chlorine gas using an electrode pair in molten KCl-LiCl at a cell voltage of 3.0 V, resulting in a reduction of particle size from 10 µm to <5 µm and the formation of a porous structure. The prepared e-Si-50 with an etched amount exhibits a particle size below 5 µm and a BET specific surface area of 20.323 m2/g. It was porous with the mesopore range of mainly distributed in the 3-30 nm interval. It also exhibits superior specific capacity of 1061.2 mAh/g at 2.0 A/g, after 800 cycles as the anode of LIBs. In addition, the Li3PO4, Fe, and C were derived by the electrochemical reduction of LFP, and were easily separated by magnetic separation in water without acid or base. The new process not only realizes the transition from the m-Si to the high performance Si anode material without the harmful chemical solvents, but also performs the recycling of spent lithium-ion batteries, which has a very promising future.
The authors declare that they have no known competing financial interests or personal relationships that could have appeared to influence the work reported in this paper.
Yagang Yang: Writing – review & editing, Writing – original draft, Visualization, Validation, Methodology, Investigation, Formal analysis, Data curation. Hanqing Dong: Writing – review & editing, Supervision, Formal analysis. Kai Yu: Supervision, Resources. Qiushi Song: Supervision, Resources. Zhiqiang Ning: Supervision, Resources. Hongwei Xie: Writing – review & editing, Supervision, Resources, Methodology, Funding acquisition, Conceptualization.
This work was supported by the Natural Science Foundation of Liaoning Province (No. 2021-MS-106) for financial support.
Supplementary material associated with this article can be found, in the online version, at doi:
IEA,
Discov. Mag.,
L. Huang, J. Wang, Y. Hu, C. Chen, L. Cao, Q. Jiang, RSC Adv. 14 (2024) 34823–34832. doi: 10.1039/d4ra06203e
G. Qian, L. Zhou, S. Li, Z. Wang, L. Sun, ACS Sustain. Chem. Eng. 9 (2021) 11179–11193. doi: 10.1021/acssuschemeng.1c03381
M.P. Kuz'min, P.K. Chu, A.M. Qasim, et al., J. Alloys Compd. 806 (2019) 806–813. doi: 10.1016/j.jallcom.2019.07.312
X. Jin, J. Kong, X. Zhou, P. Xing, Y. Zhuang, J. Clean. Prod. 247 (2020) 119163. doi: 10.1016/j.jclepro.2019.119163
Q. Ma, Z. Zhao, Y. Zhao, et al., Energy Storage Mater. 34 (2021) 768–777. doi: 10.1111/os.12952
J. Lu, S. Liu, J. Liu, et al., Adv. Energy Mater. 11 (2021) 2102103. doi: 10.1002/aenm.202102103
Y. Li, G. Chen, W. Liu, et al., Waste Manag. 156 (2023) 22–32. doi: 10.1016/j.wasman.2022.11.022
M. Je, D.Y. Han, J. Ryu, S. Park, Acc. Chem. Res. 56 (2023) 2213–2224. doi: 10.1021/acs.accounts.3c00308
Y. Yang, R. Dong, H. Cheng, et al., Small 19 (2023) 2301574. doi: 10.1002/smll.202301574
G.W.F. Drake, Springer Handbook of Atomic, Molecular, and Optical Physics, Springer International Publishing, Cham, 2023.
M. Jareer, B. K, S. Safa, S. Shahgaldi, J. Alloys Compd. 1010 (2025) 177124. doi: 10.1016/j.jallcom.2024.177124
M.A.M. Hossain, M.A. Hannan, P.J. Ker, et al., J. Energy Storage 99 (2024) 113371. doi: 10.1016/j.est.2024.113371
H. Wu, Y. Cui, Nano Today 7 (2012) 414–429. doi: 10.1016/j.nantod.2012.08.004
J. Li, A.K. Dozier, Y. Li, F. Yang, Y.T. Cheng, J. Electrochem. Soc. 158 (2011) A689. doi: 10.1149/1.3574027
Q. Ma, Y. Zhao, Y. Guo, et al., J. Mater. Chem. A 10 (2022) 10004–10013. doi: 10.1039/d2ta01342h
H. Yang, M. Bao, S. Shen, et al., Sens. Actuator. Phys. 79 (2000) 136–140. doi: 10.1016/S0924-4247(99)00270-8
T. Kasukabe, H. Nishihara, K. Kimura, et al., Sci. Rep. 7 (2017) 42734. doi: 10.1038/srep42734
W. Choi, J. Bae, H. Kim, C. Son, M. Karuppaiah, J.K. Lee, Electrochim. Acta 498 (2024) 144687. doi: 10.1016/j.electacta.2024.144687
K. Tang, A. Rasouli, J. Safarian, X. Ma, G. Tranell, Materials 16 (2023) 4098. doi: 10.3390/ma16114098
R. Xu, Y. Shi, W. Wang, Y. Xu, Z. Wang, Int. J. Green Energy 19 (2022) 1658–1664. doi: 10.1080/15435075.2021.2023545
M. Zhu, X. Zhao, R. Yan, J. Zhang, Curr. Opin. Solid State Mater. Sci. 27 (2023) 101079. doi: 10.1016/j.cossms.2023.101079
J. Xie, L. Sun, Y. Liu, X. Xi, R. Chen, Z. Jin, Nano Res. 15 (2022) 395–400. doi: 10.1007/s12274-021-3491-z
M. Sohn, D.S. Kim, H.I. Park, J.H. Kim, H. Kim, Electrochim. Acta 196 (2016) 197–205. doi: 10.1016/j.electacta.2016.02.101
A. Mateen, A.J. Khan, Z. Zhou, et al., ChemSusChem 18 (2024) e202400777.
J.R. Vella, D. Humbird, D.B. Graves, J. Vac. Sci. Technol. B 40 (2022) 023205.
T. Ito, K. Karahashi, S.Y. Kang, S. Hamaguchi, J. Vac. Sci. Technol. A 31 (2013) 031301. doi: 10.1116/1.4793426
Y. Ding, J. Fu, S. Zhang, et al., Sep. Purif. Technol. 338 (2024) 126551. doi: 10.1016/j.seppur.2024.126551
M. Schvaneveldt, T. Williams, R. Fuller, D. Rappleye, Nucl. Technol. 210 (2024) 1464–1474. doi: 10.1080/00295450.2023.2299908
S.C. Lee, J.M. Hur, C.S. Seo, J. Ind. Eng. Chem. 14 (2008) 651–654. doi: 10.3341/jkos.2008.49.4.651
E.A. Ogryzlo, D.L. Flamm, D.E. Ibbotson, J.A. Mucha, J. Appl. Phys. 64 (1988) 6510–6514. doi: 10.1063/1.342070
J.R. Vella, D.B. Graves, J. Vac. Sci. Technol. A 40 (2022) 063203.
E.J.C. Tinacba, M. Isobe, S. Hamaguchi, J. Vac. Sci. Technol. A 39 (2021) 042603. doi: 10.1116/6.0001117
H. Dong, H. Xie, Y. Xu, et al., J. Alloys Compd. 911 (2022) 164965. doi: 10.1016/j.jallcom.2022.164965
Y. Tian, Y. Li, P. Xiao, P. Zhou, Z. Fang, Y. Li, J. Alloys Compd. 966 (2023) 171564. doi: 10.1016/j.jallcom.2023.171564
J. Li, Y. Lin, F. Wang, et al., Sep. Purif. Technol. 254 (2021) 117581. doi: 10.1016/j.seppur.2020.117581
K. Tomono, S. Miyamoto, T. Ogawa, et al., Sep. Purif. Technol. 120 (2013) 304–309. doi: 10.1016/j.seppur.2013.10.014
C. Zhang, Q. Ma, M. Cai, Waste Manag. 135 (2021) 182–189. doi: 10.13110/marvelstales.35.1.0182
Y. An, H. Fei, G. Zeng, et al., ACS Nano 12 (2018) 4993–5002. doi: 10.1021/acsnano.8b02219
H. Dong, H. Xie, Q. Song, Z. Ning, J. Energy Storage 90 (2024) 111960. doi: 10.1016/j.est.2024.111960
W. Cao, K. Han, M. Chen, H. Ye, S. Sang, Electrochim. Acta 320 (2019) 134613. doi: 10.1016/j.electacta.2019.134613
J. Zeng, N. Fu, X. Wang, A. Zhou, Z. Yang, Appl. Surf. Sci. 557 (2021) 149860. doi: 10.1016/j.apsusc.2021.149860
Y. Li, G. Chen, H. Yang, et al., ACS Appl. Mater. Interfaces 15 (2023) 43887–43898. doi: 10.1021/acsami.3c09561
J. Zhang, S. Li, F. Xi, et al., Chem. Eng. J. 447 (2022) 137563. doi: 10.1016/j.cej.2022.137563
F. Wu, Y. Dong, Y. Su, et al., Small 19 (2023) 2301301. doi: 10.1002/smll.202301301

Figure 1 (a) Process diagram of molten salt electrolytic chlorination. (b) Diagram of m-Si Etching. (c) Abaqus finite element stress analysis of the lithium insertion process in Si powder cross-section.

Figure 2 (a) CV of graphite cavity electrode and graphite cavity electrode with added m-Si powder. (b) LSV of graphite cavity electrode and graphite cavity electrode with added m-Si powder.

Figure 3 SEM images of (a, b) m-Si, (c, d) e-Si-10, and (e, f) e-Si-50 at different magnifications. m-Si, e-Si-10 and e-Si-50 show the N2 adsorption desorption isotherms and pore size distributions. (g) Isotherms, (h) BJH, (i) DFT.

Figure 4 Lithium storage properties: (a) Rate performances at various current densities and (b) cycling performances of m-Si, e-Si-10, e-Si-50 at 2 A/g. (c) Cycling performance of the np-Si-5 electrode at 0.5, 1.0 and 2.0 A/g. (d) Electrochemical performances comparison.

Figure 5
(a) GITT-derived

Figure 6 Cross-sectional SEM images of (a, c) m-Si and (b, d) e-Si-50 electrodes before and after 800 cycles at 2.0 A/g. Surface morphology of (e, g) m-Si and (f, h) e-Si-50 electrodes under the same cycling conditions.

 扫一扫看文章

扫一扫关注我们
 DownLoad:
 下载:
下载:

 下载:
下载: