
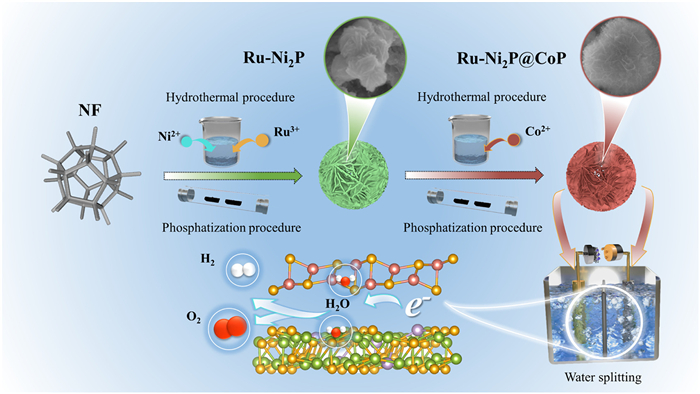
Figure 1.
The synthetic schematic of Ru-Ni2P@CoP samples.


With the flourishing development of industrial society, one burns fossil fuels at an alarming rate and release large amounts of CO2 gas into atmosphere [1–4]. It leads to an intensive greenhouse effect of Earth. Therefore, it is urgent to explore low-carbon and abundant energy to meet the growing needs. Thereinto, hydrogen energy has become an important energy source due to its zero carbon emission [5–8]. Electrolytic water is a promising approach to produce hydrogen on a large scale [9–12]. At present, it is mainly focused on the electrolysis of fresh water. However, this technology is not sustainable because fresh water resources only account for 2.5% of the total global ones. As result, ones pay increasing attention to the abundant seawater resources [13–16]. As known, seawater possesses complex composition and usually needs to be desalinated before electrolysis [17–19]. This undoubtedly raises the cost of generation of hydrogen energy. Therefore, it is necessary to develop directly catalyzed seawater electrolysis.
Currently, common catalysts are noble metal-based products (e.g., Pt, IrO2 and RuO2) [20–22]. Yet their high price and scarcity are not sustainable enough to produce large quantities of hydrogen. Among them, Ru element is cheaper and closer than Pt-based catalysts in terms of hydrogen evolution energy than other noble metals [23–25]. Therefore, it is appropriate to choose Ru element as a catalyst dopant. Moreover, transition metal compounds are also suitable catalyst candidates due to their abundant valence states and unfilled d orbitals [26–29]. For example, transition metal phosphates (TMPs) contain P atoms and metal atoms that act as protons and hydrogen acceptors, respectively [30–32]. Thus, they play a significant role in HER. For OER, TMPs are converted in situ into M-O or M-OOH substances to work as new active centers [33–35]. In literature, numerous reports have shown that heteroatom doping significantly regulates their electronic structure and improves their adsorption ability to reaction intermediates [36–38]. Duan et al. obtained CoFePO product by co-doping Co2P with Fe, O elements. The synergistic effect between cations and anions allows the sample to drive HER and OER up to 10 mA/cm2 with 87.5 and 274.5 mV, respectively [39]. Wen's group synthesized V-Ni2P amorphous nanostructures with a HER overpotential of 85 mV at 10 mA/cm2. The V and Ni atoms interact with each other thereby creating lattice distortions and exposing many active sites for electrochemical reactions [40].
Herein, we prepare 0.1Ru-Ni2P@CoP structure by a hydrothermal and low-temperature solid-phase phosphating approach. The product combines the outstanding catalytic efficiency of Ru element and the self-restructuring characteristics of TMPs. It requires 82.7 mV (HER) and 245.3 mV (OER) to reach 10 mA/cm2 in 1 mol/L KOH solution. And it is also available in catalyzing reactions under alkaline seawater conditions. A total water dissolution device is assembled using the obtained samples as positive and negative electrodes. The device works stably in both electrolytes (30 mV/cm2: ƞ1 mol/L KOH = 1.31 V, ƞ1 mol/L KOH+seawater = 1.27 V). DFT calculations reveal that the ultra-low Ru element doping modulates the surface electronic structure and the D-band centers to gain suitable adsorption energies for reaction intermediates. It demonstrates the superior electrical conductivity of 0.1Ru-Ni2P@CoP structures.
Fig. 1 illustrates the synthesis route of the catalyst. The Ru-doped Ni2P precursor is first obtained by a facile hydrothermal procedure. XRD patterns are conducted to confirm the influence of different Ru doping contents on the precursor. Fig. 2a demonstrates the diffraction peaks locate at 40.71°, 47.36°, 54.19° and 74.79°, respectively, which match well with Ni2P phase (PDF #89–4864). The addition of Ru element does not cause new characteristic peaks, which is sufficient to prove that Ru element exists in the samples as dopant. Among them, 0.1Ru-Ni2P precursor presents the highest crystallinity. After that, a layer of CoP substance is deposited on its surface to obtain 0.1Ru-Ni2P@CoP heterostructure. Its XRD pattern (Fig. 2b) still contains the diffraction peaks of Ni2P phase. Besides, the characteristic peaks at 31.59°, 36.32°, 48.18°, 56.79°, and 66.93° correspond to (011), (111), (211), (013), and (004) crystal faces of CoP phase (PDF #89–4862), respectively. The nitrogen adsorption and desorption curves (Fig. 2c) reveal that 0.1Ru-Ni2P@CoP catalyst is mainly composed of micropores and mesoporous pores with pore sizes ranging from 0 to 10 nm. The 0.1Ru-Ni2P@CoP samples show large BET surface area (53.21 m2/g) and compared with other samples (Fig. S1 in Supporting information).
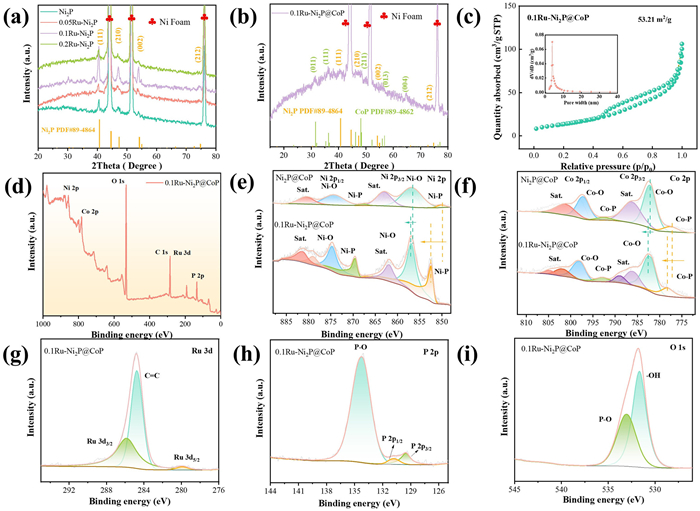
The X-ray photoelectron spectroscopy (XPS) (Fig. 2d) shows that the 0.1Ru-Ni2P@CoP sample consists of Ni, Co, Ru, P, O and C elements. Table S1 (Supporting information) contains the percentage of these elements. The content of Ru element is 0.49%, which is only 1/10 of Ni element. Furthermore, inductively coupled plasma (ICP) also shows that the weight ratio of Ru element in 0.1Ru-Ni2P@CoP is only 1.67 wt% (Table S2 in Supporting information). The ultra-low Ru content is a favorable proof of its cost advantage. From Fig. 2e, the Ni 2p peaks are convolved into two pairs of double peaks and satellite peaks. The Ni-P bond corresponds to the peaks with binding energies of 852.28 and 869.58 eV. While the peaks at 856.98 and 874.78 eV are attributed to Ni2+ [41]. For Co 2p spectra (Fig. 2f), the peak at 778.28 eV is caused by the Co-P bond in CoP sample. The remaining peaks belong to Co-O (782.68, 798.38 eV) bonds and satellite peaks (786.78, 802.68, 804.88 eV), respectively [42]. Obviously, the peaks of Ni 2p and Co 2p show a positive shift after the addition of Ru element. This is due to the high electronegativity of Ru atom. It attracts many electrons in the compound, which results in a decrease in electron density around the Ni, Co atoms. The stripping of the outer electrons causes the electronic structure to change, and the energy level is tailored to reach the lowest energy. The process allows for smooth adsorption and desorption of reaction intermediates on the surface of the 0.1Ru-Ni2P@CoP sample. The Ru 3d spectrum coincides with the C 1s spectrum. Therefore, in addition to the C=C bond (284.78 eV), Fig. 2g also includes Ru 3d5/2 (279.88 eV) and Ru 3d3/2 (285.88 eV) peaks. These peaks confirm that Ru element exists as zero-valent metallic Ru atoms [43]. Its single-atomic form enables its utilization in electrochemical reactions to reach 100%. In the P 2p spectra (Fig. 2h), the peaks at 129.58 and 130.88 eV originate from phosphorus ions in phosphide. In addition, the strong peak at 134.28 eV is mainly due to the P-O bond formed by the oxidation of the sample in atmosphere [44]. It correlates with the peak consisting of P-O bonds (533.08 eV) in the O 1s spectrum (Fig. 2i). The O 1s spectrum indicates an additional peak at 531.58 eV, which comes from the hydroxyl group [45].
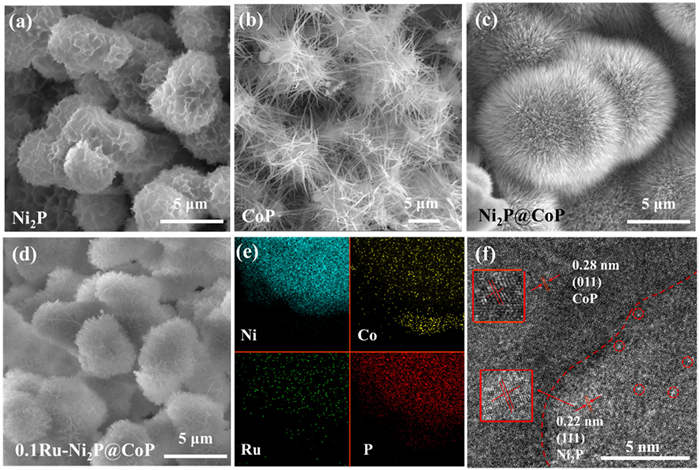
We then observe the morphology and structure of the samples by scanning electron microscope (SEM). Ni2P nanospheres (Fig. 3a) and CoP nanowires (Fig. 3b) are combined to form the Ni2P@CoP product, which is shown in Fig. 3c. Figs. S2a-c (Supporting information) are the morphologies of Ni2P samples doped with different contents of Ru elements. The morphology of 0.1Ru-Ni2P precursor is more complete than that of the other two samples. After compositing the CoP structure, its shape transforms into nanospheres composed of nanosheets (Fig. 3d). The nanosheets possess a thin average thickness of only 57.53 nm. This structure provides abundant active sites and spacious electron/ion transfer channels for electrochemical reactions. After that, the corresponding TEM image (Fig. S3a in Supporting information) reveals that the basic constituent unit of the 0.1Ru-Ni2P@CoP nanosheets. HRTEM further prove the presence of heterogeneous interface in the nanosheet (Fig. S3b in Supporting information). The element mapping images (Fig. 3e) shows that Ni, Co, P, Ru elements are uniformly distributed on the sample surface. HRTEM image (Fig. 3f) indicates that the interface of the sample with two phases, CoP (d = 0.28 (011)) and Ni2P (d = 0.22 (111)). Moreover, many scattered bright spots are observed in the Ni2P region. It can be inferred that these bright spots are likely to be Ru atoms based on the rule that the optical intensity of atoms is positively correlated with the atomic number [46]. It confirms that the ruthenium element is doped in the sample as single atoms.
The electrocatalytic activity of the samples is then investigated in a three-electrode system with 1 mol/L KOH solution as electrolyte. The HER performances are first evaluated according to the linear scanning voltammetry (LSV) curves. Fig. 4a shows that 0.1Ru-Ni2P@CoP catalyst possesses significantly lower overpotential than other samples. The heterogeneous structure provides abundant active sites, so that it only needs 82.7 mV overpotential to achieve 10 mA/cm2. And, the high utilization rate of Ru atoms reduces the interference of the high current density to the catalyst. It maintains normal operation at the current density up to 1.6 A/cm2. This indicates that it meets the harsh working conditions of industrial water electrolysis. Table S3 (Supporting information) compares its overpotential with other recently reports, which further demonstrates its superior HER activity. In addition, Tafel slope is also an important index to assess catalyst reaction kinetics. Fig. 4b demonstrates that the lowest Tafel slope (117.4 mV/dec) of 0.1Ru-Ni2P@CoP product presents among all the electrodes. Electrochemical surface area (ECSA) can further understand the source of this rapid reaction kinetics. We calculate the double layer capacitance (Cdl) proportional to the ECSA based on the CV curves obtained in the non-Faraday region. Fig. 4c shows that the combination of doping and heterostructure engineering increases the Cdl value of catalyst from 9.11 mF/cm2 (Ni2P) to 18.86 mF/cm2 (0.1Ru-Ni2P@CoP).
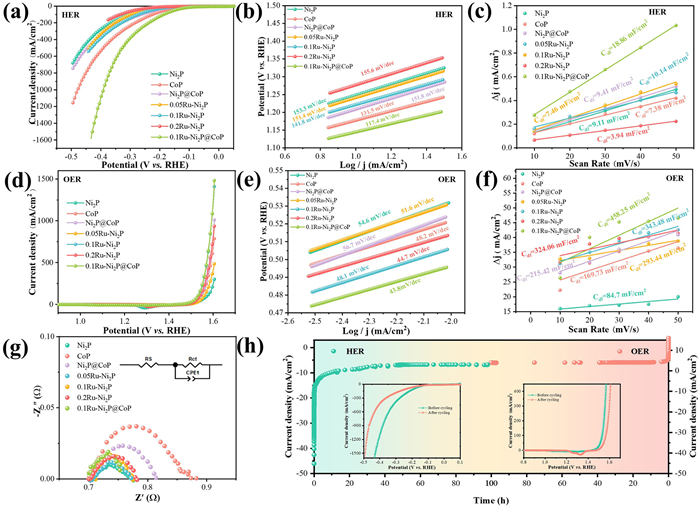
The OER performance of the prepared catalysts is subsequently explored under the same electrolyte conditions. Based on the LSV curves of OER (Fig. 4d), it can be calculated that the overpotential of 0.1Ru-Ni2P@CoP (245.3 mV) catalyst at 10 mA/cm2 is lower than those of the other samples: Ni2P (277.3 mV), CoP (267.3 mV), Ni2P@CoP (268.3 mV), 0.05Ru-Ni2P (275.3 mV), 0.1Ru-Ni2P (253.3 mV) and 0.2Ru-Ni2P (263.3 mV). The comparison with other reported catalysts (Table S4 in Supporting information) also proves its outstanding OER performance. Additionally, the low Tafel slope (43.8 mV/dec) (Fig. 4e) also shows its kinetic advantage during OER. Ru doping leads to a significant increase in ECAS of the samples (Fig. 4f). Then, the ECAS is further enhanced by the CoP substance composited on the electrode surface. Finally, the Cdl of the 0.1Ru-Ni2P@CoP catalyst (458.25 mF/cm2) reaches 5.4 times that of the Ni2P precursor (84.70 mF/cm2). Fig. S4a (Supporting information) lists HER and OER overpotential of the prepared catalysts. It directly highlights the superiority of the 0.1Ru-Ni2P@CoP sample as a catalyst for water electrolysis. From EIS (Fig. 4g), it offers a smaller charge transfer resistance than any other catalyst. This allows it to offer a fast charge transfer rate during electrochemical reactions to achieve superior catalytic performance. Cyclic stability is also an essential criterion to evaluate whether a catalyst is valuable for application. Initially, multi-current chronopotentiometry is performed on 0.1Ru-Ni2P@CoP electrode under HER and OER conditions, respectively. The current density increases from 10 mA/cm2 to 200 mA/cm2 and then drops back to 10 mA/cm2. Figs. S4b and c (Supporting information) indicate that the cyclic curves are smooth and there is little increase in potentials after the cycling. Obviously, the catalyst is stable and expected to be used for electrolysis at high current density. Afterwards, it runs for up to 100 h at a constant voltage (Fig. 4h). And the LSV curve shapes for HER and OER hardly changed at the end of the cycling. Its morphology after cycling (Fig. S5 in Supporting information) remains as uniformly distributed nanosheets, which indicates its structural stability.
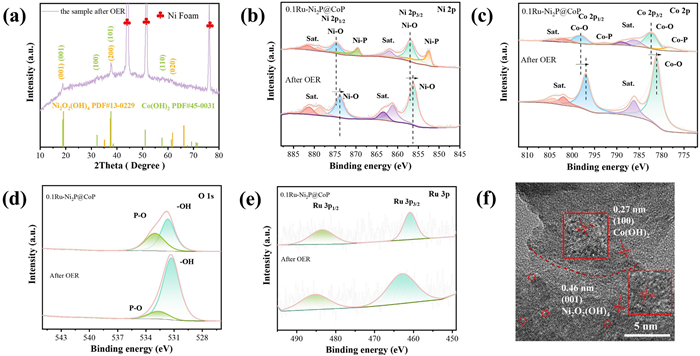
We continue to study the structure of 0.1Ru-Ni2P@CoP catalyst after OER by XRD to explore its reaction mechanism. Fig. 5a presents that the nickel-based and cobalt-based phosphide are transformed into Ni2O2(OH)4 and Co(OH)2, respectively. XPS data further verifies this finding. Figs. 5b and c compare the spectra of Ni, Co elements before and after the catalytic process. They both show the disappearance of peaks corresponding to Ni-P and Co-P. The peak area ratio of P-O: OH also decrease greatly in the O 1s spectra (Fig. 5d). Fig. S6 (Supporting information) contains the characteristic peaks of P-O bonds and the P 2p3/2 peak. During OER, the surface of 0.1Ru-Ni2P@CoP catalyst undergoes preferential oxidation to oxyhydroxide species. However, the reaction is not complete in some local areas due to kinetic limitations, resulting in minimal P-M bond residue. From Fig. 5f, the HRTEM image proves that (001) and (100) crystal planes belong to Ni2O2(OH)4 and Co(OH)2 crystal phases, respectively. All these phenomena suggest the occurrence of the material self-reconfiguration during reaction. The newly generated Ni2O2(OH)4 and Co(OH)2 phases generate new reaction sites [47]. This behavior substantially enhances the utilization of the catalyst itself. Additionally, the Ni2O2(OH)4 region is still scattered with many bright spots attributed to Ru atoms. Ru element remains as atoms after electrochemical reaction. This is supported by the Ru 3p spectral peak in Fig. 5e which remains almost constant. Its stable existence form is also one of the key factors for the catalyst to work for long time.
DFT calculations are carried to gain insight into the intrinsic activity of 0.1Ru-Ni2P@CoP catalyst. Fig. 6a shows the theoretical models of Ni2P, Ru-Ni2P and Ru-Ni2P@CoP structures. They indicate that Ru atoms tend to displace Ni atoms in Ni2P crystal and bond with P atoms. We calculate the effects of heteroatoms and heterogeneous structures on the sample based on the three models. Firstly, their electrochemical performance is investigated by the projected state density (PDOS). Figs. 6b-d show that the electronic states distribution from the positions of Fermi energy levels (Ef), demonstrating its metallic characteristics.
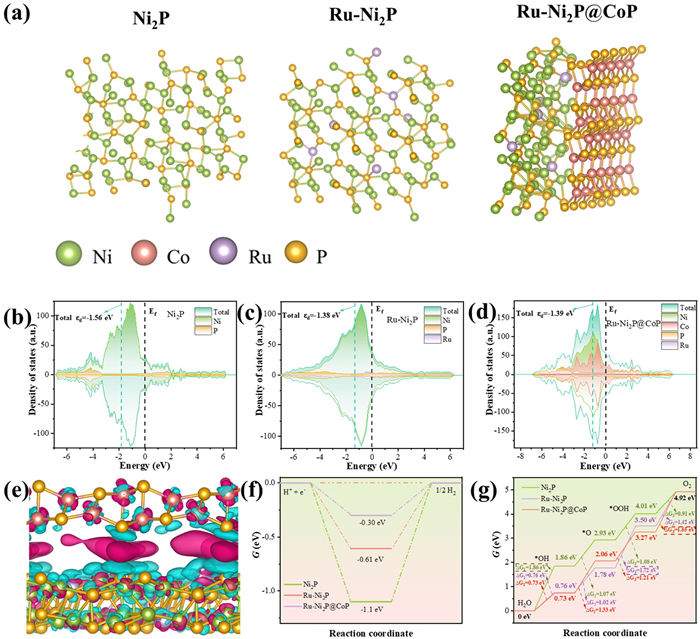
The d band center is closely related to the adsorption energy and activation energy barrier of the reaction intermediates in the catalytic process. The addition of Ru atom increases εd value from −1.56 eV to −1.38 eV. However, heterogeneous engineering does not significant effect on electronic structure. The εd value (−1.39 eV) of Ru-Ni2P@CoP structure is only 0.01 eV, which is lower than that of Ru-Ni2P catalyst. The closer the D-band center of the catalyst is to Ef, the stronger its ability to participate in trapping and bonding with intermediates. Therefore, Ru-Ni2P@CoP and Ru-Ni2P samples provide more favorable catalytic activity than Ni2P sample. Moreover, the heterostructure presents rich density of electronic states near Ef due to the contribution of Co element. This is the fundamental reason of its rapid reaction kinetics.
Fig. 6e indicates the charge transfer situation between the adsorbent and the catalyst surface. The pink and blue clouds represent areas of increased and decreased charge, respectively. It is found that a strong charge exchange process occurs at the heterojunction interface. In this system, the gain and loss processes of charge are mainly concentrated on Ni, Ru and Co atoms. Figs. S7a-c (Supporting information) illustrates partial magnifications of these atoms. The charge density of Ru atom is higher than those of Ni and Co atom. It is consistent with their electronegativity (Ru = 2.20, Ni = 1.91, Co = 1.88). The highly electronegative Ru atom provides new active centers for the catalyst by inducing charge transfer. The above findings prove that the Ru-Ni2P@CoP catalyst carries out a strong charge exchange with the reaction intermediates, revealing that they undergo sufficient adsorption and desorption.
In HER process (Fig. 6f), the free energy of hydrogen adsorption (ΔGH*) of Ni2P, Ru-Ni2P and Ru-Ni2P@CoP catalysts are −1.10, −0.61 and −0.30 eV, respectively. According to Sabatier's principle, it is known that the adsorption and desorption of H* intermediates on the electrode surface are competitive with each other. The ΔGH* of the ideal catalyst is close to 0 eV. Therefore, Ru-Ni2P@CoP catalyst offers the best HER catalytic efficiency among the three samples. For OER, the rates of these samples are determined by four reaction steps. Fig. 6g indicates that the speed determination steps of Ni2P, Ru-Ni2P and Ru-Ni2P@CoP samples are the first step (ΔG1 = 1.86 eV), the third step (ΔG3 = 1.72 eV) and the fourth step (ΔG4 = 1.65 eV), respectively. OER rate is limited by the energy barrier of the rate-determining step. Even if the other steps carry lower energy barriers, the reaction will not proceed faster than the rate-determining step. Therefore, Ru-Ni2P@CoP possesses a much rapid OER rate compared to the other two structures.
Also, we investigate the HER behavior of the catalysts in 1.0 mol/L KOH+seawater electrolyte. Fig. 7a shows the LSV curves of all the prepared catalysts. Fig. S8a (Supporting information) lists the overpotentials at 10 mA/cm2. It is found that the overpotential of 0.1Ru-Ni2P@CoP electrode (120.7 mV) is slightly higher than that of 0.1Ru-Ni2P product (102.7 mV) at low current density. This is largely due to the fact that efficient catalytic processes at high current densities requires the catalysts with sufficient intrinsic activity and the ability to rapidly separate surface bubbles [48]. The relatively low Tafel slope (95.44 mV/dec) and abundant ECSA (Cdl = 15.21 mF/cm2) confirm the fast reaction kinetics (Fig. 7b and c). Moreover, its plentiful pores offer a convenient channel for gas bubbles to escape from the electrode surface.
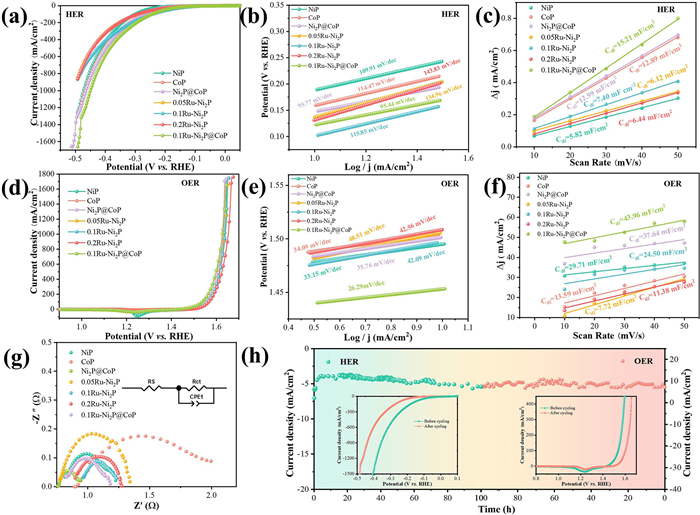
The OER performances of the catalysts are then studied under alkaline seawater conditions. Fig. 7d demonstrates that all the catalysts perform well at ampere-scale current densities. Fig. S8a visually compares the gap between their overpotentials. The overpotential of 0.1Ru-Ni2P@CoP electrode (229.3 mV) is lower than those of Ni2P (266.3 mV), CoP (276.3 mV), Ni2P@CoP (267.3 mV), 0.05Ru-Ni2P (276.3 mV), 0.1Ru-Ni2P (268.3 mV) and 0.2Ru-Ni2P (279.3 mV) catalysts at 10 mA/cm2. From Figs. 7e and f, it is in accordance with the superior Tafel slope (26.29 mV/dec) and Cdl value (43.96 mF/cm2) of this sample. EIS (Fig. 7g) also demonstrates the minimum charge transfer resistance, which accelerates its electrochemical reaction process. Finally, the 0.1Ru-Ni2P@CoP catalyst is estimated for cyclic stability in alkaline seawater electrolyte. Multi-current chrono-potential cycling results (Figs. S8b and c in Supporting information) demonstrate the stable operation at different current densities.
Fig. 7h presents the smooth cycling curves for 100 h. The insets show that the LSV curves of the catalyst keep stable in shapes. From the SEM image (Fig. S9a in Supporting information), the surface of the sample is covered with a thin film, which is caused by the precipitates in seawater. But its basic unit still behaves as nanosheets (Fig. S9b in Supporting information). XPS is again employed to study its chemical state after OER in seawater. Fig. S10 (Supporting information) illustrates that the phosphide peaks in both the Ni 2p and Co 2p spectra disappear. It is evident that this sample possesses self-reconstruction phenomenon in alkaline seawater electrolyte.
Finally, we further explore its application in total water splitting process. Firstly, ΔV (ΔV = ƞHER + ƞOER) is taken to assess the ability of the catalysts to drive the total water splitting device [49]. Figs. 8a and b compare the behavior of the catalysts in two electrolytes. The results indicate that the comprehensive performance of 0.1Ru-Ni2P@CoP is superior to the other products in different electrolytes. It is utilized as positive and negative electrode to assemble a total water electrolysis device (Fig. 8c). Figs. 8d and e present that the overpotentials of 0.1Ru-Ni2P@CoP sample in 1.0 mol/L KOH+seawater (ƞ30 = 1.27 V, ƞ50 = 1.34 V, ƞ100 = 1.50 V), which are slightly lower than those in 1.0 mol/L KOH electrolyte (ƞ30 = 1.31 V, ƞ50 = 1.38 V, ƞ100 = 1.53 V). However, it possesses a strong ability to withstand high current density in alkaline electrolyte compared to seawater electrolyte. Crucially, the water splitting voltage is lower than that of many reports under 1 mol/L KOH solution (Table S5 in Supporting information). The stability of the electrode is then evaluated by a long time constant pressure measurement. The cycle diagram (Fig. 8f) demonstrates that it holds up well under alkaline conditions, with little reduction after 200 h operation. However, the initial curve fluctuates greatly when it works in alkaline seawater electrolyte.
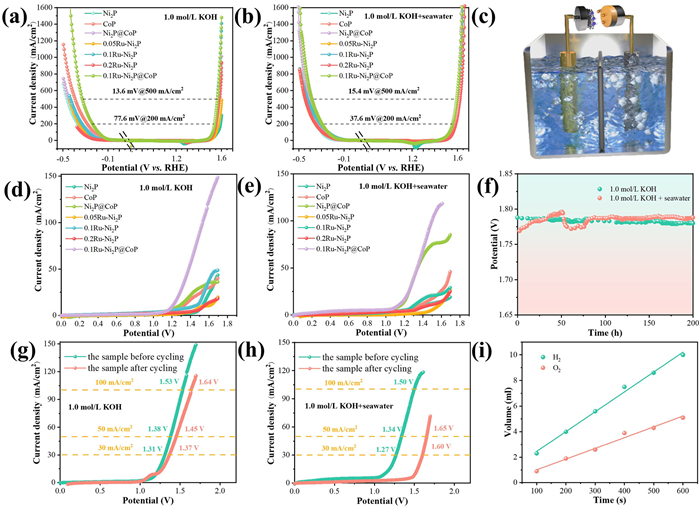
From Figs. 8g and h, the LSV curves of the samples in both electrolytes remains stable before and after cycling. In particular, the overpotential of 0.1Ru-Ni2P@CoP electrode slightly increase in KOH electrolyte. The produced H2 and O2 amounts during water electrolysis are obtained by the drainage technique. Fig. 8i records the volume of two kinds of gases produced at different time. The ratio of H2 to O2 is 1.96:1, which proves that 0.1Ru-Ni2P@CoP catalyst provides a Faraday efficiency of nearly 100%. It demonstrates that the outstanding electrochemical activity in both alkaline and seawater electrolytes.
In summary, we have prepared several kinds of Ru doped Ni2P@CoP electrocatalysts. The doping of Ru atoms causes the redistribution of charges thereby enhancing HER and OER activities in alkaline electrolyte. And the presence of heterogeneous interface significantly enhances the density of states near the Fermi energy level. They make the catalyst possess superior catalytic ability even under alkaline seawater conditions. As the electrodes for total water splitting devices, they only require low voltage to drive the device under alkaline seawater electrolyte. Furthermore, its surface self-reconfiguration during the electrochemical reaction avoids the corrosion of the electrodes. This study provides a feasible protocol to generate hydrogen by electrolysis of seawater.
The authors declare that they have no known competing financial interests or personal relationships that could have appeared to influence the work reported in this paper.
Xingyu Liu: Writing – original draft, Visualization, Validation, Software, Methodology, Investigation, Formal analysis, Data curation. Huan Pang: Validation, Supervision, Funding acquisition, Conceptualization. Xiang Wu: Writing – review & editing, Validation, Resources, Project administration, Funding acquisition, Data curation, Conceptualization.
The work is supported by National Natural Science Foundation of China (No. 52172218).
Supplementary material associated with this article can be found, in the online version, at doi:
Y. Zheng, Y. Jiao, A. Vasileff, et al., Angew. Chem. Int. Ed. 57 (2018) 7568–7579. doi: 10.1002/anie.201710556
W. Yang, S.W. Chen, Chem. Eng. J. 393 (2020) 124726. doi: 10.1016/j.cej.2020.124726
S. Anantharaj, S. Noda, V.R. Jothi, et al., Angew. Chem. Int. Ed. 60 (2021) 18981–19006. doi: 10.1002/anie.202015738
M.Y. Wu, X.L. Fan, W.B. Zhang, et al., Chin. Chem. Lett. 35 (2024) 109258. doi: 10.1016/j.cclet.2023.109258
J.X. Feng, H. Xu, Y.T. Dong, et al., Angew. Chem. Int. Ed. 56 (2017) 2960–2964. doi: 10.1002/anie.201611767
K.X. Zhang, X. Liang, L. Wang, et al., Nano Res. Energy 1 (2022) e91200322.
X.Y. Liu, W.C. Zhang, X. Wu, Energy Mater. Adv. 6 (2025) 0160. doi: 10.34133/energymatadv.0160
G.L. Gao, G.Z. Zhao, G. Zhu, et al., Chin. Chem. Lett. 36 (2025) 109557. doi: 10.1016/j.cclet.2024.109557
J. Chi, H.M. Yu, Chin. J. Catal. 39 (2018) 390–394. doi: 10.1016/S1872-2067(17)62949-8
F. Gao, J.Q. He, H.W. Wang, et al., Nano Res. Energy 1 (2022) e9120029. doi: 10.26599/NRE.2022.9120029
D.P. Zhao, X.Y. Liu, W.C. Zhang, et al., Small Methods 8 (2023) 2301474.
X.P. Li, L.R. Zheng, S.J. Liu, et al., Chin. Chem. Lett. 33 (2022) 4761–4765. doi: 10.1016/j.cclet.2021.12.095
L.C. Zhang, J. Liang, L.C. Yue, et al., Nano Res. Energy 1 (2022) e9120028. doi: 10.26599/NRE.2022.9120028
Q. Liu, S.J. Sun, L.C. Zhang, et al., Nano Res. 15 (2022) 8922–8927. doi: 10.1007/s12274-022-4869-2
S.H. Wang, P. Yang, X.F. Sun, et al., Appl. Catal. B: Environ. 297 (2021) 120386. doi: 10.1016/j.apcatb.2021.120386
L. Yu, L.B. Wu, S.W. Song, et al., ACS Energy Lett. 5 (2020) 2681–2689. doi: 10.1021/acsenergylett.0c01244
L.B. Wu, F.H. Zhang, S.W. Song, et al., Adv. Mater. 34 (2022) 2201774. doi: 10.1002/adma.202201774
T.R. Wei, G. Meng, Y.H. Zhou, et al., Chem. Commun. 59 (2023) 9992–9995. doi: 10.1039/D3CC02419A
S.K. Tang, D. Li, X. Wu, et al., Sci. China Mater. 68 (2025) 2749–2755. doi: 10.1007/s40843-025-3427-5
B. You, Y.J. Sun, Acc. Chem. Res. 51 (2018) 1571–1580. doi: 10.1021/acs.accounts.8b00002
H.M. Sun, Z.H. Yan, F.M. Liu, et al., Adv. Mater. 32 (2020) 1806326. doi: 10.1002/adma.201806326
H.J. Yin, S.L. Zhao, K. Zhao, et al., Nat. Commun. 6 (2015) 6430. doi: 10.1038/ncomms7430
J. Yu, Q.J. He, G.M. Yang, et al., ACS Catal. 9 (2019) 9973–10011. doi: 10.1021/acscatal.9b02457
Y. Jiao, Y. Zheng, M. Jaroniec, et al., Chem. Soc. Rev. 44 (2015) 2060–2086. doi: 10.1039/C4CS00470A
G. Zhang, Y.S. Feng, W.T. Lu, et al., ACS Catal. 8 (2018) 5431–5441. doi: 10.1021/acscatal.8b00413
H.Y. Jin, X. Liu, S.M. Chen, et al., ACS Energy Lett. 4 (2019) 805–810. doi: 10.1021/acsenergylett.9b00348
X.P. Li, C. Huang, W.K. Han, et al., Chin. Chem. Lett. 32 (2021) 2597–2616. doi: 10.1016/j.cclet.2021.01.047
X.Y. Liu, M.D. Wang, A. Umar, et al., Dalton Trans. 52 (2023) 10457–10464. doi: 10.1039/D3DT01732J
R.Y. Li, S.L. Xu, Z.Q. Ai, et al., Int. J. Hydrogen Energy 91 (2024) 867–876. doi: 10.1016/j.ijhydene.2024.10.104
D. Liu, G.Y. Xu, H. Yang, et al., Adv. Funct. Mater. 33 (2023) 202208358.
M.D. Wang, X.Y. Liu, X. Wu, Nano Energy 114 (2023) 108681. doi: 10.1016/j.nanoen.2023.108681
P. Liu, J.A. Rodriguez, J. Am. Chem. Soc. 127 (2005) 14871–14878. doi: 10.1021/ja0540019
D.K. Wang, X.Y. Huai, X. Wu, et al., J. Electroanal. Chem. 968 (2024) 118532. doi: 10.1016/j.jelechem.2024.118532
Y.H. Hou, Y.P. Liu, R.Q. Gao, et al., ACS Catal. 7 (2017) 7038–7042. doi: 10.1021/acscatal.7b02341
A. Dutta, S. Mutyala, A.K. Samantara, et al., ACS Energy Lett. 3 (2018) 141–148. doi: 10.1021/acsenergylett.7b01141
Z.X. Duan, D.P. Zhao, Y.C. Sun, et al., Nano Res. 15 (2022) 8865–8871. doi: 10.1007/s12274-022-4673-z
Z.H. Pu, T.T. Liu, I.S. Amiinu, et al., Adv. Funct. Mater. 30 (2020) 2004009. doi: 10.1002/adfm.202004009
T.A. Shifa, K. Yusupov, G. Solomon, et al., ACS Catal. 11 (2021) 4520–4529. doi: 10.1021/acscatal.1c00476
J.J. Duan, S. Chen, A. Vasileff, et al., ACS Nano 10 (2016) 8738–8745. doi: 10.1021/acsnano.6b04252
L.L. Wen, J. Yu, C.C. Xing, et al., Nanoscale 11 (2019) 4198–4203. doi: 10.1039/C8NR10167A
Y. Lin, K.A. Sun, S.J. Liu, et al., Adv. Energy Mater. 9 (2019) 1901213. doi: 10.1002/aenm.201901213
Q.L. Ma, H.H. Jin, F.J. Xia, et al., J. Mater. Chem. A 9 (2021) 26852–26860. doi: 10.1039/D1TA08699E
S. Yuan, Z.H. Pu, H. Zhou, et al., Nano Energy 59 (2019) 472–480. doi: 10.1016/j.nanoen.2019.02.062
L. Wang, Q. Zhou, Z.H. Pu, et al., Nano Energy 53 (2018) 270–276. doi: 10.1016/j.nanoen.2018.08.061
D. Chen, Z.H. Pu, R.H. Lu, et al., Adv. Energy Mater. 10 (2020) 2000814. doi: 10.1002/aenm.202000814
H.X. Xu, D.J. Cheng, D.P. Cao, et al., Nat. Catal. 1 (2018) 339–348. doi: 10.1038/s41929-018-0063-z
K. Fan, H.Y. Zou, Y. Lu, et al., ACS Nano 12 (2018) 12369–12379. doi: 10.1021/acsnano.8b06312
M.T. Jin, X. Zhang, S.Z. Niu, et al., ACS Nano 16 (2022) 11577–11597. doi: 10.1021/acsnano.2c02820
J.W. Zhu, Y. Guo, F. Liu, et al., Angew. Chem. Int. Ed. 60 (2021) 12328–12334. doi: 10.1002/anie.202101539

Figure 2 Structural characterization of the as-prepared samples: (a, b) XRD patterns. (c) N2 adsorption–desorption isotherms of the 0.1Ru-Ni2P@CoP sample. (d) XPS full spectrum of 0.1Ru-Ni2P@CoP sample. (e-i) XPS spectra of Ni 2p, Co 2p, Ru 3d, P 2p and O 1s.

Figure 3 Structural characterizations of the as-prepared samples: (a-d) SEM image of Ni2P, CoP, Ni2P@CoP and 0.1Ru-Ni2P@CoP sample. (e) Elemental mapping images of 0.1Ru-Ni2P@CoP sample. (f) HRTEM image of 0.1Ru-Ni2P@CoP sample.

Figure 4 Electrocatalytic performances of the electrocatalysts in 1 mol/L KOH: (a, d) LSV curves for HER and OER. (b, e) Tafel plots for HER and OER. (c, f) The electrochemical double-layer capacitance (Cdl) for HER and OER. (g) Nyquist curves. (h) Cycling performances.

Figure 5 Structural characterization of the 0.1Ru-Ni2P@CoP sample after OER: (a) XRD pattern. (b–e) XPS spectra of Ni 2p, Co 2p, O 1s and Ru 3p. (f) HRTEM image.

Figure 6 DFT calculation: (a) Structural models of samples. (b-d) Corresponds to the projected density states of samples. (e) Differential charge density of Ru-Ni2P@CoP catalyst. (f) Calculated free energy of H adsorption of different catalysts for HER. (g) Calculated free energy of different catalysts for OER.

Figure 7 Electrocatalytic performances of the electrocatalysts in alkaline seawater: (a, d) LSV curves for HER and OER. (b, e) Tafel plots for HER and OER. (c, f) The electrochemical double-layer capacitance (Cdl) for HER and OER. (g) Nyquist curves. (h) Cycling performances.

Figure 8 Overall water splitting performance: (a, b) OER and HER performance of catalysts. (c) Schematic diagram of overall water splitting device. (d, e) LSV curves of overall water splitting. (f) Cycling performance. (g, h) LSV curves after cycling. (i) The amount of H2 and O2 released at the same time.

 扫一扫看文章


扫一扫关注我们
 DownLoad:

 下载:
下载:
 下载:
下载: