Scheme 1.
Design strategy of fluorescent probes and their response mechanisms toward biothiols.
A fluorescent probe regulated by trifluoromethyl and nitrogen-containing heterocycles for monitoring biothiol fluctuations in the brains of mice with schizophrenia
Chengcheng Zhang , Zhe Wu , Ningning Jiang , Yi Song , Weina Geng , Hongmei Liu , Ming Jin , Shuxiang Wang , Jinchao Zhang , Yutao Yang

Schizophrenia (SCZ), characterized by hallucinations, delusions, cognitive impairment, and emotional apathy, is a chronic and severe psychiatric disorder with a lifetime prevalence of approximately 1%, significantly impairing social functioning and quality of life. Unfortunately, from a prognostic standpoint, many patients struggle to achieve full recovery. Even among those with a relatively favorable prognosis, SCZ can profoundly affect quality of life, leading to adverse outcomes such as impaired social functioning, and difficulties in forming intimate relationships, posing serious threats to both physical and mental health [1,2]. Due to its complex etiology and diverse pathogenesis, SCZ remains a major challenge in clinical diagnosis and treatment. Numerous studies have revealed that oxidative stress (OS) in the brain may play a pivotal role in the pathophysiological processes of SCZ, offering new insights into its underlying mechanisms [3–5]. OS is a pathological condition characterized by an imbalance bet ween the excessive production of reactive oxygen species (ROS) and the limited capacity of endogenous antioxidant defense systems to neutralize them. Consequently, monitoring changes in bioactive molecules associated with OS in the brains of individuals with SCZ may facilitate early diagnosis, even before the onset of overt symptoms [6,7]. Biothiols, as important antioxidant indicators, are closely associated with OS [8–12]. Studies have demonstrated that their concentrations fluctuate significantly in the brains with SCZ. Therefore, developing methods to monitor biothiols fluctuations may be of great significance for the early diagnosis of SCZ [13].
Due to the unique advantages such as excellent tissue penetration, minimal damage to biological tissues, high sensitivity, and the ability to enable non-invasive, real-time, and high-resolution imaging of bioactive molecules, near-infrared (NIR) fluorescent probes have emerged as powerful tools in biological and medical imaging applications [14,15]. Despite the development of various NIR fluorescent probes for biothiol detection in living cells and in vivo [16–28], there are still few probes specifically designed to monitor biothiol levels in the brain, especially focused on brain imaging of SCZ [29–31]. To gain deeper insights into the relationship between SCZ and biothiol fluctuations, there is an urgent need to develop a fluorescent probe capable of real-time monitoring of biothiol levels in the schizophrenic brain. However, due to the brain’s complex structure and the presence of the blood-brain barrier (BBB), an ideal fluorescent probe for this purpose must possess the ability to cross the BBB, along with high sensitivity, selectivity, and a rapid response to biothiols in the NIR region.
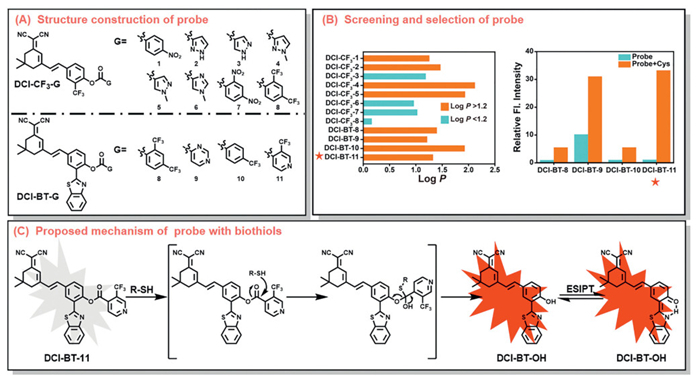
To the best of our knowledge, owing to their superior lipophilicity and biocompatibility, trifluoromethyl and nitrogen-containing heterocycles are extensively utilized in the formulation of drugs targeting neurological disorders [32–36]. A series of fluorescent probes were synthesized in parallel using carboxylic esters as recognition groups and dicyanoisophorone derivatives with excellent optical properties as fluorophores based on our previously reported reaction mechanism between biothiol and pyridine esters, in which biothiols nucleophilically attack the unsaturated carbonyl carbon of carboxylic esters, resulting in ester bond cleavage and fluorophore release [30,31]. By introducing trifluoromethyl and benzothiazole groups, the emission wavelength of the fluorophores was successfully extended into the NIR region. Additionally, substituting various aromatic or nitrogen-containing heterocycles with trifluoromethyl groups optimized the electron distribution around the carboxylic ester, thereby modulating the reactivity of the probes toward biothiols (Scheme 1A).
As mentioned above, a diverse library of 12 candidate probes was constructed (Scheme S1 and Figs. S11–S46 in Supporting information), and their physicochemical properties, optical performance, and structure–activity relationships were systematically evaluated. Among these, the probe DCI-BT-11 exhibited notable potential for biothiol imaging in the brain, primarily due to its favorable BBB permeability, as evidenced by a LogP value of 1.32 and a Pe value of 3.81 (Scheme 1B, Figs. S1 and S2 in Supporting information). Additionally, as shown in Scheme 1C, the intramolecular charge transfer (ICT) and excited-state intramolecular proton transfer (ESIPT) process of DCI-BT-11 was inhibited by introducing carboxylic esters, resulting in fluorescence quenching. However, upon the addition of biothiols, the protecting group of DCI-BT-11 is removed, and the hydroxyl group is released, triggering the ICT and ESIPT processes. Subsequently, NIR fluorescence is emitted at 710 nm, accompanied by a large Stokes shift (135 nm). High resolution mass spectrometry (HRMS) analysis further validated the sensing mechanism of DCI-BT-11 for biothiols. As shown in Fig. S3 (Supporting information), peaks at m/z 422.1328 ([M–H]-) and 595.1414 ([M–H]-) correspond to DCI-BT-OH and the probe DCI-BT-11, respectively. Furthermore, using DCI-BT-11, a decrease in biothiol concentrations was observed in the brains of mice with SCZ. More importantly, the therapeutic efficacy of N-acetylcysteine (NAC) and olanzapine (ONP) was evaluated by monitoring changes in biothiol levels in SCZ-model mice. These findings offer valuable insights for understanding of the pathogenesis of SCZ.
With the probe DCI-BT-11 in hand, we investigated its optical performance towards biothiols in phosphate buffered saline (PBS) buffer (10 mmol/L, pH 7.4, 40% DMSO, v/v). As shown in Fig. 1A, after the addition of biothiols (using cysteine as a model), an absorbance peak appeared at 575 nm, accompanied by fluorescence emission at 710 nm, exhibiting a large Stokes shift of 135 nm. This result indicates that the probe DCI-BT-11 is converted to DCI-BT-OH upon reaction with biothiols, which is highly desirable for the fluorescence imaging of biothiols in biological systems. Subsequently, the specificity of DCI-BT-11 was evaluated by monitoring its fluorescence response to various biological species under physiological conditions. Encouragingly, as shown in Fig. 1B, the DCI-BT-11 exhibited excellent selectivity, with no significant fluorescence changes observed upon the addition of various species (1–5: Ala, Asp, Arg, Asn, Gly; 6–10: Leu, Glu, Lys, Met, Gln; 11–15: Tyr, Phe, Ile, Val, Thr; 16–20: Ser, Pro, Na+, K+, Fe2+; 21–25: Cu2+, Ca2+, Fe3+, Mg2+, ClO−; 26–30: H2O2, NO3−, CO32−, SO42−, HSO3−; 31, 32: Na2S, SO32−). In contrast, the addition of biothiols (33–35: homocysteine (Hcy), glutathione (GSH), and cysteine (Cys)) resulted in a significant increase in fluorescence intensity at 710 nm.

Furthermore, the kinetic profiles of DCI-BT-11 with biothiols at 710 nm demonstrated a pronounced fluorescence increase, reaching equilibrium at approximately 150 s for Cys, 200 s for Hcy, and 300 s for GSH, respectively (Fig. 1C). Additionally, absorption and fluorescence titration experiments were conducted with biothiols (Figs. 1D and E, Fig. S4 in Supporting information). The free probe DCI-BT-11 exhibited a strong absorption peak at 385 nm, which gradually decreased upon the addition of Cys, Hcy, and GSH, accompanied by the emergence of a new peak at 575 nm. Correspondingly, a significant fluorescence enhancement at 710 nm was observed, with the intensity increasing as a function of biothiol concentration. The detection limits for Cys, Hcy, and GSH were determined to be 68, 85, and 98 nmol/L (Fig. 1F and Fig. S4), respectively. In addition, the influence of pH on the fluorescence response of DCI-BT-11 toward biothiols was assessed using Cys as a representative analyte (Fig. S5 in Supporting information). The probe DCI-BT-11 exhibited stable fluorescence in the absence of biothiols in pH range of 6–9, while the addition of Cys led to a strong fluorescence signal, indicating that DCI-BT-11 is suitable for monitoring biothiols under physiological conditions.
The excellent properties of DCI-BT-11 in chemical systems motivated us to investigate its practical application in living cells. Initially, the cell counting kit-8 (CCK-8) assay was employed to assess the cytotoxic effects of DCI-BT-11 on HT22 and PC12 cells. As shown in Fig. S6 (Supporting information), after 24 h of incubation with DCI-BT-11 (20 µmol/L), cell viability remained around 84%, suggesting low cytotoxicity and good suitability for intracellular biothiol imaging. Subsequently, DCI-BT-11 was employed to visualize endogenous biothiols in HT22 cells. As shown in Figs. S7 and S8 (Supporting information), the fluorescence intensity increased in a concentration-dependent manner. Additionally, a kinetic study conducted over 22 min demonstrated that the fluorescence intensity gradually increased and stabilized within 18 min, indicating that DCI-BT-11 enables rapid and effective detection of biothiols in HT22 cells.
Moreover, lipopolysaccharide (LPS) was employed to simulate OS in schizophrenic brain models, as LPS is known to induce OS in living cells. To determine the optimal concentration for establishing the OS model, HT22 cells were treated with 10 µL of LPS (0, 0.5, 1.0, 1.5, and 2.0 µg/mL) (Figs. 2A and B). The experimental results showed a significant decrease in fluorescence intensity in HT22 cells treated with LPS (2.0 µg/mL, 10 µL), establishing this concentration as the optimal condition for inducing OS.

Subsequently, the efficacy of various antioxidants NAC, GSH, alpha-lipoic acid (ALA), and vitamin C (Vc) was evaluated in the LPS-induced OS cell model by monitoring biothiol levels using DCI-BT-11. As shown in Figs. 2C and D, fluorescence recovery was observed in all four antioxidant treated groups, indicating that ALA, GSH, NAC, and Vc can alleviate intracellular OS and may have potential therapeutic effects in mitigating OS-related damage in SCZ.
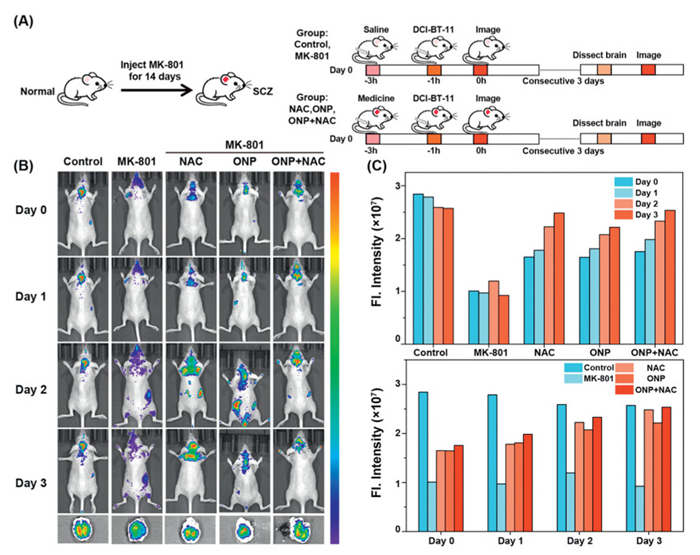
To investigate whether DCI-BT-11 can be used to monitor biothiol fluxes in vivo, a group of six-week-old BALB/c nude mice received intraperitoneal (i.p.) injections of DCI-BT-11, and images were captured at various time points (0, 0.5, 1, 2, 4, 12, and 24 h). All animal experiments were conducted in accordance with the protocols approved in the "Approval Statement on Animal Welfare and Ethics of Hebei University”. As shown in Fig. S9 (Supporting information), DCI-BT-11 effectively penetrated the BBB and enabled monitoring of biothiol levels. Based on the results, 1 h was selected as the optimal imaging time for DCI-BT-11 in the mouse brain. Furthermore, a SCZ mouse model was established by daily administration of dizocilpine (MK-801, 0.6 mg/kg, 100 µL) for 14 consecutive days. The success of the model was confirmed through autonomous activity and suspension tests (Fig. 3A) [14,15]. Importantly, SCZ mice were pretreated daily for three consecutive days with ONP (1 mg/kg, 100 µL), NAC (20 mg/kg, 100 µL), or a combination of ONP (1 mg/kg, 50 µL) and NAC (20 mg/kg, 50 µL). The results indicated a gradual increase in biothiol levels in the brains of treated mice compared to the model group, indicating that ONP and NAC have certain alleviating and therapeutic effects on SCZ (Figs. 3B and C). Moreover, fluorescence imaging analysis was also conducted on brain tissue sections from each group of mice (Fig. S10). Taken together, these findings suggest that monitoring the dynamic changes of endogenous biothiols offers a promising strategy for the diagnosis and evaluation of therapeutic effects in mice with SCZ.
In conclusion, we developed and constructed a diverse library of NIR fluorescent probes for biothiols, comprising 12 candidates. Among these, DCI-BT-11, based on the ICT-ESIPT mechanism, was identified as the most promising probe. Upon biothiol-triggered cleavage of the carboxylic ester group, the hydroxyl group of the fluorophore is released, activating both ICT and ESIPT processes and resulting in a bright NIR fluorescence emission at 710 nm with a large Stokes shift of 135 nm. At the cellular level, DCI-BT-11 successfully monitored changes in biothiol concentrations in HT22 cells under LPS-induced OS. Owing to its excellent BBB permeability, DCI-BT-11 enabled the visualization of biothiol fluctuations in the brains of SCZ mouse models for the first time. Furthermore, the effects of two antipsychotic drugs, ONP and NAC, on reduction-oxidation (REDOX) homeostasis in the brain were evaluated, providing important insights into the relationship between OS and SCZ. Overall, this study presents powerful tools and a theoretical basis for the early diagnosis and therapeutic intervention of central nervous system disorders.
The authors declare that they have no known competing financial interests or personal relationships that could have appeared to influence the work reported in this paper.
Chengcheng Zhang: Writing – original draft, Formal analysis, Data curation. Zhe Wu: Formal analysis, Data curation. Ningning Jiang: Data curation. Yi Song: Data curation. Weina Geng: Data curation. Hongmei Liu: Formal analysis. Ming Jin: Formal analysis. Shuxiang Wang: Supervision. Jinchao Zhang: Supervision. Yutao Yang: Writing – review & editing, Project administration, Conceptualization.
This work was supported by the National Natural Science Foundation of China (Nos. 22177025, 21807021, 22177026), the Science Fund for Creative Research Groups of the Natural Science Foundation of Hebei Province (No. B2021201038), the Foundation of Hebei University (No. 050001-513300201004) and the Director’s Foundation of the Key Laboratory of Medicinal Chemistry and Molecular Diagnosis, Ministry of Education, Hebei University (No. MCMDZR-2024003).
Supplementary material associated with this article can be found, in the online version, at doi:
J. Sameer, M. Johnstone, P.J. McKenna, Lancet 399 (2022) 473–486.
The International Schizophrenia Consortium, Nature 460 (2009) 748–752.
D. Fraguas, C.M. Díaz-Caneja, M. Ayora, et al., Schizophr. Bull. 45 (2019) 742–751. doi: 10.1093/schbul/sby125
X.X. Goh, P.Y. Tang, S.F. Tee, Psychiat. Res. 309 (2022) 114429.
C.W. Wei, Y. Sun, N. Chen, et al., Psychoneuroendocrino 111 (2020) 104473.
M. Zhang, Z.M. Zhao, L. He, C.L. Wan, Sci. China Life Sci. 53 (2010) 112–124. doi: 10.1007/s11427-010-0013-8
K.Q. Do, A.H. Trabesinger, M.K. Krüger, et al., Eur. J. Neurosci. 12 (2000) 3721–3728.
S.R. Rai, C. Bhattacharyya, A. Sarkar, et al., ChemistrySelect 6 (2021) 4566–4590.
T.W. Sedlak, M. Saleh, D.S. Higginson, et al., Proc. Natl. Acad. Sci. U. S. A. 106 (2009) 5171–5176. doi: 10.1073/pnas.0813132106
L. Shen, M. Ma, K.Y. Zhou, Spectrochim. Acta A 324 (2025) 124974.
Y. Long, J.R. Liu, D.H. Tian, et al., Anal. Chem. 92 (2020) 14236–14243. doi: 10.1021/acs.analchem.0c03490
P. Huang, W.J. Zhang, J.P. Wang, F.J. Huo, C.X. Yin, Chin. Chem. Lett. 35 (2025) 109778.
P.S. Baumann, A. Griffa, M. Fournier, et al., Transl. Psychiatry 6 (2016) e859. doi: 10.1038/tp.2016.117
Y.J. Geng, G.Y. Zhang, Y.Z. Chen, et al., Anal. Chem. 94 (2022) 1813–1822. doi: 10.1021/acs.analchem.1c04611
Y.J. Geng, H.C. Zhang, G.Y. Zhang, et al., Anal. Chem. 95 (2023) 11943–11952. doi: 10.1021/acs.analchem.3c01447
L.R. Jiang, T.H. Chen, E.R. Song, et al., Chem. Eng. J. 427 (2022) 131563.
D.J. Zhu, A.S. Ren, L. Xue, Org. Biomol. Chem. 22 (2024) 9113–9120. doi: 10.1039/d4ob01324g
Y.T. Yang, T.T. Zhou, M. Jin, et al., J. Am. Chem. Soc. 142 (2020) 1614–1620. doi: 10.1021/jacs.9b12629
T.P. Xia, Y.X. Hou, Z.R. Xia, Chin. Chem. Lett. 35 (2024) 108577.
S.G. Xue, S.S. Ding, Q.S. Zhai, H.Y. Zhang, G.Q. Feng, Biosens. Bioelectron. 68 (2015) 316–321.
M. Zhang, Y.B. Zhang, F.J. Huo, J.B. Chao, S.M. Shuang, Dyes Pigm. 208 (2023) 110774.
J. Yin, Y. Kwon, D. Kim, et al., J. Am. Chem. Soc. 136 (2014) 5351–5358. doi: 10.1021/ja412628z
Z. Ye, C. Duan, Q. Hu, et al., J. Mater. Chem. B 5 (2017) 3600–3606.
R.R. Nawimanage, B. Prasai, S.U. Hettiarachchi, R.L. McCarley, Anal. Chem. 89 (2017) 6886–6892. doi: 10.1021/acs.analchem.7b01384
P.P. Wang, Y. Liu, L. Tao, et al., Sensor Actuat. B: Chem. 421 (2024) 136549.
H.H. Zhang, C.X. Yan, H. Li, et al., ACS Appl. Bio Mater. 4 (2021) 2001–2008. doi: 10.1021/acsabm.0c00260
C.M. Han, H.R. Yang, M. Chen, et al., ACS Appl. Mater. Interfaces 7 (2015) 27968–27975. doi: 10.1021/acsami.5b10607
Y.T. Yang, K.Y. Zhou, et al., Chem. Eng. J. 452 (2023) 139020.
Y.D. Zhang, X. Wang, X.Y. Bai, et al., Anal. Chem. 91 (2019) 8591–8594. doi: 10.1021/acs.analchem.9b01878
Y.T. Yang, M. Ma, L. Shen, et al., Angew. Chem. Int. Ed. 62 (2023) e202310408.
Y.T. Yang, Y. Zhang, M. Ma, et al., Anal. Chem. 94 (2022) 14443–14452. doi: 10.1021/acs.analchem.2c03390
S. Sombati, R.J.J. Delorenzo, J. Neurophysiol. 73 (1995) 1706–1711. doi: 10.1152/jn.1995.73.4.1706
X. Zhang, T. Liu, X. Fan, N. Ai, Mol. Graph. Model. 75 (2017) 347–354.
L. Shen, H.M. Liu, M. Jin, et al., Chin. Chem. Lett. 35 (2024) 109572.
H. Singh, J.V. Singh, K. Bhagat, et al., Bioorgan. Med. Chem. 27 (2019) 3477–3510.
P.P. Pagare, M.C. Li, Y. Zheng, et al., J. Med. Chem. 65 (2022) 5095–5112. doi: 10.1021/acs.jmedchem.2c00087

Scheme 1 Design strategy of fluorescent probes and their response mechanisms toward biothiols.

Figure 1 Optical performance of DCI-BT-11 (20 µmol/L) towards biothiols in PBS buffer (10 mmol/L, pH 7.4, 40% DMSO, v/v), λex/λem = 575/710 nm, slit/slit = 2 nm/2 nm. (A) Normalized absorption and fluorescence spectra of DCI-BT-11 in the presence of Cys (150 µmol/L). (B) Fluorescence responses of DCI-BT-11 toward various species (200 µmol/L). (C) Fluorescence kinetics of DCI-BT-11 after the addition of 10 equiv. of biothiols. (D) Absorption and (E) fluorescence titration spectra of DCI-BT-11 upon addition of Cys (0–40 µmol/L). (F) Linear correlation between fluorescence intensity and concentrations of Cys. Data are presented as mean ± standard deviation (SD) (n = 3).

Figure 2 (A) HT22 cells were pretreated with LPS for 12 h, followed by incubation with DCI-BT-11 (20 µmol/L) for 40 min prior to fluorescence imaging, respectively. (B) Quantification of fluorescence intensity from (A). (C) HT22 cells were pretreated with LPS (2.0 µg/mL, 10 µL) for 12 h, then incubated with ALA, GSH, NAC, or Vc (1 mmol/L) for 4 h, followed by DCI-BT-11 (20 µmol/L) incubation for 40 min and fluorescence imaging. λex = 561 nm, λem = 640–690 nm. Scale bar: 10 µm. (D) Quantification of fluorescence intensity from (C). Data are presented as mean ± SD (n = 3). One-way ANOVA was used to compare multiple groups. ****P < 0.0001.

Figure 3 (A) Schematic diagram of the treatment protocol for SCZ mice. (B) Fluorescence imaging of SCZ mice treated with ONP (1 mg/kg, 100 µL), NAC (20 mg/kg, 100 µL), or a combination of ONP (1 mg/kg, 50 µL) and NAC (20 mg/kg, 50 µL), along with corresponding cerebrum images. (C) Quantification of fluorescence intensity from (B). λex =510 nm, λem = 600–710 nm.

 扫一扫看文章

扫一扫关注我们
 DownLoad:
 下载:
下载:
 下载:
下载: