Scheme 1.
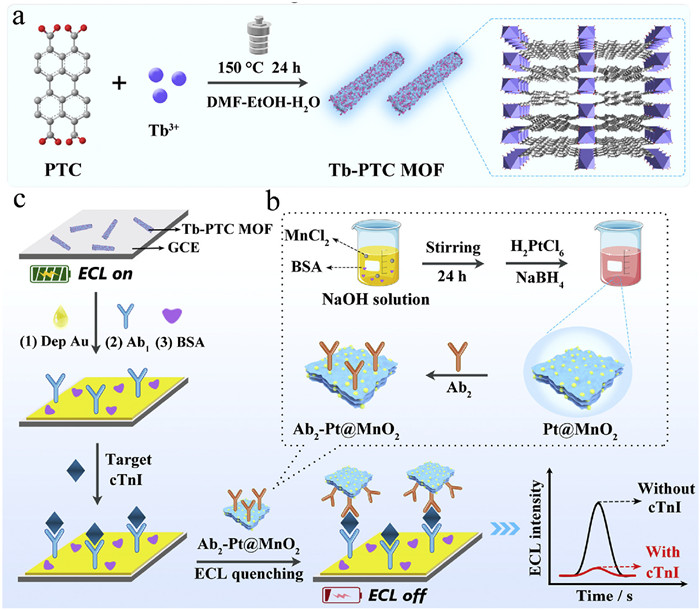
Diagrammatic representation of the procedure of (a) solvent-regulated mesoporous Tb-PTC MOF (luminophore), (b) Ab2-Pt@MnO2 (quenching probe) and (c) the ECL immunosensor construction for cTnI.
Solvent-regulated mesoporous terbium-perylenetetracarboxylate metal organic framework with enhanced electrochemiluminescence for ultrasensitive cTnI bioanalysis
Li Song , Shuchun Bu , Yilan Ding , Pu Zhang , Ya-Qin Chai , Yingzi Fu , Ruo Yuan

Electrochemiluminescence (ECL) involves the light emission from high-energy electron transfer reactions during an electrochemical process featuring high sensitivity, negligible background signal and electrochemical controllability [1–4]. These advantages make ECL active in various fields, including food safety [5–7], environmental monitoring [8,9], bioanalysis and clinical diagnosis [10]. Efficient ECL luminophores are essential for ECL biosensors. Among the reported ECL luminophores (organic, inorganic and nanomaterials, etc.) [11,12], the organic perylenetetracarboxylate (PTC) luminophore with a large π-conjugated system features high thermal stability, conductivity and fluorescence quantum yields [13]. However, it suffers from aggregation-induced quenching (ACQ) by self-quenching and π-stacked aggregates (known as "H-aggregates") and is unable to produce sufficient ECL emission for trace bioanalysis, which limits their application in ECL biosensing [14]. Therefore, there is an urgent demand to overcome the drawbacks and develop PTC-functionalized ECL luminophore with high ECL emission and stability.
Recently, metal organic frameworks (MOFs) are an innovative porous materials developed through metal-organic coordination between the organic ligands and metal ions [15]. The synthesis process of MOF is highly adjustable, that is to say, the morphology of MOF can be controlled within the micrometer/nanometer range by selecting metal ions and organic ligands [16,17] and adjusting the experimental parameters (reaction solvent, temperature or reactant molar ratio) [18–20]. They offer the diverse functions of a large specific surface area, adjustable structure and high porosity, which make them highly attractive for applications in catalysis, biological analysis and biomedical research [21]. Luminophores as ligands assembled into the MOF network can allow the orderly spatial distribution of luminophores, improving the internal excitation of luminophores [22]. Among them, the lanthanide-based MOFs with high coordination numbers and long lifetimes are more likely to be a promising luminescent candidate in the field of ECL biosensing [23–26]. In this work, the luminescent PTC ligand was coordinated with Tb3+ to synthesize a newly Tb-PTC MOF, which achieved more robust ECL emission and high ECL efficiency by reducing the ACQ effect of PTC molecules.
Cardiac troponin Ⅰ (cTnI), a unique protein only present in cardiac myocytes, is recognized as the most reliable diagnosis for acute myocardial infarction (AMI), attributed to its favorable diagnostic window, outstanding sensitivity, and excellent specificity [27–30]. However, the subtle concentration changes in cTnI levels during the onset of AMI present a challenge for precise detection. Therefore, the development of ultrasensitive methods for cTnI is critical for the effective diagnosis and treatment of AMI.
Herein, a Tb-PTC MOF with excellent ECL emission was synthesized through the coordination of PTC (luminescent ligand) with terbium ion (Tb3+, metal ion) by solvothermal method using a mixed solvent of DMF-EtOH-H2O (Scheme 1a). Compared to individual PTC molecules, the Tb-PTC MOFs showed enhanced ECL intensity, improved electron transfer, and narrow band gap by preventing the π-π stacking and the aggregation of PTC molecules. In addition, through the solvent regulation by using different solvents, four Tb-PTC MOFs were prepared and the best one was selected as a luminophore to construct an ultrasensitive ECL immunosensor. The unique mesopore structure (4.1 nm) and rough surface of the selected Tb-PTC MOF can improve the accessibility of active sites and promote the contact area for S2O82– (coreactant) to enhance the ECL efficiency. Furthermore, the constructed ECL immunosensor was implemented for the detection of cTnI, an important biomarker for AMI diagnosis, using the platinum nanoparticle-decorated manganese dioxide nanosheets (Pt@MnO2, Scheme 1b) as a quencher to quench the ECL signal of Tb-PTC MOF. The Pt@MnO2 was introduced onto the modified immunoelectrode by the sandwich recognition technique. In the presence of the target cTnI, the ECL signals of Tb-PTC MOF were efficiently decreased by the dual-quenching mechanism of efficient ECL resonance energy transfer (ECL-RET) and electron transfer (ET) between Tb-PTC MOF and Pt@MnO2 (Scheme 1c). The ECL immunosensor obtained a satisfactory linear range (1 fg/mL − 20 ng/mL) and a low detection limit of 0.48 fg/mL for cTnI analysis. Thus, the developed Tb-PTC MOF with highly efficient ECL emission not only extends the development of PTC-based ECL nanomaterial but also gives a reliable approach to design an ultrasensitive ECL sensor for trace monitoring of disease markers.
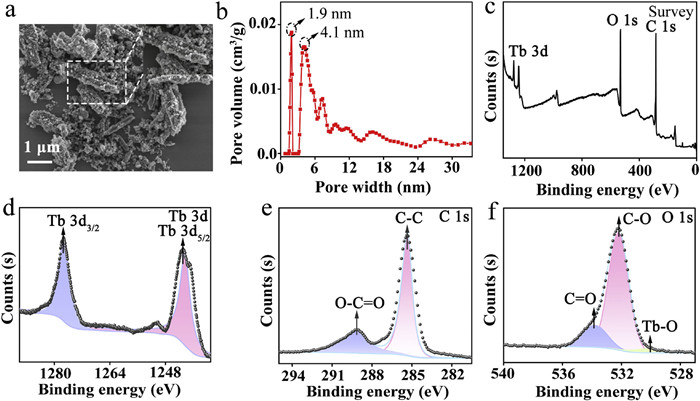
Scanning electron microscopy (SEM) was used to characterize the morphologies of Tb-PTC MOFs. As shown in Fig. 1a, the prepared Tb-PTC MOF shows a hybrid structure of rough microrods with gravel-like nanoparticles on its surface using DMF-EtOH-H2O as solvent. While other Tb-PTC MOFs (Fig. S1, panels a1-c1 in Supporting information), including Tb-PTC MOF-1 (EtOH-H2O as solvent), Tb-PTC MOF-2 (DMF-H2O as solvent), and Tb-PTC MOF-3 (DMF-EtOH as solvent) show nanoribbon-like, microrod-like, and gravel-like morphologies, respectively. The above observations clearly indicate that diverse morphologies of Tb-PTC MOFs can be controlled by tuning the composition of reaction solvent. Meanwhile, the N2 adsorption-desorption isotherms clearly point out that all Tb-PTC MOFs exhibit a typical type Ⅳ isotherm (Fig. S1, panels a2-d2), and the Brunauer-Emmett-Teller (BET) specific surface area of Tb-PTC MOF was measured at 75.9 m2/g (Table S1 in Supporting information). Then the pore size distribution was analyzed by the nonlocal density functional theory method. As shown in Fig. 1b, Tb-PTC MOF exhibits a unique mesoporous distribution with a pore size of 4.1 nm, which is significantly different from other Tb-PTC MOF materials with micropores (Fig. S1, panels a3-c3). The mesopore and rough surface of Tb-PTC MOF can provide abundant active sites and contact surfaces for S2O82– (coreactant) to enhance its ECL response. Moreover, the presence of Tb, C and O elements in Tb-PTC MOF was verified by the full spectrum of X-ray photoelectron spectroscopy (XPS) (Fig. 1c). From the high-resolution XPS (HR XPS) spectra, two distinctive peaks at 1241.7 and 1277.2 eV belong to Tb 3d5/2 and Tb 3d3/2 of Tb 3d (Fig. 1d). Moreover, two typical fitted peaks in the C 1s spectrum at 285.3 and 288.9 eV are referred as C–C and O–C=O in the PTC ligand, respectively (Fig. 1e). Similarly, three peaks at 529.8, 532.1 and 533.8 eV in the O 1s of Tb-PTC MOF are assigned to the existence of Tb–O, C–O and C=O (Fig. 1f), indicating the successful coordination between Tb3+ and PTC.
Powder X-ray diffraction (XRD) patterns were employed to analyze the crystallinity of these Tb-PTC MOFs. Fig. 2a clearly illustrates that Tb-PTC MOF exhibits robust diffraction peaks at 6.38°, 9.01°, 12.78°, 25.34°, and 27.58°, corresponding to the crystal planes (001), (011), (002), (004), and (102), respectively [31]. The presence of these well-defined peaks serves as a strong indicator of the favorable crystallinity of Tb-PTC MOF. Additionally, consistent peak types and positions are observed throughout all Tb-PTC MOFs (Fig. S2a in Supporting information), suggesting that the choice of solvent does not exert any influence on the crystallinity of these Tb-PTC MOFs. The Fourier transform infrared (FT-IR) spectrum was used to reveal the important molecular characteristics of PTC and Tb-PTC MOF. As displayed in Fig. 2b, the peaks at 1771, 1738, 1301 cm–1 are attributed to the skeletal vibration of C=O and C-O stretching in the –COOH group, respectively. The peaks at 1593, 758 cm–1 are associated with the skeletal vibration of the aromatic ring and C-H, verifying the presence of aromatic structures. Moreover, the peaks at 1441 and 1359 cm–1 are assigned to the asymmetric and symmetric vibrations of the COO– group, providing evidence for Tb3+ coordination [32,33]. Similar characteristic peaks are observed among all Tb-PTC MOFs (Fig. S2b in Supporting information). This observation suggests that the impact of solvent type on the functional groups is negligible.
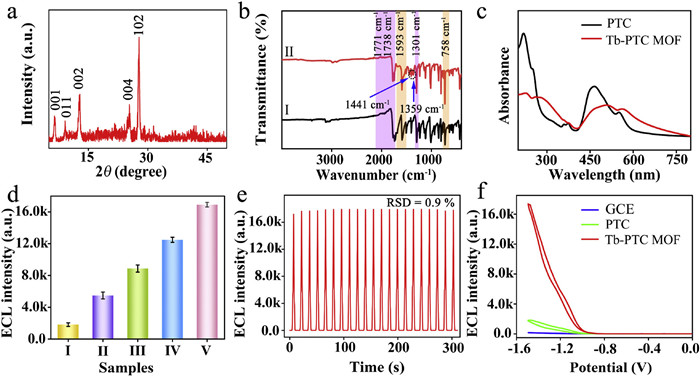
From the UV−vis absorption spectrum (Fig. 2c), the Tb-PTC MOF displays a red shift compared with PTC ligand, which can be attributed to an increase in the electron density of the perylene ring to reduce the energy required for electron transitions. This red shift behavior is consistent among all Tb-PTC MOFs (Fig. S2c in Supporting information). Furthermore, all Tb-PTC MOFs exhibit narrow band gap (Eg) compared with PTC ligand via Tauc plots, indicating the coordination of the PTC ligand with Tb3+ to form the MOF structure resulted in easier energy transfer (Fig. S2d in Supporting information).
We compare the ECL performance of different Tb-PTC MOFs synthesized in variable reaction solvents. As depicted in Fig. 2d, all Tb-PTC MOFs modified electrodes exhibit significantly enhanced ECL responses compared with individual PTC molecule. This observation highlights the effectiveness of coordination to mitigate the ACQ effect of PTC for an enhanced ECL signal. Then, the effect of Tb-PTC MOF crystallinity on the ECL performance was optimized by regulating the temperature and time. From the XRD and ECL results (Fig. S3 in Supporting information), the synthesis conditions of Tb-PTC MOF were optimized as 150 ℃ and 24 h. Additionally, the electrochemical impedance spectroscopy (EIS) results (Fig. S4 in Supporting information) indicate that all Tb-PTC MOFs modified electrodes exhibit better electron transfer ability than that of PTC ligand. Next, the Tb-PTC MOF shows a well ECL stability with a relative standard deviation (RSD) of 0.9% during 21 consecutive potential scanning (Fig. 2e). Compared with PTC, a positive shift in Tb-PTC MOF/GCE was observed (Fig. 2f). This may be due to the accelerated electron transfer of Tb-PTC MOF to improve the redox efficiency of the Tb-PTC MOF/S2O82− system. Therefore, the coordination structure, mesopore, rough surface, and narrow band gap cooperatively enhanced the ECL performance of Tb-PTC MOF. The Tb-PTC MOF was selected for the following experiments, including exploration of luminescence mechanisms and immunosensor construction.
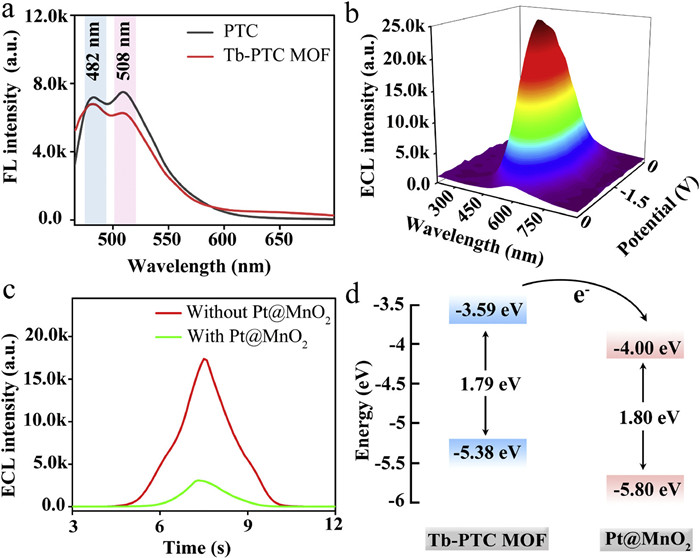
Fluorescence (FL) and ECL spectra were carried out to reveal the luminescent source of Tb-PTC MOF. As depicted in Figs. 3a and b and Fig. S5 (Supporting information), the maximum FL emission peak and the highest ECL emission peak of Tb-PTC MOF are consistent with the ligand PTC, confirming that the luminescent center of Tb-PTC MOF is located on the ligand PTC. Similarly, mismatched energy levels between the excited triplet state of PTC ligand and the excited state of Tb3+ provide evidence for ligand-induced emission of Tb-PTC MOF (Table S2 in Supporting information). Then, the Pt@MnO2 was selected as ECL quencher in this work, and the transmission electron microscopy (TEM) images proved that MnO2 shows an ultrathin nanosheet and Pt NPs have been loaded on its surface to form Pt@MnO2 (Fig. S6 in Supporting information). In addition, the loading amount of Pt NPs on the surface of MnO2 (wt%) was calculated by inductively coupled plasma optical emission spectrum (ICP-OES) analysis and optimized as 11.3% for the best ECL quenching (Table S3 and Fig. S7 in Supporting information). The ECL signal of Tb-PTC MOF were significantly decreased (Fig. 3c) and the fluorescence lifetime (τ) was clearly reduced (Fig. S8 in Supporting information) after the addition of Pt@MnO2, indicating that the prepared Pt@MnO2 was an applicable quencher to quench the ECL signal of Tb-PTC MOF. We speculate on two main possible mechanisms for this ECL quenching phenomenon: Electrochemiluminescence resonance energy transfer (ECL-RET) and electron transfer (ET) between Pt@MnO2 and Tb-PTC MOF [34]. First, the UV–vis absorption spectra of Pt@MnO2 overlapped well with the ECL spectrum of Tb-PTC MOF (Fig. S9 in Supporting information), which provides evidence for ECL-RET between Pt@MnO2 and Tb-PTC MOF. Second, to verify the electron transfer, the band gap (Eg) of Pt@MnO2 was determined using Tauc plot analysis to be 1.80 eV (Fig. S10 in Supporting information). The highest occupied (HOMO) and the lowest unoccupied (LUMO) molecular orbital energy levels of Tb-PTC MOF and Pt@MnO2 were calculated in a N2-saturated acetonitrile solution (supporting electrolyte: tetrabutylammonium hexafluorophosphate) (Fig. S11). All the results are presented in Fig. 3d and Table S4 (Supporting information). Pt@MnO2 shows a much lower LUMO level than Tb-PTC MOF, demonstrating the possibility of electron transfer from Tb-PTC MOF to Pt@MnO2, thus leading to the ECL signal quenching of Tb-PTC MOF. Thus, the ECL intensity of Tb-PTC MOF is effectively quenched by Pt@MnO2 through an efficient dual-mechanism quenching strategy of ECL-RET and ET, providing solid evidence to construct an ECL biosensor using Tb-PTC MOF and Pt@MnO2.
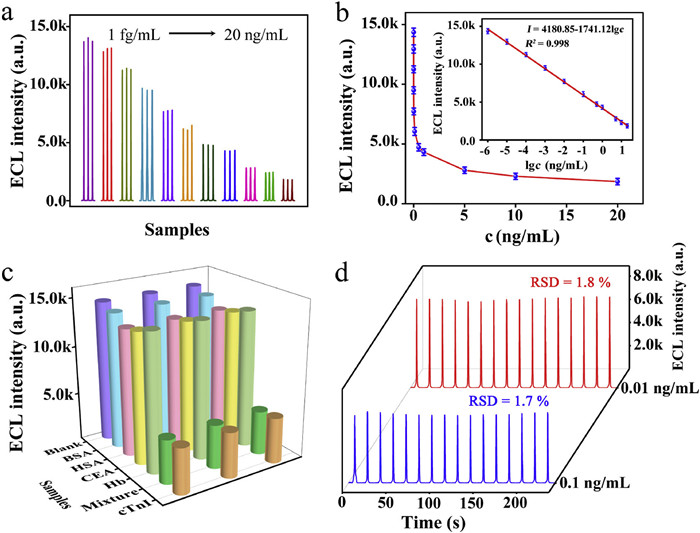
The stepwise assembly process of the designed ECL immunosensor were characterized by EIS and cyclic voltammetry (CV) (Fig. S12 in Supporting information). After the optimization of experiment condition (Fig. S13 in Supporting information), the ECL immunosensor shows that higher cTnI concentrations (c) result in a decrease of the ECL intensity (I) (Fig. 4a), and the linear regression equation was calculated to be I = 4180.85–1741.12 lgc (R2 = 0.998) in the range of 1 fg/mL to 20 ng/mL with a detection limit of 0.48 fg/mL (S/N = 3) for cTnI detection (Fig. 4b). The constructed ECL biosensor for cTnI had a lower detection limit and a wider linear range compared to other analytical strategies (Table S5 in Supporting information). Furthermore, the designed ECL immunosensor has an extraordinary selectivity for cTnI detection among a series of proteins including bovine serum albumin (BSA), human serum albumin (HSA), carcinoembryonic antigen (CEA) and hemoglobin (Hb) (Fig. 4c). Notably, under 16 consecutive cyclic potential scanning in S2O82− (25 mmol/L), no significant fluctuations were observed in the manufactured ECL immunosensor with the target cTnI concentrations of 0.01 ng/mL and 0.1 ng/mL, yielding relative standard deviations (RSD) of 1.8% and 1.7%, respectively, confirming superior stability of the proposed ECL immunosensor (Fig. 4d). In addition, the ECL signal of designed immunosensor can still be maintained by 84.5% after one week of storage (Fig. S14 in Supporting information), showing a favorable long-time stability for cTnI analysis.
To assess the practical utility of the constructed ECL immunosensor for cTnI detection, standard addition method was employed to determine the recovery rate in 50-fold diluted serum samples (provided by the Ninth People's Hospital of Chongqing, China and approved by the Human Ethics Committee, 2023-LS-KW-007). As shown in Table S6 (Supporting information), the serum samples with different additions of cTnI (0.050, 0.50, 5.0 ng/mL) demonstrated outstanding recoveries ranging from 94.0% to 101.2% with RSD <3.5% (n = 3). Thus, the above experiments confirm that the ECL immunosensor is a reliable tool for cTnI analysis in real samples, highlighting its potential for practical use in clinical diagnosis.
In summary, we synthesized a series of Tb-PTC MOFs with different pore size, band gap and ECL performance by tuning the composition of reaction solvents. The ACQ effect of PTC is significant reduced by integrating PTC ligand into the coordination structure to extend the spatial distance of PTC ligand and enhance the ECL performance. Meanwhile, using DMF-EtOH-H2O as solvent, the mesoporous Tb-PTC MOF was obtained and its mesopore ensures sufficient contact and transport between the Tb-PTC MOF (luminophore) and S2O82− (coreactant), shortening the electron transmission distance to improve the ECL performance. In addition, the narrow band gap of Tb-PTC MOF accelerates the electron/hole recombination by favoring the electron transfer, leading to the enhanced ECL emission. Finally, a novel ECL biosensor was developed for ultrasensitive quantification of cTnI using the mesoporous Tb-PTC MOF as emitter and the Pt@MnO2 as ECL quencher through an efficient dual-mechanism quenching strategy of ECL-RET and ET. The constructed ECL biosensor realized a satisfactory linear response, LOD, specificity, and stability for the quantitative detection of cTnI. This work introduces an innovative approach to effectively mitigate the ACQ effect of PTC, facilitating the development of high-performance PTC-based ECL materials and the ECL biosensor for ultrasensitive detection of biomarkers.
The authors declare that they have no known competing financial interests or personal relationships that could have appeared to influence the work reported in this paper.
Li Song: Writing – original draft, Methodology. Shuchun Bu: Investigation. Yilan Ding: Software. Pu Zhang: Conceptualization. Ya-Qin Chai: Supervision. Yingzi Fu: Writing – review & editing, Project administration, Funding acquisition. Ruo Yuan: Writing – review & editing, Project administration, Funding acquisition.
This work was financially supported by National Natural Science Foundation of China (Nos. 22077105, 22374122, 22204129, 22176153 and 22174113), the Natural Science Foundation of Chongqing (No. CSTB2022NSCQ-MSX0613) and Fundamental Research Funds for the Central Universities (No. SWU-KR22017). The authors would like to thank Shiyanjia Lab (
Supplementary material associated with this article can be found, in the online version, at doi:
M.Z. Xi, Z.C. Wu, Z. Luo, et al., Angew. Chem. Int. Ed. 62 (2023) e202302166. doi: 10.1002/anie.202302166
D.Y. Wang, X.W. Gao, J.N. Jia, et al., ACS Nano 17 (2023) 355–362. doi: 10.1021/acsnano.2c08474
K.Y. Shen, J.L. Zhan, L. Shen, et al., Anal. Chem. 95 (2023) 4735–4743. doi: 10.1021/acs.analchem.2c05535
N. Zhang, X.T. Wang, Z.P. Xiong, et al., Anal. Chem. 93 (2021) 17110–17118. doi: 10.1021/acs.analchem.1c04608
M.M. Chen, H. Gao, Z.B. Ge, et al., J. Agric. Food Chem. 72 (2024) 2826–2833. doi: 10.1021/acs.jafc.3c08389
Y.P. Li, X. Gao, Y.S. Fang, et al., Coord. Chem. Rev. 485 (2023) 215136. doi: 10.1016/j.ccr.2023.215136
Y. Zhao, R.Z. Wang, Y.H. Wang, et al., Food Chem. 413 (2023) 135627. doi: 10.1016/j.foodchem.2023.135627
Z.Y. Wang, J.B. Pan, Q. Li, et al., Adv. Funct. Mater. 30 (2020) 2000220. doi: 10.1002/adfm.202000220
Y.Z. Shen, X. Gao, H.J. Lu, et al., Coord. Chem. Rev. 476 (2023) 214927.
Y.G. Wang, G.H. Zhao, H. Chi, et al., J. Am. Chem. Soc. 143 (2021) 504–512. doi: 10.1021/jacs.0c12449
A. Zanut, A. Fiorani, S. Canola, et al., Nat. Commun. 11 (2020) 2668. doi: 10.1038/s41467-020-16476-2
Y.F. Wang, J.L. Ding, P. Zhou, et al., Angew. Chem. Int. Ed. 62 (2023) e202216525. doi: 10.1002/anie.202216525
Y. Guo, Q.X. Zhou, J. Nan, et al., Nat. Commun. 13 (2022) 2067. doi: 10.1038/s41467-022-29826-z
Y.J. Huang, J. Xing, Q.Y. Gong, et al., Nat. Commun. 10 (2019) 169. doi: 10.1038/s41467-018-08092-y
Z.X. Lin, J.J. Richardson, J.J. Zhou, F. Caruso, Nat. Rev. Chem. 7 (2023) 273–286. doi: 10.1038/s41570-023-00474-1
H.Y. Lin, Y.H. Yang, B.G. Diamond, et al., J. Am. Chem. Soc. 146 (2024) 1491–1500. doi: 10.1021/jacs.3c10917
W.R. Cai, H.B. Zeng, H.G. Xue, et al., Anal. Chem. 92 (2020) 1916–1924. doi: 10.1021/acs.analchem.9b04104
J. Zhong, X. Yuan, J. Xiong, et al., Environ. Res. 226 (2023) 115633. doi: 10.1016/j.envres.2023.115633
L. He, W. Li, Z.W. Jiang, et al., Chem. Eng. J. 374 (2019) 1231–1240. doi: 10.1016/j.cej.2019.06.026
P.P. Li, L. Luo, D. Cheng, et al., Anal. Chem. 94 (2022) 5707–5714. doi: 10.1021/acs.analchem.2c00737
Y.C. Pi, Z.M. Qiu, Y. Fan, et al., Nano Lett. 24 (2024) 13760–13768. doi: 10.1021/acs.nanolett.4c04014
Y. Yang, J.M. Wang, W.B. Liang, et al., Anal. Chem. 96 (2024) 16362–16369. doi: 10.1021/acs.analchem.4c03782
L. Zhao, X.Z. Song, Y.Y. Li, et al., Biosens. Bioelectron. 221 (2023) 114925. doi: 10.1016/j.bios.2022.114925
W.J. Dai, X.Y. Wang, G.X. Chen, et al., Chem. Eng. J. 465 (2023) 143037.
H. Dong, L. Zhao, Y. Chen, et al., Anal. Chem. 94 (2022) 11940–11948. doi: 10.1021/acs.analchem.2c02898
Y.F. Chen, Y.Z. Guo, S. Xiao, et al., Anal. Chem. 96 (2024) 4589–4596. doi: 10.1021/acs.analchem.3c05517
X.W. Du, X.J. Su, W.X. Zhang, et al., Anal. Chem. 94 (2022) 442–463. doi: 10.1021/acs.analchem.1c04476
Y.Q. Zhao, A.J. Zhao, Z.Z. Wang, et al., Anal. Chem. 95 (2023) 11687–11694. doi: 10.1021/acs.analchem.3c01647
S.G. Li, H.Y. Zhang, M. Zhu, et al., Chem. Rev. 123 (2023) 7953–8039. doi: 10.1021/acs.chemrev.1c00759
X.F. Tang, Y.P. Zhu, W.J. Guan, et al., Life Sci. 305 (2022) 120733. doi: 10.1016/j.lfs.2022.120733
F. Liu, G. Ding, Z. Zheng, et al., Chem. Eng. J. 429 (2022) 132377. doi: 10.1016/j.cej.2021.132377
G. Valente, M. Esteve-Rochina, S.P.C. Alves, et al., Inorg. Chem. 62 (2023) 7834–7842. doi: 10.1021/acs.inorgchem.3c00540
G. Valente, M. Esteve-Rochina, A. Paracana, et al., Mol. Syst. Des. Eng. 7 (2022) 1065–1072. doi: 10.1039/d2me00108j
H. Gao, X. Wei, M.Z. Li, et al., Small 17 (2021) 2103424.

Scheme 1 Diagrammatic representation of the procedure of (a) solvent-regulated mesoporous Tb-PTC MOF (luminophore), (b) Ab2-Pt@MnO2 (quenching probe) and (c) the ECL immunosensor construction for cTnI.

Figure 1 (a) SEM image, (b) pore size distribution, (c) XPS spectrum of Tb-PTC MOF (inset of a: a partially enlarged SEM image of Tb-PTC MOF), and the HR XPS spectra of Tb-PTC MOF: (d) Tb 3d, (e) C 1s and (f) O 1s.

Figure 2 (a) XRD pattern of Tb-PTC MOF, (b) FT-IR spectra of (Ⅰ) PTC and (Ⅱ) Tb-PTC MOF, (c) UV−vis absorption spectra of Tb-PTC MOF and PTC ligand, (d) ECL responses of PTC and different Tb-PTC MOFs: (Ⅰ) PTC, (Ⅱ) Tb-PTC MOF-1, (Ⅲ) Tb-PTC MOF-2, (Ⅳ) Tb-PTC MOF-3, (Ⅴ) Tb-PTC MOF, and (e) stability of Tb-PTC MOF. (f) ECL intensity-potential curves of different modified electrodes with S2O82− (25 mmol/L).

Figure 3 (a) FL spectra of PTC and Tb-PTC MOF, (b) 3D ECL spectra of Tb-PTC MOF, (c) ECL signal-time curves of Tb-PTC MOF and Pt@MnO2/Tb-PTC MOF, and (d) a schematic view of energy diagrams of Tb-PTC MOF and Pt@MnO2 and electron transfer from Tb-PTC MOF to Pt@MnO2.

 扫一扫看文章

扫一扫关注我们
 DownLoad:
 下载:
下载:

 下载:
下载: