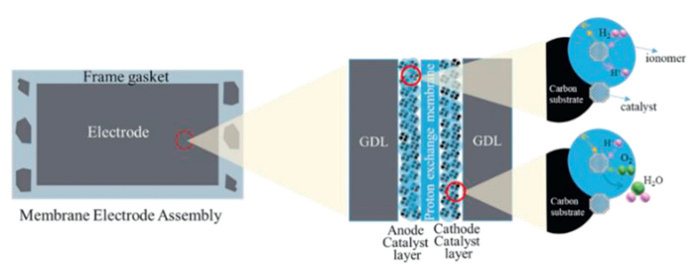
Figure 1.
Typical membrane electrode assembly (MEA) structure schematic and catalyst layer exploded view.

Structure, design, and advanced characterization techniques of catalyst layers in proton exchange membrane fuel cells
Linghai Han , Xue Gong , Yupeng Wang , Dan Wang , Chunyu Ru , Xian Wang , Donglai Guo , Fangbing Liu , Xia Sheng , Junjie Ge


PEMFC technology is a promising clean energy solution that can convert chemical energy with zero carbon emissions into electrical energy [1–3]. The application of PEMFC in vehicles has reached a new stage since many countries have issued a number of PEMFC vehicles development policy, such as FCV and HDV fuel cell technology development roadmap released by NEDO in Japan and PEMFC Multi-Year Program Plan announced by U.S. Department of Energy in 2024. Moreover, many automobile enterprises have launched fuel cell vehicles, such as Toyota's Mirai and Hyundai's Nexo [4,5]. Typically, China has already started demonstration operations of fuel cell vehicles since 2020, and the number of such vehicles has exceeded 20,000. It is an obvious signal that the fuel cell industry has entered a period of rapid development. The core of PEMFC is the membrane electrode assembly (MEA), which consists of a proton exchange membrane (PEM), gas diffusion layer (GDL), catalyst layer (CL), and seal borders. The typical structure of MEA is shown in Fig. 1. Of these components, the CLs are the main functional areas where chemical reactions occur.
To meet the demands for high performance in PEMFCs, the CL should be equipped with a large electrochemical reaction area, high electrochemical reactivity, fast electron transport, rapid proton conductivity, and low oxygen transport resistance [6–8]. The CL is composed of ionomers and catalysts, in which the ionomers cover the inner or outer surfaces of catalyst particle aggregates, acting as binders and proton conduction channels [9–12]. Besides high proton conductivity, the ionomers should also have high oxygen permeability. Moreover, the ionomer coverage, thickness, and the three-dimensional network are the main factors affecting PEMFC performance. Furthermore, the CL structure is always determined by the properties of the catalyst ink and the method of CL formation [13–15]. Catalyst inks are complex fluids that mainly consist of three main components: The solvent, ionomer, and catalyst particles. Based on this, the development of new types of materials is central to regulating the properties of the CL ink. Moreover, the ratio of ionomer to carbon support (I/C ratio) is another important factor that should be carefully designed to regulate the properties of the CL ink. Moreover, the interactions between the solvent and the ionomer can also affect the morphology of the ionomer as well as the ionomer network [16–19]. Thus, solvent parameters, such as the dielectric constant and solubility parameters, should be considered. What is more, the interactions between the solvent and catalyst particles can affect the distribution, size, and structure of particle cluster agglomerates, as well as the stability of the ink [20,21]. Currently, the influence mechanism of the components has been deeply investigated. Furthermore, the dispersion method of catalyst ink can affect its properties, such as viscosity and interactions between ionomers and particles [22–24]. It is necessary to establish a relationship between the dispersion process and the characteristics of the catalyst ink to guide the standardized preparation of the ink. What is more, the design of the catalyst layer structure has been a hot topic in both scientific research and industrial applications [25,26]. In recent years, many efforts have been made to design a high-performance CL with low platinum (Pt) loading and low mass transfer resistance [27–29]. This has been achieved by regulating the ionomer distribution, implementing a multistage pore structure, and controlling the thickness of the CL [30]. With the development of advanced instruments and equipment, various devices for manufacturing CL have emerged [31–33]. Based on the solid content and viscosity, the ultrasonic spraying method is often used for CL synthesis in laboratories, while slot die coating is considered the most common method for industrial production [3,34,35]. During the CL formation process, the drying step is an important procedure that can determine the pore structure and surface morphology of the CL [36,37]. Recently, the evaporation mechanism of mixed solvents in the CL formation process has been deeply studied. With further study of the catalytic layer formation process, it is expected that catalytic layers with higher activity and quality will be produced. Advanced characterization techniques are very important for studying the CL structure [38–40]. As it has been well established, X-ray diffraction (XRD), scanning electron microscope (SEM), and X-ray photoelectron spectroscopy (XPS) are common devices used to evaluate the CL structure and chemical composition [25,41,42]. However, it is difficult to obtain more precise structural information from these devices, such as the location of platinum (Pt) on the carbon substrate and the distribution of ionomers, among other details. Up to now, many other advanced characterization techniques have been applied to CL, such as X-ray computed tomography (nano-CT) [41,43] and electron tomography acquisition techniques [44,45]. Nano-CT can provide high-resolution, three-dimensional images of the internal structure of the catalyst layer, which is beneficial to understanding the transport and reaction mechanisms within the CL, thus improving the performance and lifespan of fuel cells [46]. Electron tomography acquisition can obtain multi-scale CL structure information, from catalyst location to ionomer morphology, with the aid of deep learning [47,48]. In this review, we will summarize recent progress in catalyst ink-based CL, CL design, CL manufacturing, and CL structural characterization to provide inspiration for future work.
As the main steps for fabricating a catalyst layer are shown in Fig. 2, catalyst inks are usually composed of catalysts, ionomers, and solvents, in which the properties of catalyst inks highly impact the structure and performance of obtained CLs (Fig. 3a) [49,50]. The active materials of catalyst ink and the catalyst ink dispersion process can determine the component distribution, aggregate size, ionomer coverage, thickness, pore structure, and performance of CLs [22,24,51]. Typically, the catalyst is the main active component, where the oxygen reduction reaction and hydrogen oxidation reaction occur on the cathode catalyst and anode catalyst, respectively [9,52]. Usually, the catalyst consists of active noble metals located on a support [53–55]. The cost and performance of catalysts are the main factors determining the practical applications. Among them, the durability of the catalyst directly determines the upper limit of the fuel cell's service life. Up to now, Pt/C catalysts with high metal loading (≥40 wt%) have been widely used as both the cathode and anode catalyst in PEMFCs, due to their excellent activity, stability, and ease of scale-up. Besides, the design of PtCo contributes to higher activity and lower Pt usage. However, its durability may still not meet the requirements for commercial applications [56,57]. Focusing on commercial fuel cell vehicles (FCVs) from companies such as Toyota, it used Pt/C for the 1st generation Mirai FCV introduced in 2015 [58], in which Pt nanoparticles are located on solid carbon to enhance the utilization ratio of Pt. However, much Pt exposure on the surface of the carbon support may lead to catalyst poisoning caused by the ionomer covering the surface of Pt [59]. With the development of materials technology, PtCo/C has been proven to be the most promising catalyst because of its high activity and stability. The 2nd generation Mirai FCV used a mesoporous carbon-supported PtCo alloy catalyst, where 80% of the metal in a CL is located in the pores of the mesoporous carbon, benefiting from inhibiting sulfonic acid poisoning by blocking the direct contact between the ionomer and Pt nanoparticles [60]. Besides, the design of PtCo contributes to higher activity and lower Pt usage. Inspired by vehicle applications, many scientists have paid attention to the development and optimization of alloy catalysts as well as new structures of carbon support [61–63]. A larger amount of non-noble metals (Fe, Ni, Co, Cu, etc.) has been studied to alloy with Pt, resulting in higher activity, lower Pt loading, and partially restricting the migration and agglomeration of Pt, as compared with Pt/C [64–68]. And since the geometric morphology is sensitive to catalyst performance, great efforts have been made to design new shapes and structures, aiming to increase the exposure of active sites and the usage of noble metals, such as core-shells [69,70], nanotubes [71,72], nanocages [73,74], and intermetallic compounds (Fig. 3b) [30]. It has been well known that support materials also play a significant role in catalyst performance by providing strong interactions between active sites and support, fast electron transfer ability, and high specific surface area for uniform Pt dispersion. The most commonly used commercial catalyst supports include Vulcan, Black Pearls, Ketjen Black [75–77]. The benefits of XC-72R include a larger amount of defect sites for anchoring metal active sites and a large specific surface area to disperse Pt. As for Ketjen Black, it has a large amount of micropores, making a significant portion of Pt located at the interface of the carbon support. As a result, high catalyst activities and excellent anti-poisoning properties are achieved for Ketjen Black-supported catalysts. The biggest challenge of leading to the detachment of Pt from the carbon support [78,79]. A lot of new carbon materials have been proposed in recent years to modify the properties of catalyst support, including mesoporous carbon, carbon nanotubes, defect amorphous carbon, and high graphitized carbon. The structue of carbon can affect the contact mode of catalyst particles with ionomer (Figs. 3f and g).

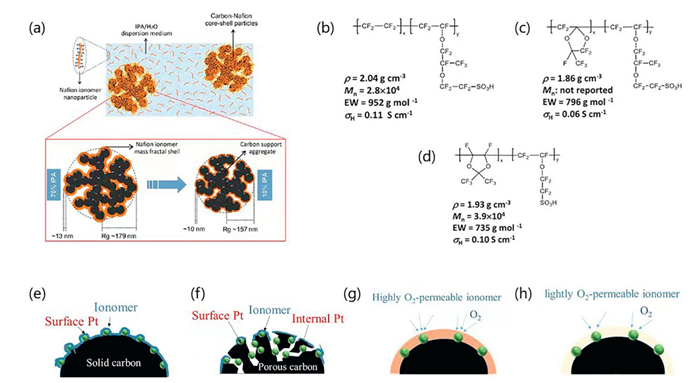
Although plenty of novel catalysts and carbon supports have been explored, achieving excellent activity and stability in RDE or MEA systems, few catalysts can meet the needs of automotive fuel cells [30,80,81]. There is still a wide gap to be bridged between scientific research and engineering applications.Ionomers are also a key component in catalyst ink, which act as not only a binder but also a proton transport pathway between catalysts [10,82,83]. Besides, ionomers should meet the requirements of high oxygen permeability, high water transportation ability, and high chemical stability against the attack of free radicals. The high oxygen permeability allows oxygen molecules to diffuse to the catalyst active sites and react with protons as well as electrons [11,84,85]. High oxygen transport resistance usually causes unfavorable voltage decay. Typically, the ionomer material is similar to the PEM to enhance interface compatibility. Up to now, perfluorinated sulfonic acid (PFSA) has been the most used ionomer, which is composed of a polytetrafluoroethylene (PTFE) main chain and sulfonic acid side chains. The hydrophobic backbone provides mechanical support, while the hydrophilic sulfonic acid side chains are responsible for proton transport [86,87]. Several studies have reported outstanding improvements in PEMFC performance by designing new structures of ionomers with high oxygen permeability [88,89]. Toyota's 2nd generation Mirai FCV used an innovative, highly oxygen-permeable ionomer structure with oxygen diffusion performance three times higher than traditional materials, contributing to the enhancement of performance [60]. However, the detailed structure of this kind of ionomer is not publicly available. And 3 M Advanced Materials Division Lab and its partners initiated a research project aimed at significantly improving the durability of hydrogen fuel cells by enhancing the chemical stability of ionomers. Besides, many highly oxygen-permeable ionomers have been reported in recent years (Figs. 3c-e) [90]. For example, a new ionomer with a glassy backbone was proposed, introducing a perfluoro(2-methylene-4-methyl-1,3-dioxolane) into the backbone, which can effectively restrict ionomer swelling, thus improving oxygen permeability while maintaining acceptable proton conductivity (Figs. 3h and i). Inspired by this design concept, another type of highly oxygen-permeable ionomer based on perfluoro-(2,2-dimethyl-1,3-dioxole) was reported [11]. And a high oxygen permeation mechanism was proposed by combining analyses of experiments and MD simulations. At present, the widely commercially applied ionomers mainly come from Chemours, Asahi Glass, and Solvay. The resin content of these ionomers is typically around 20%−30%. The water content and VOC content are determined based on their own design. The EW value is < 1100, and some can even reach 700. It can also be clearly seen that low EW values and high oxygen permeability are the future development directions for ionomers, even though it is quite challenging.
Solvent is crucially important for catalyst ink as a medium for catalyst and ionomer [91,92]. Various kinds of low boiling point solvents have been adopted, such as dimethylformamide, ethylene glycol, N-methylpyrrolidone, ethanol, acetone, and isopropanol, in which mixtures of water and alcoholic solvents are commonly used [18,93]. The properties of solvents determine the rheological behavior of catalyst ink, such as viscosity, dispersion characteristics, volatility, and stability [17,94]. Typically, the polarity of solvents, usually represented by the dielectric constant, is the most important factor, which may affect the form of existence of the ionomer and catalyst aggregates in catalyst ink [19,20,95]. The higher the dielectric constant, the greater the polarity of the solvent, and the longer the distance between opposite charges [96,97]. Whether the ionomer is present in solution, colloid, or precipitate in the catalyst slurry heavily depends on the polarity of the solvent [98,99]. The solvent's properties may determine the microstructure and colloidal size of the ionomer, thus affecting the dispersion of the ionomer on the catalyst surface, the ionomer/catalyst interface, the coverage fraction and thickness of the ionomer, as well as the porosity of the catalyst layer [19,21,100]. The choice of catalyst ink solvent is very important for designing a highly effective catalyst layer and usually needs to consider the properties of other components in the catalyst ink and the preparation process parameters of the catalytic layer [96,101].
The interaction among ionomers, solvents, and catalysts in catalyst ink governs the structure of aggregates and interfaces, as well as the properties of the catalyst layer, which is very important to the design of high-performance MEAs [91,102]. Up to now, it is still a big challenge to elucidate such a complex system. It is necessary to study the interactions between ink constituents, and we have summarized some important works in this field reported in recent years.
The interactions between ionomers and solvents have a notable impact on the existing form, structure, and size of ionomers in different solvents, thus affecting the catalyst/ionomer interface of the CL [18,94,103]. The dielectric constant (ε) and solubility parameters (δ) of solvents are mainly responsible for the conformations of ionomers in solvents or mixed solvents (Fig. 4a) [8,101]. It has been well established that: (1) In solvents with ε > 10, the ionomer stays in solution form; (2) in solvents with ε between 3 and 10, the hydrophilic side chain of the ionomer becomes insoluble, making the ionomer exist as a colloid; (3) in solvents with ε < 3, ionomer micelles tend to solidify into a precipitate [19,102]. Solubility parameters δ, usually representing the compatibility between ionomers and solvents, are another important factor affecting the conformations of ionomers in solvents, especially in dilute media [104,105]. The δ should be within a suitable range to dissolve the ionomer polymer. Findings have claimed that inter-polymer hydrophobic backbones and hydrophilic side chains in Nafion-type ionomers have different compatibilities with solvents [19,25,101,106]. The primary aggregated ionomer particles in the solutions are attributed to the inter-backbone interactions or the inter-ionic interactions of different polymer side chains (such as -SO3-…[H3O+]…-SO3-). And the aggregated particles mainly come from inter-polymer hydrophobic parts aggregation, resulting from the negative charge repulsion of the functional group on different side chains, highly relying on the compatibility of the backbones and solvents [18]. The size of the aggregated particles is related to the compatibility between ionomers and the solvents [105,107].
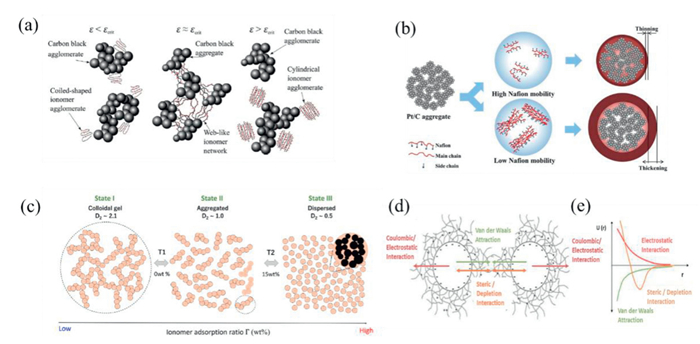
With the help of small angle neutron scattering (SANS) and small angle X-ray scattering (SAXS), it has been established that PFSA-type ionomers in dilute solution usually form rod-like aggregation particles through two aggregation processes [108–111]. The primary aggregation step may lead to smaller particles caused by the interactions of the hydrophobic backbone, while the secondary aggregation steps may form larger particles, resulting from the electrostatic interactions of the hydrophilic side chains [91,112,113]. The size of ionomer micelle particles is related to the polymer-solvent interfacial energy, especially in polar solvents including alcohols, amides, and water. Furthermore, the stability of catalyst ink is highly related to the ionomer/solvent interactions, as the ionomer can function as a strong stabilizing agent [113,114]. The addition of ionomer contributes to improving ink stability and reducing particle size [105,115,116]. Moreover, the higher the dielectric constant of the solvent, the stronger the effect of the ionomer in stabilizing the ink, even at very small amounts of ionomer used [117]. What is more, the mobility of ionomers also has a significant effect on the structure and properties of the catalyst layer (Fig. 4b) [99]. As confirmed by fluorine-19 nuclear magnetic resonance technology, the mobility of the main chains of ionomers varies in different solvents. Consequently, higher mobility of ionomers leads to a larger triple-phase boundary and electrochemically active surface area, achieving lower charge-transfer resistance for PEMFCs [105,118,119].
The interactions between ionomer and catalyst particles in catalyst inks, including ionomer/platinum and ionomer/carbon support, should also be considered, since they may affect the interface structure and the size of agglomerates in the CL (Fig. 4c) [120]. The distribution, thickness, and coverage of ionomer in the CL are responsible for the contact between catalyst particles, mass transfer, and catalyst utilization [107,121]. Typically, a thin ionomer membrane on the catalyst contributes to high proton conductivity and low oxygen transfer resistance [122,123]. An uneven distribution of ionomers on the catalyst may cause some catalyst particles to lack contact, and some catalyst surfaces to have overly thick ionomers. The interactions between ionomers and particles in catalyst ink are usually determined by adsorption forces and electrostatic interactions between ionomers and catalysts. It is well established that ~SO3- groups on PFSA side chains have strong interactions with platinum catalysts. However, it is difficult to distinguish whether the ionomer is on platinum or on a carbon carrier within a catalyst layer. At the same time, it is an issue that excessive SO3- adsorbed on the Pt surface may poison the catalyst. The adsorption of ionomer on the carbon support is usually controlled by the surface chemical composition, the state of charge, and the functional groups on the carbon support [113,124]. Kim's group proved that the interaction between ionomer and catalyst is highly affected by the type of ionomers using MD and DFT simulations as well as single full tests. These different interactions lead to various ionomer aggregations and pore structures in the CL, thus affecting the kinetics and mass transport of PEMFCs [7]. Li and co-workers found that the catalyst particle size is related to the interactions between Nafion ionomer and catalysts. Catalyst clusters with small sizes in the catalyst ink absorb more Nafion, creating larger electrostatic forces between clusters, thus forming a cross-linked network structure, which is beneficial for inhibiting agglomeration and improving ink stability [51]. Tokumasu studied the relationship between the equivalent weight (EW) of ionomer and ionomer adsorption with the assistance of MD simulations. They found that a low EW ionomer and a water-rich alcohol solvent contribute to higher ionomer coverage on the graphite surface. Moreover, a high electrostatic repulsive interaction between the ~SO3- group on the ionomer side chain and the negatively charged functional groups on the support can decrease ionomer absorption [125]. Meanwhile, studies have claimed that size cluster aggregation relies on the ionomer adsorption by Pt/C catalysts in high-solidity catalyst inks, where steric and electrostatic repulsion effects may limit the Pt/C cluster aggregation process [10].
What is more, the solvent/catalyst particle interactions have a great effect on the distribution, size, and structure of particle cluster agglomerates in catalyst ink [126,127]. The most important factors include the dielectric constant, viscosity, and boiling point of the solvent. The particle aggregation process and solvent effects in aqueous and non-aqueous solvents were investigated by the Secanell group. The results indicated that a solvent with a high dielectric constant and low ionic concentration contributes to forming large catalyst particle agglomerates and more stable catalyst ink [95]. Jinnouchi reported that in solvents with high polarity, Pt/C particles absorb a large number of amphiphilic ionomers, causing the formation of small particle aggregate particles with a size around 200 nm. As the solvent polarity decreases, a number of ionomers desorb from the catalyst particles, resulting in weaker interactions between aggregates and solvent and forming larger agglomerates [120,128].
Although there are only three main components in a catalyst ink, the order of solvent, catalyst, and ionomer mixing has a significant influence on the agglomerates and stability of the inks by affecting the interaction sequence of different components [117]. However, only a few studies have focused on this key process. There are three main types of component mixing orders. One sequence involves directly mixing the ionomer dispersion with the solvent (such as water/IPA) before adding the catalyst [129,130]. The interaction between the ionomer and solvent can uniformly disperse the ionomer in the solvent, leading to a relatively uniform ionomer coverage on the catalyst. Another sequence is mixing the ionomer and catalyst particles, followed by adding the solvent. A drawback of this sequence is that the carbon support is susceptible to degradation by combustion reactions, leading to a decrease in catalyst activity. To address this issue, it is suggested to add a few drops of water to the catalyst before the mixing procedure. The third sequence involves pre-mixing the solvent and catalyst, then adding the ionomer dispersion solution. It has been found that smaller agglomerates and a more viscous ink are achieved using the third mixing order. Therefore, it is crucial to pay attention to the order of component mixing.
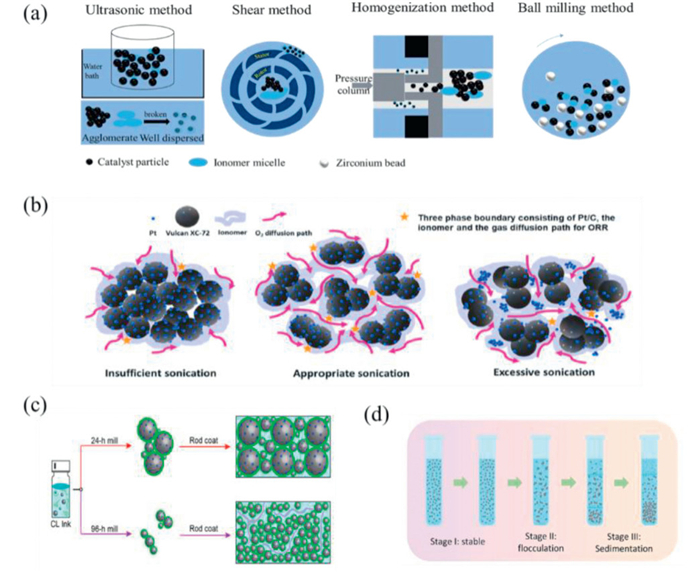
The dispersion method is another important process in preparing a designed catalyst ink [130,131]. Catalyst particles and ionomers would exist as large agglomerates in the solvent separately, with very weak interactions, before dispersion treatment. Therefore, a further mixing step is essential for enhancing the interactions between particles and ionomers, which is crucial for improving the performance of the catalyst layer. Up to now, ultrasonication, ball milling, high-speed shearing, and homogenization are common dispersion methods (Fig. 5a) [24,129,132,133]. Typically, ultrasonication and ball milling are widely used in lab and industrial manufacturing, suitable for low viscosity (or low solid concentration) and high viscosity (or high solid concentration), respectively. The key parameters for ultrasonic dispersion include the power of the ultrasound, the duration of treatment, and the temperature. Wang studied the effects of ultrasonic dispersing parameters on the ink microstructure and found that an appropriate dispersion process and time could form a homogeneous catalyst ink by breaking up large agglomerates into smaller ones (Fig. 5b) [24,50]. However, if the dispersion process is insufficient, larger agglomerates could remain in the catalyst ink, with fewer ionomers permeating into the inner particles within the large agglomerates and a thick ionomer layer outside the large catalyst agglomerates, leading to high proton transport resistance and reduced Pt utilization [2,134,135]. Furthermore, the limited access of inner Pt particles to ionomers may result in high mass transfer resistance and poor performance. For mass production of PEMFC, direct coating methods combined with heat transfer processes are usually employed, necessitating a high solids content and viscous ink [36,136]. Therefore, the ball milling method, using metal balls, ceramics, or other grinding media mixed with catalyst inks, is often adopted for this type of ink due to its effectiveness at dispersing concentrated catalyst inks. There are many adjustable parameters for ball milling dispersion, including the size of the ball milling beads, the ratio of bead volume to ink volume, the duration of ball milling, the temperature of ball milling, and the processing volume of the ink. Ink properties, including viscosity, particle size, Zeta potential, and rheology, are usually studied to control the quality and reproducibility of catalyst inks. The final viscosity of the catalyst ink is not only affected by the size and properties of the catalyst particles and the properties of the solvent, but also related to the solid content and the dispersion method. Usually, the higher the solid content, the greater the viscosity; the longer the dispersion time and the higher the amount of dispersion energy applied, the greater the viscosity will be as well. Typically, the relative magnitude of storage (G') and loss (G'') modulu is generally used to describe the rheological properties [137,138]. The inks exhibit a gel-like behavior when G' > G'', while the inks tend to behave as a solution when G' < G''. Moreover, the particle size is nearly directly proportional to ball milling time (Fig. 5c) [139]. However, more complex cracks could form due to differences in particle size distribution in the CL inks with excessive ball milling [140]. The stability of catalyst ink refers to the consistency of the catalyst ink over time [97,141,142]. The evolution of catalyst ink can be divided into three stages: Stable, flocculation, and sedimentation (Fig. 5d) [8]. A highly stable ink should maintain its initial, well-dispersed state as long as possible. With the extension of time, the inks will inevitably undergo flocculation and sedimentation due to the decreasing repulsive forces between growing particles. Many factors can affect stability, such as the properties of the solvent, the types and contents of ionomers, as well as the structure of the carbon support, and so on [143]. Importantly, the interactions between multi-component systems mainly determine the ink stability. Thus, ink stability can be improved by regulating the micro- and nanoscale interactions among particles, ionomers, and solvents in the inks [144].
In terms of the electrostatic repulsive force between particles in simple ink systems, the Derjaguin-Landau-Verwey-Overbeek (DLVO) theory is often used to describe stability, which can take into account van der Waals forces and electrostatic repulsive forces (Figs. 4d and e) [145,146]. In addition, steric hindrance and hydrophobic interactions from the particle-ionomer network have been regarded as other common stabilization mechanisms [8,147]. Besides, ink degradation resulting from environmental and other influencing factors should also be considered to regulate ink stability. For example, after long periods of standing, the degradation of alcohols induced by Pt has been found and tested, which can destroy the ink structure and lead to an uneven catalyst layer. Above all, attention should be paid to ink stabilization to enhance the quality and applicability of catalyst ink.
The catalyst layer is the main active area where electrochemical reactions occur, and it is typically composed of carbon-supported precious metal catalysts, ionomers, and multi-scale void regions [127,148,149]. Much attention has been paid to the structure of the CL, as it largely determines the performance of PEMFCs. The ionomer distribution, multi-stage pore structure, and thickness of the CL, as well as cracks are the main structural factors for evaluating a CL, which may be affected by material specifications, catalyst ink ingredients, catalyst ink properties, CL fabrication techniques, and the drying process [150–154]. As shown in Fig. 6a, the catalyst layer is tightly attached to the proton exchange membrane (PEM) and the gas diffusion layer (GDL), in which the interface morphology of CL-GDL and CL-PEM directly affects the electron conduction impedance and proton conductive resistance, respectively [30,128,155]. The ionomer covers the surface of the catalyst particle aggregate, serving as a binder, proton conduction pathway, and oxygen transmission channel by forming a strongly connected network. Furthermore, the oxygen mass transfer resistance across the ionomer consists of three parts in series: The resistance at the gas/ionomer interface (R_I/gas), the resistance at the ionomer/Pt interface (R_I/Pt), and the resistance of the bulk ionomer (R_I). Thus, reducing the ionomer thickness and content can effectively reduce the total oxygen transport resistance (Fig. 6b) [156]. However, much lower ionomer content may cause insufficient integrity between different catalyst particles, thus reducing the connectivity of the proton transport network.
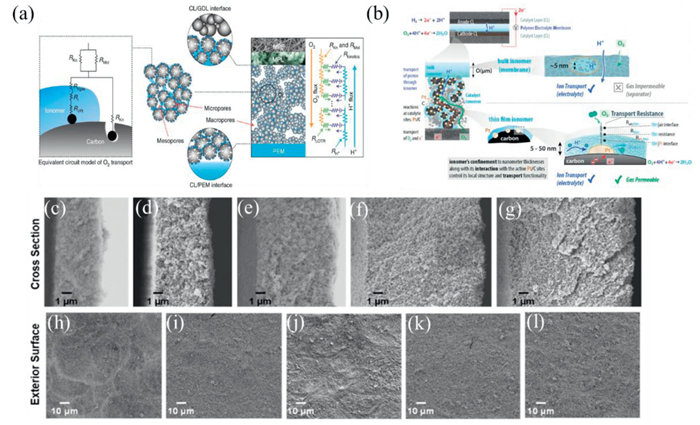
The pore size and distribution is another important structural factor that should be designed, as the void regions are responsible for oxygen transport and the removal of water [6,55,151,157,158]. Typically, there are micropores (< 2 nm), mesopores (2–20 nm), and macropores (> 20 nm) in a catalyst layer [159,160]. Micropores in the carbon substrate should be avoided since the lack of connection between the ionomer and Pt particles within the micropores can hinder effective transport [54,161]. An appreciable amount of macropores is recommended, as too few macropores are disadvantageous for water management, while an excess of macropores may restrict proton transport along the ionomer network. A large amount of mesopores within the carbon substrate is suggested. Recent research has indicated that oxygen can easily diffuse to the surface of Pt within the mesopores of the carbon substrate, and mesopores can limit the direct adsorption of ionomer on Pt. At the same time, the pore depth and tortuosity should not be too large, otherwise, it will increase the oxygen penetration resistance, thereby lowering the noble Pt utilization. Additionally, too many mesopores may cause the degradation of the carbon substrate. Simultaneously, it is best for the ionomer and catalyst to be in close proximity without direct contact, to minimize the poisoning of the catalyst by the ionomer (Fig. 7a). And reducing the amount of Pt (platinum) will lower the cost, but it will also increase the resistance to oxygen transport and decrease the overall performance (Fig. 7b). Therefore, the design of the pore structure and Pt loading is crucial for regulating the performance of PEMFCs and improving the Pt utilization.

The thickness of the CL is also important, as thicker layers can lead to higher costs of catalyst materials, while thinner layers tend to conserve the Pt catalyst [9,162,163]. What is more, the interactions between CL thickness and porosity, which can affect oxygen transport limitations, have also been reported. Firstly, a limiting thickness of the CL has been found to be 7.5 µm for the cathode to meet the requirement of a crack-free and uniform morphological surface (Figs. 6c-l) [151]. Secondly, porosity increases with decreasing CL thickness, and this increased porosity can result in a decrease in oxygen transport resistance for thinner CLs (Fig. 7c), without causing a reduction in charge transfer resistance for the oxygen reduction reaction [164,165]. Therefore, the balance between the solid phase network and void regions should be considered when designing a CL structure.
Cracks are another important factor to evaluate the quality of a MEA. During the preparation process of the catalyst layer, the non-uniform interactions between Pt/C particles, ionomers, and solvents in the catalyst ink can lead to the formation of agglomerates and bubbles. These defects are prone to stress concentration, which can trigger the formation of cracks [25]. Besides, during the drying process, the evaporation of the solvent leads to an increase in the capillary forces between the particles. When this tensile stress exceeds the inherent strength of the porous catalyst layer, the energy is released, thereby forming cracks [166]. The impact of catalyst layer cracks on fuel cell performance is highly complex. On one hand, appropriate cracks can serve as pathways for water transport, enhancing the drainage capability of the catalyst layer, while also improving the pathways for oxygen transport. On the other hand, excessive cracks can increase the resistance to electron and proton transport within the catalyst layer, leading to higher ohmic losses. Moreover, areas with cracks are prone to water accumulation, which may cause swelling or damage to the proton exchange membrane, thereby accelerating the degradation of the membrane electrode [167].
Overall, the impact of cracks on the performance of the catalyst layer depends on the density, morphology of the cracks, as well as the operating conditions of the fuel cell. When designing and fabricating the catalyst layer, it is necessary to take into account the mechanisms of crack formation and control methods in order to optimize the performance and durability of the fuel cell.
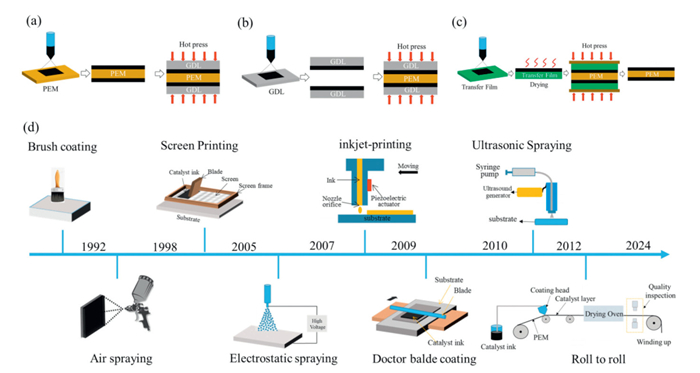
Constructing a catalyst layer with high performance and high Pt utilization is a key step in fabricating a MEA [3,34,168]. An MEA can be divided into three categories based on the substrates: Where inks can be deposited onto gas diffusion electrodes (GDEs) to form gas diffusion electrodes, or inks can also be directly coated onto PEMs to form catalyst-coated membranes (CCMs), whereas in some processes, inks are deposited onto a transfer substrate and then transferred onto the membrane by hot pressing (Figs. 8a-c). Thus, the catalyst ink properties must match the CL technology. The history and development of CL technology are shown in Fig. 8d. Up to now, ultrasonic spraying [35,169], doctor blade coating [170,171], and roll-to-roll slot die coating [172,173] have been the most used methods. From the perspective of practical application, we will focus on these three process technologies.
Ultrasonic spraying is the most commonly used method, as it can ensure the consistency and uniformity of the CL, especially in laboratories.The downside of ultrasonic spraying is its slow production rate, making it unsuitable for production line applications [174,175]. It is typically suitable for low solid content catalyst inks with a value < 1 wt%. The mechanism of ultrasonic spraying depends on the ultrasonic atomization technique, which breaks down the catalyst ink drops into uniform micron-sized droplets, forming a fine mist (Figs. 9a-c) [176]. During the ultrasonic spraying process, the catalyst ink is usually injected into the ultrasonic nozzle by an adjustable-speed injection pump. The catalyst ink mist is then sprayed onto the PEM or GDL substrate, followed by heating to form a thin catalyst layer [150]. A tailored catalyst layer is obtained through layered spraying. The thickness, structure, and morphology of the catalyst are affected by ink properties and ultrasonic spraying parameters, including ink composition, solid content, ink viscosity, aggregate size, solvent boiling point, heating temperature, spray rate, and spray width (Figs. 9d and e) [177,178].
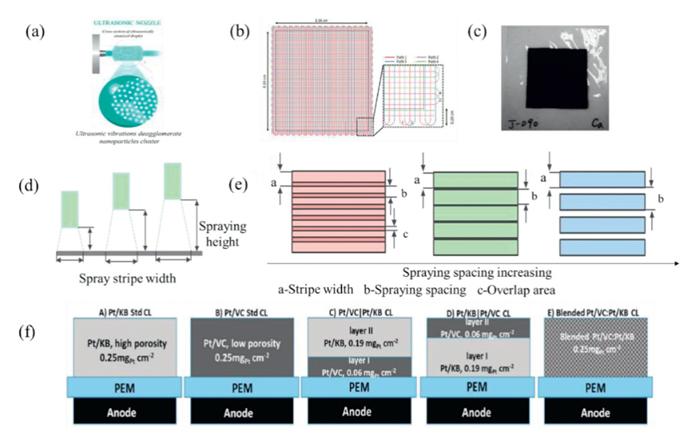
This method is effective for fabricating a gradient catalytic layer by simply changing the ink for each layer [179]. For example, a double-layer cathode catalyst layer with two commercial platinum catalysts was designed and achieved using the ultrasonic spray method (Fig. 9f) [174]. This type of dual-layer catalyst layer structure has been proven to enhance the maximum fuel cell power density. Huang and co-workers fabricated a CCM with an ultra-low Pt loading (0.272 mgPt/cm2) using the ultrasonic spray method. They found that lower Pt loadings correspond better with lower Nafion contents by investigating different cathode Pt loadings and various Nafion contents [34]. Su discussed the use of ultrasonic spray for producing high-temperature MEAs with low Pt loadings and demonstrated high fuel cell performance and cathode mass power density for high-temperature fuel cells with air as the cathode inlet gas and ambient pressure [169]. Most high-performance MEAs with newly fabricated catalysts in laboratories have been achieved using the ultrasonic spray method [180–182].
The doctor blade coating method is a highly effective method for fabricating CLs with high solid content catalyst inks [36,170]. In the process of doctor blade coating, the catalyst ink is poured in front of the scraper, then the scraper continuously moves and pushes the viscous ink to form a uniform CL [171,183]. Typically, the thickness of the CL is determined by the gap between the scraper and substrate, as well as the solid content of the catalyst ink [184]. The temperature of the substrate is an important factor affecting the structure of the CL. The wet thickness of the CL is nearly equal to the gap between the scraper and substrate, while the final dry thickness of the CL is determined by the solid content and solvent evaporation. The doctor blade coating method is suitable for high solid content and high viscosity catalyst inks, whereas low viscosity catalyst inks can spill [26]. Wu proposed a new doctor blade coating method for fabricating fuel cell catalyst layers and studied the stability and reproducibility of the coating process through experiments and systematic data analysis [170]. Park used the doctor blade method to fabricate an MEA by directly coating the catalyst ink onto a pre-swollen proton exchange membrane. The swelling process of the membrane and the drying process of the catalyst layer have been deeply studied by investigating various swelling agents with different boiling points. It was proven that using EG as the pre-swelling agent results in good fuel cell performance when directly coating the catalyst ink onto pre-swollen membranes via a doctor blade method. The doctor blade method is also an effective step for fabricating a CL via a decal transfer. First, the catalyst ink is spread onto a transfer membrane to form the cathode catalyst layer. Second, the CL is transferred to the surface of the proton exchange membrane via hot-pressing to form a CCM, as reported in the literature [26]. The relationship between drying temperature and CL structure is crucial for achieving a designed CL. It has been found that high drying temperatures help form loose and porous CLs, while low temperatures promote the formation of dense CLs, due to differences in evaporation rates between alcohol and water [36]. The drying atmosphere can also affect the evaporation of the solvent. However, the cost of implementing these methods in industry is currently high, and they are still in the laboratory research and development phase. The doctor blade coating combined with a hot-pressing process has been widely used for laboratory-scale decal transfers.
To meet the demand for mass production of CLs, a roll-to-roll (R2R) combined with slot die coating (SDC) method has been proposed [172,173]. The mechanism is similar to doctor blade coating, where the catalyst ink is pumped into the feed slot and coated onto a membrane or decal transfer sheet, followed by a drying step. The R2R coating process can be categorized into double-side direct coating and single-side direct coating in terms of different catalyst layer. In double-sided direct coating, both the cathode catalyst layer and the anode catalyst layer are directly coated onto the PEM, which may lead to the swelling. At the current stage, achieving double-sided direct coating is still quite challenging. Single-sided direct coating is relatively more mature, especially the combination of anode direct coating and cathode transfer printing, which can effectively address the issue of membrane swelling [185,186].
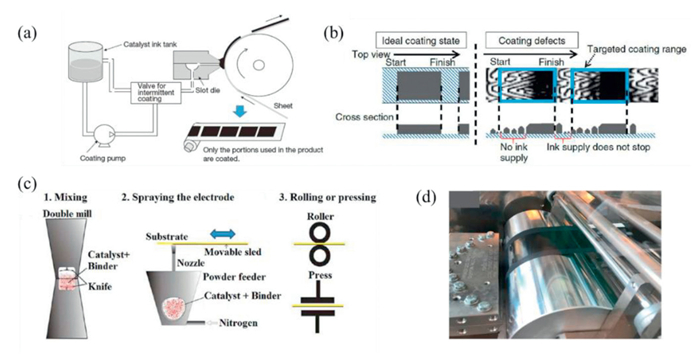
Toyota Motor Corporation put forward an intermittent R2R-SDC method to produce the CCM for MIRAI fuel cell vehicles, aiming to save Pt catalyst, in 2016 (Fig. 10a) [4]. The biggest challenge of this R2R method is still the stable control of the coating start and finish times (Fig. 10b). The quality of the CL fabricated by the R2R-SDC method is controlled by the coating and drying processes [187]. It has been established that the coating parameters, including the tape speed, die width, gap between the slot die lips and substrate, as well as ink properties, together determine the wet CL thickness. Mauger proposed a gravure coating as a relevant technology for the synthesis of R2R CLs, which is able to coat multi-meter lengths of CLs at industrially relevant Pt loadings. The gravure coated CLs show a more uniform thickness and larger pore sizes compared to spray-coated CLs [41]. Bodner studied the suitability of R2R-SDC by deeply comparing the CLs' performance in terms of homogeneity, reproducibility, and durability, in which the CLs were manufactured by the slot-die process, spraying, and tape coating methods, respectively. These studies indicated that R2R-SDC is suitable for large-scale industrial catalyst layer production [173]. Talukdar presented a new dry-spraying method by coating solvent-free catalyst powder mixture onto PEM via a hot R2R method (Fig. 10c). Better fuel cell performance was achieved by ensuring a better ionomer distribution throughout the catalyst layer [188]. What is more, the R2R coated method can also be applied to the fabrication of gas-diffusion electrodes (GDEs) (Fig. 10d) [176]. The effect of coating process conditions and drying parameters on the ionomer distribution has been studied. The surface ionomer concentration on GDEs obtained by the R2R method was higher than that of the spray method, which is beneficial for large-scale MEA manufacturing for fuel cells by simplifying the process [176]. Up to now, R2R-SDC is the most promising industrial-scale method to meet the demand for manufacturing speed. However, not all catalyst ink systems are suitable for this process. To speed up the transformation of research achievements from the laboratory to industrial production, it is necessary to pay more attention to CL synthesis methods.
Developing advanced characterization techniques for catalyst layers is important to accurately analyze the microstructure of CLs and to deeply understand the structure-function relationship, thus providing reliable guidance for CL structure design and manufacturing methods [149,154,189]. Scanning electron microscopy (SEM) is the most used technology to characterize the surface and cross-section of CLs, providing information on cracks and layer thickness, respectively (Figs. 11a and b) [25,190,191]. Scanning transmission electron microscopy with energy-dispersive X-ray spectroscopy (STEM/EDS) is a powerful imaging technique for establishing elemental mapping throughout the CL. The elemental maps can also provide information on changes in the catalyst and ionomer by tracking the distribution of specific species [39]. Besides, X-ray photoelectron spectroscopy (XPS), X-ray absorption near-edge structure (XANES), X-ray absorption spectroscopy (XAS), and other chemical mapping technologies have been applied to characterize catalyst layer changes in terms of catalyst degradation and redistribution and the dissociation of ionomers. Even minor changes in the CL structure can significantly affect the performance and stability of PEMFCs. One of the biggest challenges in characterizing CL morphology is the accurate identification of the ionomer network due to limitations in instrument precision, the inability to characterize multi-scale structural information simultaneously, and data analysis [41,42,192]. Cetinbas successfully characterized the 3-D agglomerate microstructure with high resolution up to 1 nm using nano-scale resolution X-ray computed tomography (nano-CT) techniques.
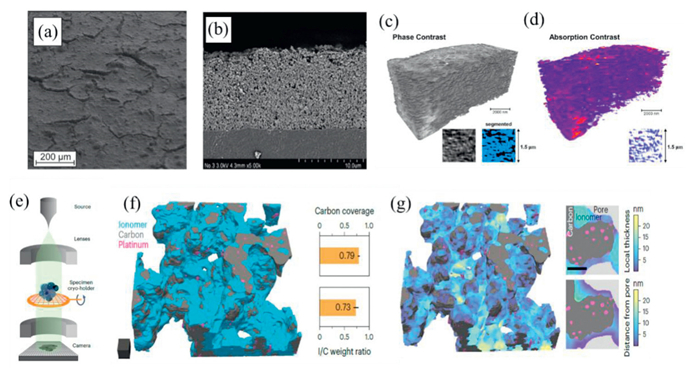
A strong correlation between the ionomer membrane thickness and I/C ratio was established using three-dimensional hybrid reconstruction methods. They also demonstrated that segmented phase contrast images combined with absorption contrast data can provide information on both secondary pores and local ionomer volume fraction (Figs. 11c and d) [41]. Recently, a three-dimensional visualization technology has been developed using deep-learning-aided cryogenic transmission electron tomography for image restoration, achieving imaging of the ionomer morphology, coverage, and three-dimensional network, as well as the location of the catalyst in the CL. The workflow and analysis of the CL are shown in Figs. 11e-g. The sample preparation was quite different from the normal liquid phase ultrasonic dispersion process. The TEM grids were placed onto the stripes of the CL to transfer enough powder samples. Another method involved ultramicrotomy to create a thin sample layer with a thickness of around 100–150 nm. Furthermore, advanced three-dimensional imaging methods were explored for quantitative measurements of all components of the CL. This new methodology for characterizing the fine structure of the CL enables the establishment of a link between CL morphology and fuel cell performance [44]. In the future, multi-scale, multi-technique characterization approaches will be developed to meet the demands of more refined catalytic layer structures.
(1) Proton exchange membrane fuel cells, featured with high power output and environmental friendliness, have garnered significant attention to serve as a new energy solution, especially in the field of transportation. With demands for high reliability and outstanding performance, many efforts have been made in the manufacturing and optimization of the MEA. The catalyst ink composition and the relationships between its components directly affect the CL structure and performance. Thus, the catalyst ink formulation and technology are usually the core secrets of a company. In order to obtain a crack-free CL and to achieve the designed CL structure, various CL formation methods have been developed. Ultrasonic spraying is the most commonly used method in laboratories, while the R2R-SDC method can meet the requirements of production cycle times. The ink properties and process parameters determine the CL structure, such as thickness, pore size and distribution, ionomer coverage, and other important structural factors. To establish the relationship between structure and performance, a key step is to meticulously characterize the CL structure. Up to now, many advanced characterization techniques have been developed to capture the 3D ionomer network information and the catalyst location simultaneously, such as nano-CT and electron tomography acquisition techniques. Although significant progress has been made in recent years regarding the manufacturing of catalyst inks and MEAs, as well as the study of interaction mechanisms, there remains a substantial journey ahead with many challenges within the field.
(2) From the perspective of catalyst ink preparation, with the development of new materials and the demand for technology iteration, new technologies should be developed to accelerate the process of catalyst ink trial and error development, such as AI-assisted design based on Big Data. Moreover, greater attention should be paid to the stability of the catalyst ink. It is challenging to achieve real-time preparation and usage, as it often requires dealing with a large quantity of catalyst ink in practical applications.
(3) In order to reduce the cost of the catalyst layer and improve the overall fuel cell output performance, ultrathin and new-structure CLs should be designed. And, aiming to precisely control the formation of CL morphology, it is important to deeply study the CL fabrication process, especially the drying mechanism, thus regulating the multi-pore structure and ionomer 3D networks of the CL. The CL manufacturing process should be upgraded based on the drying mechanism of the solvent in the catalyst ink.
(4) The ionomer distribution and thickness on catalyst aggregates play an important role in regulating the mass transport resistance and proton conduction of the CL. However, it is hard to accurately characterize the three-dimensional network structure of ionomers due to the limitations of characterization techniques. Therefore, it is necessary to develop advanced multiple characterization methods to obtain the structural information of the CL.
(5) To meet commercial needs, it is necessary to narrow the gap between laboratory research and industrial production. There are thousands of new catalysts with high performance and great durability; however, Pt/C or a few types of PtCo/C remain the first choice for fuel cell cathodes. There is still a long way to go to understand the reasons and solve the engineering problems.
Linghai Han: Writing – original draft. Xue Gong: Writing – original draft, Investigation, Conceptualization. Yupeng Wang: Formal analysis. Dan Wang: Writing – review & editing. Chunyu Ru: Validation. Xian Wang: Validation. Donglai Guo: Investigation. Fangbing Liu: Validation. Xia Sheng: Supervision. Junjie Ge: Supervision.
The authors declare that they have no known competing financial interests or personal relationships that could have appeared to influence the work reported in this paper.
This work was supported by Changchun City, Jilin Province Major Science and Technology Special Project (Nos. 20230301109ZD, 20230301107ZD), National Key Research and Development Program (No. 2022YFB2502400).
Y. Komoda, K. Okabayashi, H. Nishimura, et al., J. Power Sources 193 (2009) 488–494. doi: 10.1016/j.jpowsour.2009.04.015
D.K. Murugaiah, S. Shahgaldi, Int. J. Hydrogen Energy 66 (2024) 156–169. doi: 10.1016/j.ijhydene.2024.04.036
B. Millington, V. Whipple, B.G. Pollet, J. Power Sources 196 (2011) 8500–8508. doi: 10.1016/j.jpowsour.2011.06.024
Y. Nonobe, IEEJ Trans. Electr. Electron. Eng. 12 (2016) 5–9.
S. Aso, SAE Int. J. Engines 1 (2008) 296–303. doi: 10.4271/2008-01-0420
J. Zhao, H. Liu, X. Li, Electrochem. Energ. Rev. 6 (2023) 13. doi: 10.1007/s41918-022-00175-1
Y. Zhang, Z. Gao, L. Wei, J. Su, J. Electrochem. Soc. 170 (2023) 054508. doi: 10.1149/1945-7111/acd583
G. Liu, D. McLaughlin, S. Thiele, C. Van Pham, Chem. Eng. J. 460 (2023) 141757. doi: 10.1016/j.cej.2023.141757
W. Olbrich, T. Kadyk, U. Sauter, M. Eikerling, J. Gostick, Sci. Rep. 13 (2023) 14127. doi: 10.1038/s41598-023-40637-0
N. Kumano, K. Kudo, Y. Akimoto, M. Ishii, H. Nakamura, Carbon 169 (2020) 429–439. doi: 10.1016/j.carbon.2020.07.047
R. Jinnouchi, K. Kudo, K. Kodama, et al., Nat. Commun. 12 (2021) 4956. doi: 10.1038/s41467-021-25301-3
J.H. Park, M.S. Shin, J.S. Park, Electrochim. Acta 391 (2021) 138971. doi: 10.1016/j.electacta.2021.138971
S.A. Berlinger, S. Garg, A.Z. Weber, Curr. Opin. Electrochem. 29 (2021) 100744. doi: 10.1016/j.coelec.2021.100744
C. Lei, F. Yang, N. Macauley, et al., J. Electrochem. Soc. 168 (2021) 044517. doi: 10.1149/1945-7111/abf2b0
H. Liu, L. Ney, N. Zamel, X. Li, Appl. Sci. 12 (2022) 3776. doi: 10.3390/app12083776
C.M. Johnston, K.S. Lee, T. Rockward, et al., ECS Trans. 25 (2009) 1617. doi: 10.1149/1.3210717
D.C. Huang, P.J. Yu, F.J. Liu, et al., Int. J. Electrochem. Sci. 6 (2011) 2551–2565. doi: 10.1016/S1452-3981(23)18202-2
T.T. Ngo, T.L. Yu, H.L. Lin, J Power Sources 225 (2013) 293–303. doi: 10.1016/j.jpowsour.2012.10.055
A. Orfanidi, P.J. Rheinländer, N. Schulte, H.A. Gasteiger, J. Electrochem. Soc. 165 (2018) F1254–F1263. doi: 10.1149/2.1251814jes
F. Yang, L. Xin, A. Uzunoglu, et al., ECS Trans. 75 (2016) 361. doi: 10.1149/07514.0361ecst
Y. Guo, D. Yang, B. Li, et al., ACS Appl. Mater. Interfaces 13 (2021) 27119–27128. doi: 10.1021/acsami.1c07070
S.A. Berlinger, B.D. McCloskey, A.Z. Weber, ECS Trans. 80 (2017) 309. doi: 10.1149/08008.0309ecst
M.B. Dixit, B.A. Harkey, F. Shen, K.B. Hatzell, J. Electrochem. Soc. 165 (2018) F264–F271. doi: 10.1149/2.0191805jes
M. Wang, J.H. Park, S. Kabir, et al., ACS Appl. Energy Mater. 2 (2019) 6417–6427. doi: 10.1021/acsaem.9b01037
N. Kumano, K. Kudo, A. Suda, et al., J. Power Sources 419 (2019) 219–228. doi: 10.1016/j.jpowsour.2019.02.058
S. Liu, S. Li, R. Wang, et al., J. Electrochem. Soc. 166 (2019) F1308–F1313. doi: 10.1149/2.0151916jes
A. Ganesan, M. Narayanasamy, Mater. Renew. Sustain. Energy 8 (2019) 18. doi: 10.1007/s40243-019-0156-x
D. Banham, J. Zou, S. Mukerjee, et al., J. Power Sources 490 (2021) 229515. doi: 10.1016/j.jpowsour.2021.229515
H. Tang, K. Geng, D. Aili, et al., Nat. Commun. 13 (2022) 7577. doi: 10.1038/s41467-022-34489-x
J. Fan, M. Chen, Z. Zhao, et al., Nat. Energy 6 (2021) 475–486. doi: 10.1038/s41560-021-00824-7
D.A. Blom, J.R. Dunlap, T.A. Nolan, L.F. Allard, J. Electrochem. Soc. 150 (2003) A414–A418. doi: 10.1149/1.1556593
H. Iden, A. Ohma, J. Electroanal. Chem. 693 (2013) 34–41. doi: 10.1016/j.jelechem.2013.01.026
D.A. Cullen, R. Koestner, R.S. Kukreja, et al., J. Electrochem. Soc. 161 (2014) F1111–F1117. doi: 10.1149/2.1091410jes
T.H. Huang, H.L. Shen, T.C. Jao, F.B. Weng, A. Su, Int. J. Hydrogen Energy 37 (2012) 13872–13879. doi: 10.1016/j.ijhydene.2012.04.108
T.C. Jao, G.B. Jung, H.L. Shen, C.C. Yeh, Y.J. Su, Open J. Acoustics 03 (2013) 33–37. doi: 10.4236/oja.2013.33A006
P. Yang, J. Huang, J. Li, et al., Int. J. Hydrogen Energy 52 (2024) 170–176. doi: 10.1016/j.ijhydene.2023.10.108
Y. Guo, T. Mabuchi, G. Li, T. Tokumasu, Surf. Interf. 44 (2024) 103731. doi: 10.1016/j.surfin.2023.103731
F.L. Deschamps, J.G. Mahy, A.F. Léonard, et al., Thin Solid Film 695 (2020) 137751. doi: 10.1016/j.tsf.2019.137751
S.F. Zaccarine, M. Shviro, J.N. Weker, et al., J. Electrochem. Soc. 169 (2022) 064502. doi: 10.1149/1945-7111/ac7258
M.P. Arcot, M. Cronin, M. Fowler, M. Pritzker, Electrochem 4 (2023) 1–20. doi: 10.3390/electrochem4010001
F.C. Cetinbas, R.K. Ahluwalia, N.N. Kariuki, D.J. Myers, J. Electrochem. Soc. 165 (2018) F1051–F1058. doi: 10.1149/2.0571813jes
S.A. Berlinger, P.J. Dudenas, A. Bird, et al., ACS Appl. Polym. Mater. 2 (2020) 5824–5834. doi: 10.1021/acsapm.0c01076
J.T. Lang, D. Kulkarni, C.W. Foster, et al., Chem. Rev. 123 (2023) 9880–9914. doi: 10.1021/acs.chemrev.2c00873
R. Girod, T. Lazaridis, H.A. Gasteiger, V. Tileli, Nat. Catal. 6 (2023) 383–391. doi: 10.1038/s41929-023-00947-y
H. Song, X. Shao, H. Zhang, et al., Int. J. Hydrogen Energy 67 (2024) 282–293. doi: 10.1016/j.ijhydene.2024.04.115
S.J. Normile, I.V. Zenyuk, Solid State Ionics 335 (2019) 38–46. doi: 10.1016/j.ssi.2019.02.017
J. Schwartz, Z.W. Di, Y. Jiang, et al., Nat. Commun. 15 (2024) 3555. doi: 10.1038/s41467-024-47558-0
H. Schulenburg, B. Schwanitz, N. Linse, et al., J. Phys. Chem. C 115 (2011) 14236–14243. doi: 10.1021/jp203016u
Y. Guo, F. Pan, W. Chen, et al., Electrochem. Energy R 4 (2020) 67–100.
R. Balu, N.R. Choudhury, J.P. Mata, et al., ACS Appl. Mater. Interfaces 11 (2019) 9934–9946. doi: 10.1021/acsami.8b20645
Y. Xie, Y. Guo, D. Yang, et al., ACS Appl. Mater. Interfaces 15 (2023) 19459–19469. doi: 10.1021/acsami.3c01943
M. Ma, L. Shen, Z. Zhao, et al., eScience 4 (2024) 100254. doi: 10.1016/j.esci.2024.100254
J. Hou, M. Yang, C. Ke, et al., EnergyChem 2 (2020) 10023.
Y. Sun, S. Polani, F. Luo, et al., Nat. Commun. 12 (2021) 5984. doi: 10.1038/s41467-021-25911-x
M.N. Islam, A.B. Mansoor Basha, et al., Nat. Commun. 13 (2022) 6157. doi: 10.1038/s41467-022-33892-8
F. Sun, R. Su, Y. Zhou, et al., ACS Appl. Mater. Interfaces 14 (2022) 41079–41085. doi: 10.1021/acsami.2c11910
M. Laurent-Brocq, N. Job, D. Eskenazi, J.J. Pireaux, Appl. Catal. B: Environ. 147 (2014) 453–463. doi: 10.1016/j.apcatb.2013.06.021
N. Konno, S. Mizuno, H. Nakaji, Y. Ishikawa, SAE Int. J. Alt. Power. 4 (2015) 123–129. doi: 10.4271/2015-01-1175
T. Suzuki, ECS Trans. 75 (2016) 423–434. doi: 10.1149/07514.0423ecst
T. Yoshizumi, H. Kubo, M. Okumura, Development of High-Performance FC Stack for the New MIRAI, SAE Technical Paper Series, 2021.
W.J. Lee, S. Bera, H.J. Woo, W. Hong, et al., Chem. Eng. J. 442 (2022) 136123. doi: 10.1016/j.cej.2022.136123
Z.P. Wu, D.T. Caracciolo, Y. Maswadeh, et al., Nat. Commun. 12 (2021) 859. doi: 10.1002/mc.23350
L. Huang, M. Wei, R. Qi, et al., Nat. Commun. 13 (2022) 6703. doi: 10.1038/s41467-022-34444-w
Q. Feng, X. Wang, M. Klingenhof, M. Heggen, P. Strasser, Angew. Chem. Int. Ed. 61 (2022) e202203728. doi: 10.1002/anie.202203728
R. Gao, J. Wang, Z.F. Huang, et al., Nat. Energy 6 (2021) 614–623. doi: 10.1038/s41560-021-00826-5
F. Xiao, Q. Wang, G.L. Xu, et al., Nat. Catal. 5 (2022) 503–512. doi: 10.1038/s41929-022-00796-1
X.L. Tian, X. Zhao, Y.Q. Su, et al., Science 366 (2019) 850–856. doi: 10.1126/science.aaw7493
W. Yan, D. Zhang, Q. Zhang, et al., J. Energy Chem. 64 (2022) 583–606. doi: 10.1016/j.jechem.2021.05.003
S.J. Hwang, S.J. Yoo, J. Shin, et al., Sci. Rep. 3 (2013) 1309. doi: 10.1038/srep01309
X. Zhao, K. Sasaki, Acc. Chem. Res. 55 (2022) 1226–1236. doi: 10.1021/acs.accounts.2c00057
J.C. Ortiz-Herrera, H. Cruz-Martínez, O. Solorza-Feria, D.I. Medina, Int. J. Hydrogen Energy 47 (2022) 30213–30224. doi: 10.1016/j.ijhydene.2022.03.218
M.O. Danilov, A.V. Melezhyk, J Power Sources 163 (2006) 376–381. doi: 10.1016/j.jpowsour.2006.08.009
B.Y. Xia, H.B. Wu, X. Wang, X.W. Lou, J. Am. Chem. Soc. 134 (2012) 13934–13937. doi: 10.1021/ja3051662
N. Jia, Q. Xu, F. Zhao, et al., ACS Appl. Energy Mater. 1 (2018) 4982–4990. doi: 10.1021/acsaem.8b00970
L. Payattikul, L. Intakhuen, T. Kiatsiriroat, K. Punyawudho, Sci. Rep. 12 (2022) 12504. doi: 10.1038/s41598-022-16742-x
S. Pérez-Rodríguez, E. Pastor, M.J. Lázaro, Int. J. Hydrogen Energy 43 (2018) 7911–7922. doi: 10.1016/j.ijhydene.2018.03.040
G. Wang, G. Sun, Q. Wang, et al., Int. J. Hydrogen Energy 35 (2010) 11245–11253. doi: 10.1016/j.ijhydene.2010.07.045
N. Macauley, D.D. Papadias, J. Fairweather, et al., J. Electrochem. Soc. 165 (2018) F3148–F3160. doi: 10.1149/2.0061806jes
L. Strandberg, V. Shokhen, M. Skoglundh, B. Wickman, ACS Catal. 14 (2024) 8494–8504. doi: 10.1021/acscatal.4c00417
T. Lazaridis, B.M. Stühmeier, H.A. Gasteiger, H.A. El-Sayed, Nat. Catal. 5 (2022) 363–373. doi: 10.1038/s41929-022-00776-5
M.K. Debe, Nature 486 (2012) 43–51. doi: 10.1038/nature11115
S. Ott, A. Orfanidi, H. Schmies, et al., Nat. Mater. 19 (2020) 77–85. doi: 10.1038/s41563-019-0487-0
H. Ren, Y. Teng, X. Meng, et al., J. Power Sources 506 (2021) 230186. doi: 10.1016/j.jpowsour.2021.230186
K. Yamada, S. Hommura, T. Shimohira, ECS Trans. 50 (2012) 1495–1501.
T. Hirai, S. Hommura, A. Watakabe, et al., ACS Appl. Energy Mater. 7 (2024) 3806–3823. doi: 10.1021/acsaem.4c00177
K. Yamada, S. Hommura, T. Shimohira, ECS Trans. 50 (2013) 1495. doi: 10.1149/05002.1495ecst
T. Suzuki, H. Tanaka, M. Hayase, S. Tsushima, S. Hirai, Int. J. Hydrogen Energy 41 (2016) 20326–20335. doi: 10.1016/j.ijhydene.2016.09.078
A. Kusoglu, A.Z. Weber, Chem. Rev. 117 (2017) 987–1104. doi: 10.1021/acs.chemrev.6b00159
A. Rolfi, C. Oldani, L. Merlo, D. Facchi, R. Ruffo, J. Power Sources 396 (2018) 95–101. doi: 10.1016/j.jpowsour.2018.05.093
A. Katzenberg, A. Chowdhury, M. Fang, et al., J. Am. Chem. Soc. 142 (2020) 3742–3752. doi: 10.1021/jacs.9b09170
S.J. Lee, T.L. Yu, H.L. Lin, W.H. Liu, C.L. Lai, Polymer 45 (2004) 2853–2862. doi: 10.1016/j.polymer.2004.01.076
R. Fernández, P. Ferreira-Aparicio, L. Daza, J. Power Sources 151 (2005) 18–24. doi: 10.1016/j.jpowsour.2005.02.048
M. Chisaka, H. Daiguji, J. Electrochem. Soc. 156 (2009) B22. doi: 10.1149/1.3000592
T.T. Ngo, T.L. Yu, H.L. Lin, J. Power Sources 238 (2013) 1–10.
S. Shukla, S. Bhattacharjee, M. Secanell, ECS Trans. 58 (2013) 1409. doi: 10.1149/05801.1409ecst
D. Yang, S. Zhu, Y. Guo, et al., ACS Omega 6 (2021) 32960–32969. doi: 10.1021/acsomega.1c05026
R. Lin, J. Lu, S. Liu, et al., Appl. Surf. Sci. 655 (2024) 159608. doi: 10.1016/j.apsusc.2024.159608
T.H. Kim, J.H. Yoo, T. Maiyalagan, S.C. Yi, Appl. Surf. Sci. 481 (2019) 777–784. doi: 10.1016/j.apsusc.2019.03.113
T.H. Kim, J.Y. Yi, C.Y. Jung, E. Jeong, S.C. Yi, Int. J. Hydrogen Energy 42 (2017) 478–485. doi: 10.1016/j.ijhydene.2016.12.015
C. Welch, A. Labouriau, R. Hjelm, et al., ACS Macro Lett. 1 (2012) 1403–1407. doi: 10.1021/mz3005204
J.H. Lee, G. Doo, S.H. Kwon, et al., Sci. Rep. 8 (2018) 10739. doi: 10.1038/s41598-018-28779-y
M. Uchida, Y. Aoyama, N. Eda, A. Ohta, J. Electrochem. Soc. 142 (1995) 463. doi: 10.1149/1.2044068
C.M. Johnston, K.S. Lee, T. Rockward, et al., ECS Trans. 25 (2009) 1617. doi: 10.1149/1.3210717
E. Hoffmann, D. Fischer, M. Thoma, et al., J. Colloid Interf. Sci. 582 (2021) 883–893. doi: 10.1016/j.jcis.2020.08.058
D. Yang, Y. Guo, H. Tang, et al., Int. J. Hydrogen Energy 46 (2021) 33300–33313. doi: 10.1016/j.ijhydene.2021.07.172
M. So, T. Ohnishi, K. Park, et al., Int. J. Hydrogen Energy 44 (2019) 28984–28995. doi: 10.1016/j.ijhydene.2019.09.012
H. Ren, X. Meng, Y. Lin, Z. Shao, Electrochim. Acta 462 (2023) 142710. doi: 10.1016/j.electacta.2023.142710
F. Chabot, J. Lee, F. Vandenberghe, et al., ACS Appl. Energy Mater. 6 (2023) 1185–1196. doi: 10.1021/acsaem.2c02384
M. Harada, S.I. Takata, H. Iwase, et al., ACS Omega 6 (2021) 15257–15263. doi: 10.1021/acsomega.1c01535
M. Bogar, Y. Yakovlev, J. Nováková, et al., Int. J. Hydrogen Energy 58 (2024) 1673–1681. doi: 10.1016/j.ijhydene.2024.01.261
A. Mufundirwa, Y. Sakurai, M. Arao, et al., Sci. Rep. 14 (2024) 2263. doi: 10.1038/s41598-024-52671-7
G. Inoue, M. Kawase, J. Power Sources 327 (2016) 1–10.
G. Inoue, T. Ohnishi, M. So, et al., J. Power Sources 439 (2019) 227060. doi: 10.1016/j.jpowsour.2019.227060
S. Woo, S. Lee, A.Z. Taning, et al., Curr. Opin. Electrochem. 21 (2020) 289–296. doi: 10.1016/j.coelec.2020.03.006
S. Bapat, C. Giehl, S. Kohsakowski, et al., Adv. Powder Technol. 32 (2021) 3845–3859. doi: 10.1016/j.apt.2021.08.030
W. Yu, Y. Xu, X. Shen, et al., Next Energy 3 (2024) 100104. doi: 10.1016/j.nxener.2024.100104
S. Shukla, S. Bhattacharjee, A.Z. Weber, M. Secanell, J. Electrochem. Soc. 164 (2017) F600–F609. doi: 10.1149/2.0961706jes
J. Peron, D. Edwards, M. Haldane, et al., J. Power Sources 196 (2011) 179–181. doi: 10.1016/j.jpowsour.2010.06.050
J.C. Jiménez-García, D.F.F. Robledo Flores, R.H. Acosta, et al., Int. J. Hydrogen Energy 52 (2024) 65–71. doi: 10.1016/j.ijhydene.2023.10.097
Y. Chen, H. Lin, J. Huo, et al., J. Colloid Interf. Sci. 671 (2024) 344–353. doi: 10.1016/j.jcis.2024.05.136
H. Cao, J. Pan, H. Zhu, et al., Adv. Sci. 8 (2021) e2101744. doi: 10.1002/advs.202101744
Q. Xue, R. Zhang, D. Yang, et al., Int. J. Hydrogen Energy 47 (2022) 23335–23347. doi: 10.1016/j.ijhydene.2022.05.122
X. Huang, Y. He, Y. Sun, et al., J. Power Sources 603 (2024) 234488. doi: 10.1016/j.jpowsour.2024.234488
S. Jiang, J. Pan, M. Deng, et al., J. Phys. Chem. C 127 (2023) 21963–21970. doi: 10.1021/acs.jpcc.3c04754
T. Mashio, A. Ohma, T. Tokumasu, Electrochim. Acta 202 (2016) 14–23. doi: 10.1016/j.electacta.2016.04.004
A.Z. Taning, S. Lee, S. Woo, et al., J. Electrochem. Soc. 168 (2021) 104506. doi: 10.1149/1945-7111/ac2c13
H. Ren, X. Meng, Y. Lin, Z. Shao, J. Energy Chem. 73 (2022) 588–598. doi: 10.1016/j.jechem.2022.06.034
S. Yoshino, M. Harada, N. Hasegawa, R. Jinnouchi, Colloid Surf. A 691 (2024) 133847. doi: 10.1016/j.colsurfa.2024.133847
S. So, K.H. Oh, J. Power Sources 561 (2023) 232664. doi: 10.1016/j.jpowsour.2023.232664
X. Lyu, J. Foster, R. Rice, et al., J. Power Sources 581 (2023) 233503. doi: 10.1016/j.jpowsour.2023.233503
H. Kuroki, K. Onishi, K. Asami, T. Yamaguchi, Ind. Eng. Chem. Res. 58 (2019) 19545–19550. doi: 10.1021/acs.iecr.9b02111
G. Chon, M. Suk, F. Jaouen, M.W. Chung, C.H. Choi, Catal. Today 359 (2021) 9–15. doi: 10.1016/j.cattod.2019.03.067
B. Li, Y. Liu, Y. Guo, et al., Int. J. Hydrogen Energy 46 (2021) 32215–32225. doi: 10.1016/j.ijhydene.2021.06.216
B.G. Pollet, S.S. Kocha, Tech. Rev. 66 (2022) 61–76. doi: 10.1595/205651321x16196162869695
B.G. Pollet, J.T.E. Goh, Electrochim. Acta 128 (2014) 292–303. doi: 10.1016/j.electacta.2013.09.160
S.H. Akella, E. D, S.S. R, A. Ahire, N.K. Mal, Sci. Rep. 8 (2018) 12082. doi: 10.1038/s41598-018-30215-0
S.H. Lee, S.H. Woo, B.J. Pak, et al., J. Power Sources 585 (2023) 233644. doi: 10.1016/j.jpowsour.2023.233644
H. Ren, X. Meng, Y. Lin, Z. Shao, J. Power Sources 517 (2022) 588–598.
C.M. Baez-Cotto, J.P. Pfeilsticker, A.O. Godoy, et al., J. Power Sources 583 (2023) 233567. doi: 10.1016/j.jpowsour.2023.233567
D. Yang, Y. Guo, H. Tang, et al., Int. J. Hydrogen Energy 47 (2022) 8956–8964. doi: 10.1016/j.ijhydene.2021.12.227
T. Kuang, J. Huang, J. Li, et al., J. Power Sources 606 (2024) 234543. doi: 10.1016/j.jpowsour.2024.234543
B. Mayerhöfer, F.D. Speck, M. Hegelheimer, et al., Int. J. Hydrogen Energy 47 (2022) 4304–4314. doi: 10.1016/j.ijhydene.2021.11.083
P. Liu, B. Li, D. Yang, C. Zhang, P. Ming, J. Power Sources 556 (2023) 232427. doi: 10.1016/j.jpowsour.2022.232427
W. Yoshimune, M. Harada, Bull. Chem. Soc. Jpn. 93 (2020) 302–307. doi: 10.1246/bcsj.20190321
S. Wang, R. Walker-Gibbons, B. Watkins, M. Flynn, M. Krishnan, Nat. Nanotechnol. 19 (2024) 485–493. doi: 10.1038/s41565-024-01621-5
A. Klaassen, F. Liu, F. Mugele, I. Siretanu, Langmuir 38 (2022) 914–926. doi: 10.1021/acs.langmuir.1c02077
J.E. Cha, W.J. Cho, J. Hwang, D.J. Seo, Y.W. Choi, W.B. Kim, Sci. Rep. 12 (2022) 14001. doi: 10.1038/s41598-022-18464-6
C. Jackson, M. Metaxas, J. Dawson, A.R. Kucernak, ACS Appl. Energy Mater. 6 (2023) 12296–12306. doi: 10.1021/acsaem.3c01987
R. Lin, H. Wang, Y. Zhu, Energy 221 (2021) 119909. doi: 10.1016/j.energy.2021.119909
M. Ma, L.X. Shen, J. Liu, et al., Rare Metals 43 (2024) 4198–4221. doi: 10.1007/s12598-024-02698-6
M.B. Sassin, Y. Garsany, R.W. Atkinson, R.M.E. Hjelm, K.E. Swider-Lyons, Int. J. Hydrogen Energy 44 (2019) 16944–16955. doi: 10.1016/j.ijhydene.2019.04.194
N. Zamel, J. Power Sources 309 (2016) 141–159. doi: 10.1016/j.jpowsour.2016.01.091
S. Liu, S. Yuan, Y. Liang, et al., Int. J. Hydrogen Energy 48 (2023) 4389–4417. doi: 10.1016/j.ijhydene.2022.10.249
Y. Xu, G. Chang, R. Fan, T. Cai, Chem. Eng. J. 451 (2023) 138924. doi: 10.1016/j.cej.2022.138924
G. Athanasaki, A. Jayakumar, A.M. Kannan, Int. J. Hydrogen Energy 48 (2023) 2294–2313. doi: 10.1016/j.ijhydene.2022.10.058
A. Kusoglu, Ionomer thin films in PEM fuel cells, in: R.A. Meyers (Ed.), Encyclopedia of Sustainability Science and Technology, Springer, New York, 2018, pp. 1–23.
R. Yu, H. Guo, H. Chen, F. Ye, Chem. Eng. Res. Des. 209 (2024) 412–424. doi: 10.1016/j.cherd.2024.08.014
H. Lv, S. Wang, Y. Sun, et al., J. Power Sources 564 (2023) 232878. doi: 10.1016/j.jpowsour.2023.232878
Z. Wang, D. Cheng, C. Chen, K. Zhou, Carbon 136 (2018) 54–62. doi: 10.3390/ijerph16010054
Y.C. Wang, W. Huang, L.Y. Wan, et al., Sci. Adv. 8 (2022) eadd8873. doi: 10.1126/sciadv.add8873
X. Deng, C. Huang, X. Pei, B. Hu, W. Zhou, Int. J. Hydrogen Energy 47 (2022) 1529–1542. doi: 10.1016/j.ijhydene.2021.10.141
L. Xia, M. Ni, Q. Xu, H. Xu, K. Zheng, Appl. Energy 294 (2021) 117012. doi: 10.1016/j.apenergy.2021.117012
L. Royer, J. Guehl, M. Zilbermann, et al., Electrochim. Acta 446 (2023) 141981. doi: 10.1016/j.electacta.2023.141981
M. Darab, A.O. Barnett, G. Lindbergh, M.S. Thomassen, S. Sunde, Electrochim. Acta 232 (2017) 505–516. doi: 10.1016/j.electacta.2017.02.101
P. Schneider, M. Batool, A.O. Godoy, et al., J. Electrochem. Soc. 170 (2023) 024506. doi: 10.1149/1945-7111/acb8df
C. Lee, S.K. Babu, B.M. Patterson, et al., J. Electrochem. Soc. 171 (2024) 014502. doi: 10.1149/1945-7111/ad1b7b
Y. Matsui, T. Suzuki, P. Deevanhxay, S. Tsushima, S. Hirai, Proceedings of the ASME 2013 11th Fuel Cell Science, Engineering and Technology Conference, 2013.
M. Tang, S. Zhang, S. Chen, Chem. Soc. Rev. 51 (2022) 1529–1546. doi: 10.1039/d1cs00981h
H. Su, T.C. Jao, O. Barron, B.G. Pollet, S. Pasupathi, J. Power Sources 267 (2014) 155–159. doi: 10.1016/j.jpowsour.2014.05.086
S.D. Wu, C.P. Chou, R.G. Peng, C.H. Lee, Y.Z. Wang, Acta. Mech. Sin. 25 (2009) 831–837. doi: 10.1007/s10409-009-0261-7
I.S. Park, W. Li, A. Manthiram, J. Power Sources 195 (2010) 7078–7082. doi: 10.1016/j.jpowsour.2010.05.004
S.A. Mauger, K.C. Neyerlin, A.C. Yang-Neyerlin, K.L. More, M. Ulsh, J. Electrochem. Soc. 165 (2018) F1012–F1018. doi: 10.1149/2.0091813jes
M. Bodner, H.R. García, T. Steenberg, et al., Int. J. Hydrogen Energ. 44 (2019) 12793–12801. doi: 10.1016/j.ijhydene.2018.11.091
Y. Garsany, R.W. Atkinson, B.D. Gould, et al., J. Power Sources 514 (2021) 230574. doi: 10.1016/j.jpowsour.2021.230574
Y. Yurko, L. Elbaz, Electrochim. Acta 389 (2021) 138676. doi: 10.1016/j.electacta.2021.138676
S.A. Mauger, M. Wang, F.C. Cetinbas, et al., J. Power Sources 506 (2021) 230039. doi: 10.1016/j.jpowsour.2021.230039
Y. Yang, S. Yuan, J. Liu, Z. Zhang, T. Lu, Energy 294 (2024) 130605. doi: 10.1016/j.energy.2024.130605
Z. Turtayeva, F. Xu, J. Dillet, et al., Int. J. Hydrogen Energy 47 (2022) 16165–16178. doi: 10.1016/j.ijhydene.2022.03.043
Z. Zhao, Z. Liu, A. Zhang, et al., Nat. Nanotechnol. 17 (2022) 968–975. doi: 10.1038/s41565-022-01170-9
L. Xuan, Y. Wang, J. Lan, et al., Energy 264 (2023) 126243. doi: 10.1016/j.energy.2022.126243
S.M. Alia, K.S. Reeves, J.S. Baxter, D.A. Cullen, J. Electrochem. Soc. 167 (2020) 144512. doi: 10.1149/1945-7111/abc746
M.B. Sassin, Y. Garsany, B.D. Gould, K.E. Swider-Lyons, Anal. Chem. 89 (2017) 511–518. doi: 10.1021/acs.analchem.6b03005
Z. Kang, Z. Fan, F. Zhang, et al., Materials 15 (2022) 7209. doi: 10.3390/ma15207209
H.J. Cho, H. Jang, S. Lim, et al., Int. J. Hydrogen Energ. 36 (2011) 12465–12473. doi: 10.1016/j.ijhydene.2011.06.113
E.B. Creel, K. Tjiptowidjojo, J.A. Lee, et al., J. Colloid Interf. Sci. 610 (2022) 474–485. doi: 10.1016/j.jcis.2021.11.047
P. Liu, D. Yang, B. Li, Int. J. Hydrogen Energ. 48 (2023) 19666–19685. doi: 10.1016/j.ijhydene.2023.02.022
J. Sharma, X. Lyu, T. Reshetenko, et al., Int. J. Hydrogen Energ. 47 (2022) 35838–35850. doi: 10.1016/j.ijhydene.2022.08.157
K. Talukdar, S. Helmly, M. Schulze, et al., J. Power Sources 424 (2019) 82–90. doi: 10.1016/j.jpowsour.2019.03.093
F. Chen, S. Chen, A. Wang, et al., Nat. Catal. 6 (2023) 392–401. doi: 10.1038/s41929-023-00949-w
M. Prokop, M. Vesely, P. Capek, M. Paidar, K. Bouzek, Electrochim. Acta 413 (2022) 140133. doi: 10.1016/j.electacta.2022.140133
T. Rodenas, G. Prieto, Catal. Today 405–406 (2022) 2–13.
Z. Fang, M.S. Lee, J.Y. Kim, J.H. Kim, T.F. Fuller, J. Electrochem. Soc. 167 (2020) 064506. doi: 10.1149/1945-7111/ab7ea3

Figure 1 Typical membrane electrode assembly (MEA) structure schematic and catalyst layer exploded view.

Figure 3 (a) Typically catalyst ink structure, which composes of catalyst, ionomer and solvent medium. Copied with permission [50]. Copyright 2019, American Chemical Society. (b) Commonly used catalysts for PEMFC. Copied with permission [30]. Copyright 2021, Springer Nature. Molecular structures of ionomers: (c) Nafion ionomer, (d) Perfluoro(2-methylene-4-methyl-1,3-dioxolane) based highly oxygen permeable ionomer. Copied with permission [90]. Copyright 2020, American Chemical Society. (e) Perfluoro-(2,2-dimethyl-1,3-dioxole) based highly oxygen permeable ionomer. Copied with permission [11]. Copyright 2021, Springer Nature. (f, g) The contact mode of catalysts and agglomerates on different carbon carrier structures. (h, i) The impact of different agglomerates on oxygen permeation.

Figure 4 (a) Illustrations of carbon and ionomer interaction with various dielectric constants. Copied with permission [106]. Copyright 2019, Elsevier. (b) Pt/C—Nafion agglomerate structure with different Nafion mobility. Copied with permission [99]. Copyright 2017, Elsevier. (c) Pt/C agglomerates evolution with the ionomer adsorption ratio, the initial size of aggregates around ~200 nm. Copied with permission [128]. Copyright 2024, Elsevier. (d) Schematic diagram of interactions between catalyst particles. Copied with permission [41]. Copyright 2018, IOP Publishing, Ltd.

Figure 5 (a) Different mechanism diagrams of ink dispersion method. (b) Structure of catalyst and ionomer with different ink processing. Copied with permission [24]. Copyright 2019, American Chemical Society. (c) Summary of particle size distribution, agglomerate assembly, and top-down view of particle consolidation for different ball milling time. Pt decorated high-surface area carbon particle cartoons are colored gray, Nafion ionomer in solution or surrounding the catalyst spheres is highlighted green, and the various fracture patterns are shown in purple. Copied with permission [139].Copyright 2023, Elsevier. (d) Illustration of catalyst ink evolution. Copied with permission [8].Copyright 2023, Elsevier.

Figure 6 (a) Sources of mass transport resistance inside the MEA of a PEMFC, including equivalent circuit model of mass transport, enlarged model of an agglomerate and pore structure and molecular diffusion route. Copied with permission [30]. Copyright 2021, Springer Nature. (b) Ionomer thin films with different thickness in PEM fuel cells. Copied with permission [156]. Copyright 2018, Spring Nature. (c-g) Scanning electron micrographs of the CL cross-section, (h-l) exterior surface of CL, in which the thickness of CL is different. Copied with permission [151]. Copyright 2019, Elsevier.

Figure 7 (a) Membrane electrode assembly interface structure with ionomer close to but not in contact with the catalyst low Pt loading catalyst layer design. (b) The issues that arise from reducing the Pt loading. (c) The relathioship between O2 transport resistance and the thickness of the catalyst layer.

Figure 8 Schematic illustration of MEA fabrication methods. (a) Catalyst-coated membranes. (b) Inks deposited onto gas diffusion electrodes. (c) Thermal transfer method. (d) Schematic illustration of development of MEA fabrication techniques.

Figure 9 (a) Mechanism of deagglomeration of nanoparticles by the ultrasonic-spray method. Reproduced with permission [3]. Copyright 2011, Elsevier. (b) Ultrasonic spray pattern showing paths. Copied with permission [182]. Copyright 2017, American Chemical Society. (c) Photo image of a typical CCM fabricated by ultrasonic spray method. Copied with permission [34]. Copyright 2012, Elsevier. The influence of ultrasonic spray parameters on the structure of the catalyst layer. (d) The relationship between spray stripe width with spraying height and (e) the relationship between spray stripe width with spraying spacing. (f) Five different cathode catalyst layers used two kinds of catalyst by ultrasonic spray method. Copied with permission [174]. Copyright 2021, Elsevier.

Figure 10 (a) Side view outline of intermittent slot die coating equipment of Toyota and (b) possible coating defects way. Copied with permission [59]. Copyright 2016, IOP Publishing, Ltd. (c) MEA manufacturing process by dry powder R2R manufacturing process. Copied with permission [188]. Copyright 2019, Elsevier. (d) SDC the catalyst layer on gas diffusion media. Copied with permission [176]. Copyright 2021, Elsevier.

Figure 11 Typical characterize technology for CL. (a) SEM image of the CL surface. Copied with permission [190]. Copyright 2022, Elsevier. SEM image of cross-section for CL. Copied with permission [25]. Copyright 2019, Elsevier. Nano-CT data for CL: (c) Phase contrast mode, (d) absorption contrast mode. Copied with permission [41]. Copyright 2018, IOP Publishing, Ltd. (e) Schematic diagram of electron tomography acquisition. Segmented reconstruction: (f) Measurements of I/C weight ratio and carbon surface coverage. (g) 3D map of the ionomer local thickness. Copied with permission [44]. Copyright 2023, Springer Nature BV.

 扫一扫看文章


扫一扫关注我们
 DownLoad:
 下载:
下载:

 下载:
下载: