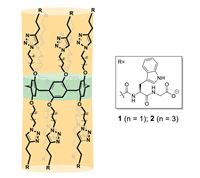
Figure 1.
Chemical structures of channels 1 and 2.
Artificial transmembrane channels displaying mechanosensitivity
Ji-Pan Dong , Lei Zhang , Yi-Fei Hu , Mo Sun , Jun-Li Hou

Mechanosensitive and mechano-gated channel proteins are types of membrane-integrated proteins that can convert external mechanical forces, including stretching, pressure, gravity, osmotic pressure changes, and pathogen invasion, into electrical and chemical signals transmitted to the cytoplasm [1,2]. These channels are in charge of many important physiological processes, such as pain sensation, micturition, hearing, and fluid balance [3,4]. The dysfunction of these natural channels can lead to serious diseases, such as hearing disorders and chronic pain [5].
The development of artificial transmembrane channels would create a new strategy for treating channel-related diseases [6–10]. During the past decades, a large number of artificial channels have been constructed by mimicking the structure and function of natural channels [11–19]. These artificial channels can not only achieve high efficiency and selectivity for mediating the transmembrane transport of ions [20–28], water [29–33], and polar organic solutes [34–36] but can also show sensitivity to external stimuli, including light [37–41], ligand molecules [42,43], changes in pH [44–46], and voltage [47–49]. Mechanosensitive channels, which are sensitive to mechanical forces, were also constructed [50–53]. However, most of these channels were deactivated upon the application of a mechanical force. The construction of channels that can be activated in response to mechanical forces (mechano-gated channels) remains a challenge due to the difficulty in controlling the channel conformation in lipid membranes. Herein, inspired by the structure and mechanism of the mechanosensitive channel of large conductance (MscL) in Escherichia coli, we introduce the construction of an artificial channel displaying mechanosensitivity. The ion transport activity of the channel can be activated by the membrane tension as well as the membrane curvature, and the channel exhibits distinct mechano-gated behaviors.
Pillararenes are a class of macrocycles that have rigid pillar backbones composed of hydroquinone units linked at the para-positions with methylene units [54–57]. These pillar structures are excellent frameworks for creating artificial transmembrane channels by attaching sidechains [58–61]. The transport properties of these channels can be easily adjusted by modifying the sidechain structure. When constructing channel molecules, the alkyl chains that have active linking units at their terminals on the rims of a pillararene are usually modified. After that, oligo peptides are coupled onto a pillar[5]arene backbone through condensation or click reactions [62,63]. The adjacent peptide chains can form intramolecular hydrogen bonding to induce the whole molecule to form a stable tubular structure, and the alkyl linkers endow the channel with a certain degree of flexibility. Additionally, the terminal electrical charge of the channel has a significant influence on the ion transport properties [64]. Generally, artificial channels with negatively charged terminals have better selectivity for cations [65]. Research findings have revealed that flexible glycine hinges play a critical role in the mechanical response of the MscL channel [66], as they orchestrate the rearrangement of sub-units within the membrane under membrane tension. Thus, we envisioned that the sidechains of the channel containing long alkyl linkers, which may act like the glycine hinges of MscL, would have conformations with less stability. In this case, the channel structure would be sensitive to the membrane tension, resulting in different transport behaviors. Thus, channels 1 and 2 with sidechains containing alkyl linkers of different lengths were designed and synthesized in this study (Fig. 1). Trp residues were introduced into the sidechains to enhance the membrane-incorporation ability of the channel molecules [67].
The curvature [68] and lateral tension [69] of a membrane are of great significance for the responses of mechanosensitive channels. Therefore, we constructed different large unilamellar vesicle (LUV) models to study the responses of our artificial channels to these two mechanical properties. We modified the membrane tension by applying an osmotic pressure ΔΠ to the vesicles (Fig. 2a) [50,70]. The relationship between the membrane tension Δσ and the osmotic pressure ΔΠ is as follows Δσ = (ΔΠr)/2, where r is the radius of the vesicle. The osmotic pressure is controlled by changing the glucose concentrations inside (Cintra) and outside (Cendo) the vesicles:
|
|
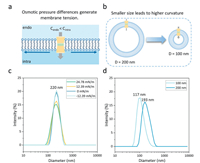
where R and T are the gas constant and temperature, respectively. Table 1 shows the osmotic pressures calculated under different conditions. The size distributions of the vesicles under different osmotic pressures were measured by dynamic light scattering (DLS) (Fig. 2c). The results showed that the change in the osmotic pressure during the experiment did not have a significant effect on the particle sizes of the vesicles.
 DownLoad:
CSV
DownLoad:
CSV
| Cintra (mmol/L) | Cendo (mmol/L) | Δσ (mN/m) |
| 200 | 0 | 24.78 |
| 200 | 100 | 12.39 |
| 200 | 200 | 0 |
| 200 | 300 | -12.39 |
We adjusted the curvature of the membrane by preparing vesicles with different particle sizes [71]. Given that there is a relationship between the membrane curvature (K) and radius (R): K = 1/R, the membrane curvature of vesicles with particle sizes of 100 nm was twice that of vesicles with a particle size of 200 nm (Fig. 2b). Through DLS, we determined that the actual particle sizes of the vesicles with target sizes of 100 and 200 nm were 117 and 193 nm, respectively (Fig. 2d).
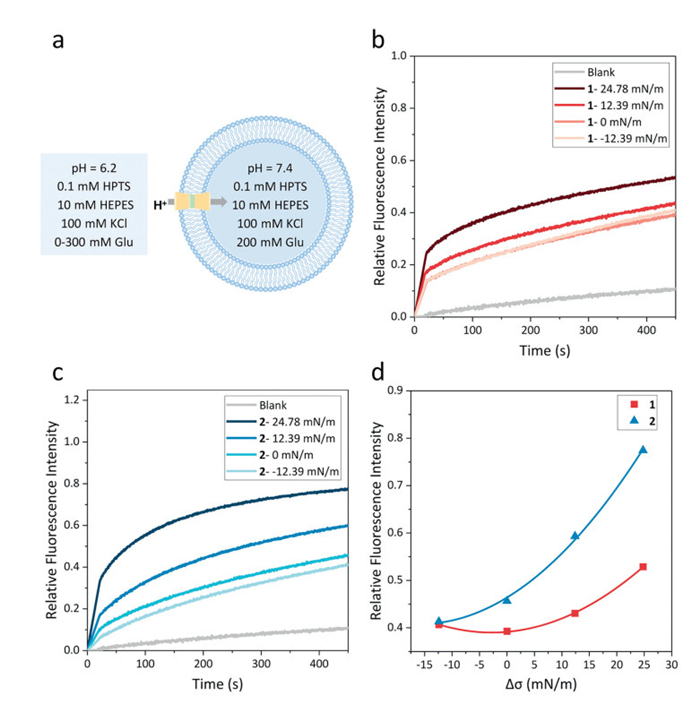
The influence of the membrane curvature and tension on the H+ transport behavior was then investigated. For the experiments, LUVs entrapping a buffer (10 mmol/L 4-(2-hydroxyethyl)-1-piperazineethanesulfonic acid (HEPES), 100 mmol/L KCl, pH 7.4) containing the pH-sensitive dye 8-hydroxypyrene-1,3,6-trisulfonate (HPTS) (0.1 mmol/L) were prepared and then added to a buffer (10 mmol/L HEPES, 100 mmol/L KCl, pH 6.2) to produce an inward H+ gradient. The flux of H+ into the vesicles mediated by channel 1 or 2 was assessed by monitoring the fluorescence intensity of HPTS.
By changing the concentration of glucose in the extracellular fluid of the vesicles, as shown in Table 1, we obtained the fluorescence kinetics curves of channels 1 and 2 (1.97%, molar ratio relative to lipid (mRL)) under different membrane tensions (Fig. 3). As can be seen from Figs. 3b and c, as the membrane tension increased, the proton transport activities of channels 1 and 2 were significantly enhanced. Compared with the situation when Δσ = 0 mN/m, the proton transport activity of channels 1 and 2 was increased by 33% and 71%, respectively, when Δσ = 24.78 mN/m. Moreover, the variation rate of the proton transport ability of channel 2 with respect to the membrane tension was greater than that of channel 1, indicating that channel 2, which was more flexible, had greater responsiveness to the membrane tension than channel 1 (Fig. 3d).
We then investigated the influence of the membrane curvature on the proton transport by using vesicles of different particle sizes. We measured the variations in the fluorescence intensity of HPTS under different mRL values (Fig. 4). The effective concentration required for a 50% activity (EC50) was calculated by fitting the plot of the relative fluorescence intensity at t = 450 s versus mRL with the Hill equation [72,73]:
|
|
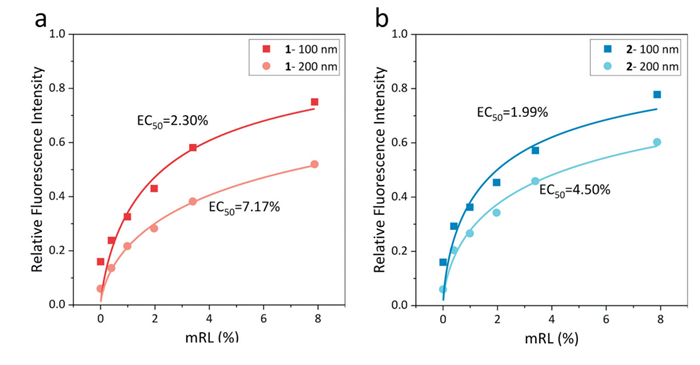
As mentioned earlier, when the vesicle particle size changed from 200 nm to 100 nm, the curvature of the membrane doubled. In such a situation, both channels 1 and 2 exhibited enhanced proton transport capabilities, as evidenced by the significant reduction in their respective EC5n values from 7.17% and 4.5% to 2.3% and 1.99%. This suggested that both molecules were activated by the membrane curvature. Notably, in contrast to the membrane tension, channel 1, characterized by a shorter flexible chain, demonstrated a slightly higher sensitivity to the membrane curvature than channel 2, as indicated by the more pronounced change in its EC5n values.
The macroscopic ion transport study revealed that both the membrane tension and curvature could effectively activate channels 1 and 2, while the alkyl chain lengths of the channels played a crucial role in determining their mechanosensitive properties. Subsequently, using channel 2 as a representative example, the influence of the membrane curvature and tension on the membrane-incorporation ability was evaluated using the ultrafiltration method by mixing the channel (1.97% mRL) with LUV assay. Furthermore, the concentration of unbound channels in the filtrate was accurately assessed by monitoring the intrinsic fluorescence emission of tryptophan residues (Fig. 5). The incorporation efficiencies of the channels to the bilayer membranes of vesicles with different diameters or under different osmotic pressures were all around 75%, indicating that the membrane-incorporation ability was independent of the membrane curvature and tension. This also indirectly showed that the mechanical properties of the membrane changed the channel ion transport activity by influencing the structure of the single-molecule channel itself.

To explore the microscopic mechanisms underlying the responsiveness of these mechanosensitive channels, we further performed single-channel conductance experiments on the planar lipid bilayer in the presence of channel 1 or 2. The membrane tension and curvature could be simultaneously induced by changing the height Δh of the solution in the upper cis chamber, which generated a pressure difference across the membrane [74]. After channel 1 or 2 was added to the solution of the upper chamber above the bilayer, square-like conductance signals were observed (Fig. S11 in Supporting information), strongly supporting the formation of transmembrane channels in the bilayers. Up to 1000 signals at a 100 mV voltage were recorded, and then statistical analysis on the single-channel current (Fig. 6) and channel open time (Fig. 7) was performed. The average single-channel current of channel 1 (2.69 pA) was greater than that of channel 2 (2.35 pA). This could be explained by the fact that channel 1 had a shorter channel structure, which led to a larger conductance according to the Hille equation:
|
|

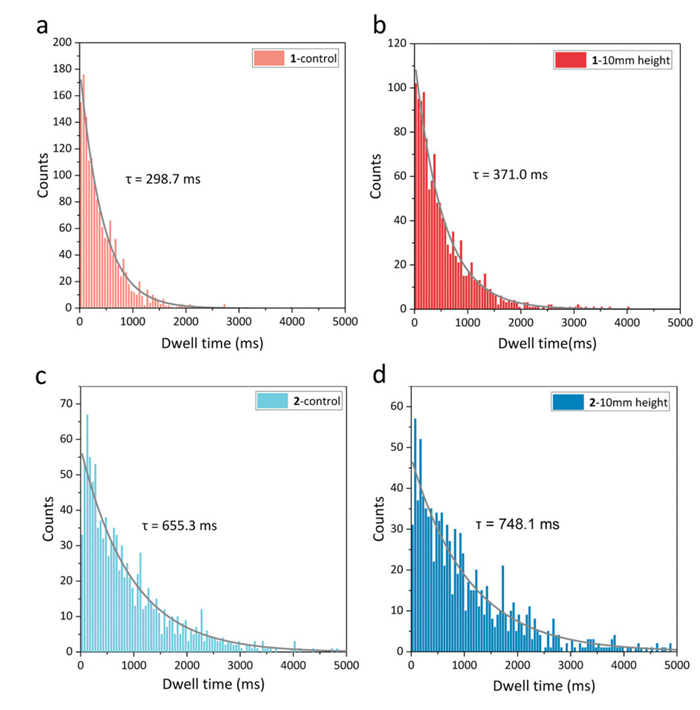
where g is the conductance of the channel, r is the radius of the channel, l is the length of the channel, and ρ is the resistivity of the electrolyte [75]. More notably, the average lifetime of channel 2 (655 ms) was much longer than that of channel 1 (299 ms). This suggests that the more flexible channel molecule adopts a more stable open conformation. Furthermore, it explains why, under identical experimental conditions, channel 2 exhibited superior macroscopic ion transport properties compared to channel 1, despite the latter demonstrating a higher single-channel current. After increasing the hydrostatic pressure above the membrane, the average single-channel current of channels 1 and 2 did not change significantly, while their average channel lifetimes increased by approximately 70 and 100 ms, respectively. This indicates that membrane tension and curvature primarily enhance the ion transport performance of the channels by modulating the flexible regions of the channel molecules. Such modulation further stabilizes the open conformation, thereby prolonging the channel's open time. As a result, they exhibit mechanosensitive properties.
In summary, we successfully constructed artificial trans-membrane cation channels endowed with structural flexibility by incorporating long alkyl chains into a modified pillar[5]arene backbone. These channels exhibit mechanosensitive properties, as their ion transport activity has been significantly enhanced in response to changes in the membrane tension and curvature. This enhancement arise from the mechanism in which mechanical forces applied to the membrane stabilize the open-state conformations of the channels, thereby prolonging the channel lifetimes. This study provides novel insights into the design of mechanically responsive artificial ion channels and their potential applications in biomimetic systems.
The authors declare that they have no known competing financial interests or personal relationships that could have appeared to influence the work reported in this paper.
Ji-Pan Dong: Writing – original draft, Validation, Methodology, Investigation. Lei Zhang: Methodology. Yi-Fei Hu: Methodology. Mo Sun: Formal analysis. Jun-Li Hou: Writing – review & editing, Supervision, Funding acquisition, Conceptualization.
Financial support from the National Natural Science Foundation of China (NSFC, Nos. 21971046, and 21921003), and the Science and Technology Commission of Shanghai Municipality (STCSM, No. 22JC1403700) is gratefully acknowledged.
Supplementary material associated with this article can be found, in the online version, at doi:
O.P. Hamill, B. Martinac, Physiol. Rev. 81 (2001) 685–740. doi: 10.1152/physrev.2001.81.2.685
F. Guharay, F. Sachs, J. Physiol. London. 352 (1984) 685–701. doi: 10.1113/jphysiol.1984.sp015317
M. Chalfie, Nat. Rev. Mol. Cell Biol. 10 (2009) 44–52. doi: 10.1038/nrm2595
P.G. Gillespie, R.G. Walker, Nature 413 (2001) 194–202. doi: 10.1038/35093011
F.M. Ashcroft, Epithelial Na+ channel, in: F.M. Ashcroft (Ed.), Ion Channels and Disease, Academic Press, 2000, pp. 231–247.
J. Yang, G.C. Yu, J.L. Sessler, et al., Chem 7 (2021) 3256–3291. doi: 10.1016/j.chempr.2021.10.028
G.W. Gokel, S. Negin, Acc. Chem. Res. 46 (2013) 2824–2833. doi: 10.1021/ar400026x
S. Ren, Z. Zhang, Z. Dong, Trends Chem. 6 (2024) 726–738. doi: 10.1016/j.trechm.2024.10.005
L. Mao, S. Hou, L. Shi, et al., Chem. Sci. 16 (2025) 371–377. doi: 10.1039/d4sc06893a
Z. Zheng, X. Wei, Y. Lin, et al., J. Nanobiotechnol. 22 (2024) 29. doi: 10.47297/wspciwsp2516-252706.20240805
S.P. Zheng, L.B. Huang, Z.H. Sun, M. Barboiu, Angew. Chem. Int. Ed. 60 (2021) 566–597. doi: 10.1002/anie.201915287
S. Matile, T. Fyles, Acc. Chem. Res. 46 (2013) 2741–2742. doi: 10.1021/ar400234d
Y. Zhao, H.K. Cho, L. Widanapathirana, S.Y. Zhang, Acc. Chem. Res. 46 (2013) 2763–2772. doi: 10.1021/ar300337f
J. Montenegro, M.R. Ghadiri, J.R. Granja, Acc. Chem. Res. 46 (2013) 2955–2965. doi: 10.1021/ar400061d
X. Li, Y.D. Wu, D. Yang, Acc. Chem. Res. 41 (2008) 1428–1438. doi: 10.1021/ar8001393
N. Sakai, S. Matile, Langmuir 29 (2013) 9031–9040. doi: 10.1021/la400716c
B. Wu, Y. Yan, Y. Zhu, et al., Giant 22 (2025) 100352. doi: 10.1016/j.giant.2025.100352
Y. Lin, B. Wu, Y. Zeng, et al., Angew. Chem. Int. Ed. 63 (2024) e202408558. doi: 10.1002/anie.202408558
T.G. Johnson, M.J. Langton, J. Am. Chem. Soc. 145 (2023) 27167–27184. doi: 10.1021/jacs.3c08877
H.W. Ma, R.J. Ye, L. Jin, et al., Chin. Chem. Lett. 34 (2023) 108355. doi: 10.1016/j.cclet.2023.108355
Y.W. Li, Y.H. Fu, J.L. Hou, Chin. J. Chem. 40 (2022) 1293–1297. doi: 10.1002/cjoc.202100836
S.W. Qi, J. Tian, J. Zhang, et al., CCS Chem. 4 (2021) 1850–1857.
A.P. Davis, D.N. Sheppard, B.D. Smith, Chem. Soc. Rev. 36 (2007) 348–357. doi: 10.1039/B512651G
L. Zhang, J. Tian, Z. Lin, Z. Dong, J. Am. Chem. Soc. 146 (2024) 8500–8507. doi: 10.1021/jacs.3c14736
J.F. Lin, X.D. Wang, Y.F. Ao, Q.Q. Wang, D.X. Wang, Angew. Chem. Int. Ed. 63 (2024) e202411702. doi: 10.1002/anie.202411702
J. Zhu, X.D. Wang, J. Luo, et al., Org. Biomol. Chem. 19 (2021) 8586–8590. doi: 10.1039/d1ob01617b
B. Ren, Y. Sun, P. Xin, ChemPlusChem 89 (2024) e202400466. doi: 10.1002/cplu.202400466
L. Shi, W. Zhao, Z. Jiu, et al., Angew. Chem. Int. Ed. 63 (2024) e202403667. doi: 10.1002/anie.202403667
D.D. Su, M. Barboiu, CCS Chem. 5 (2022) 279–291.
L. Zhang, Y.G. Cao, T. Fan, et al., Chin. J. Chem. 42 (2024) 1335–1340. doi: 10.1002/cjoc.202300736
Y.X. Shen, W. Si, M. Erbakan, et al., Proc. Natl. Acad. Sci. U. S. A. 112 (2015) 9810–9815. doi: 10.1073/pnas.1508575112
Z.J. Yan, D.D. Wang, Z.J. Ye, et al., J. Am. Chem. Soc. 142 (2020) 15638–15643. doi: 10.1021/jacs.0c00601
H.Q. Zhao, S. Sheng, Y.H. Hong, H.Q. Zeng, J. Am. Chem. Soc. 136 (2014) 14270–14276. doi: 10.1021/ja5077537
J.Y. Chen, Q. Xiao, H. Behera, J.L. Hou, Chin. Chem. Lett. 31 (2020) 77–80. doi: 10.1016/j.cclet.2019.05.009
H.K. Cho, L. Widanapathirana, Y. Zhao, J. Am. Chem. Soc. 133 (2011) 141–147. doi: 10.1021/ja109036z
L. Chen, W. Si, L. Zhang, et al., J. Am. Chem. Soc. 135 (2013) 2152–2155. doi: 10.1021/ja312704e
J.Y. Chen, J.L. Hou, Org. Chem. Front. 5 (2018) 1728–1736. doi: 10.1039/c8qo00287h
Y. Zhou, Y. Chen, P.P. Zhu, et al., Chem. Commun. 53 (2017) 3681–3684. doi: 10.1039/C7CC01123G
W.Z. Wang, L.B. Huang, S.P. Zheng, et al., J. Am. Chem. Soc. 143 (2021) 15653–15660. doi: 10.1021/jacs.1c05750
H. Yang, J. Yi, S. Pang, et al., Angew. Chem. Int. Ed. 61 (2022) e202204605. doi: 10.1002/anie.202204605
V. García-López, F. Chen, L.G. Nilewski, et al., Nature 548 (2017) 567–572. doi: 10.1038/nature23657
T. Muraoka, D. Noguchi, R.S. Kasai, et al., Nat. Commun. 11 (2020) 2924. doi: 10.1038/s41467-020-16770-z
X.Y. Hu, N.N. Liu, H.S. Yang, et al., Chem. Commun. 55 (2019) 3008–3011. doi: 10.1039/c9cc00732f
H.C. Zhang, X. Hou, L. Zeng, et al., J. Am. Chem. Soc. 135 (2013) 16102–16110. doi: 10.1021/ja4037669
W.H. Chen, M. Nishikawa, S.D. Tan, et al., Chem. Commun. (2004) 872–873.
S. Chen, Y. Wang, T. Nie, et al., J. Am. Chem. Soc. 140 (2018) 17992–17998. doi: 10.1021/jacs.8b09580
Z.J. Yan, Y.W. Li, M.H. Yang, et al., J. Am. Chem. Soc. 143 (2021) 11332–11336. doi: 10.1021/jacs.1c06000
S.P. Zheng, J.J. Jiang, A. Van Der Lee, M. Barboiu, Angew. Chem. Int. Ed. 59 (2020) 18920–18926. doi: 10.1002/anie.202008393
C. Goto, M. Yamamura, A. Satake, Y. Kobuke, J. Am. Chem. Soc. 123 (2001) 12152–12159. doi: 10.1021/ja010761h
K. Sato, R. Sasaki, R. Matsuda, et al., J. Am. Chem. Soc. 144 (2022) 11802–11809. doi: 10.1021/jacs.2c04118
M. Macchione, M. Tsemperouli, A. Goujon, et al., Helv. Chim. Acta 101 (2018) e1800014. doi: 10.1002/hlca.201800014
T. Muraoka, K. Umetsu, K.V. Tabata, et al., J. Am. Chem. Soc. 139 (2017) 18016–18023. doi: 10.1021/jacs.7b09515
Y.Q. Wu, Q.Q. Xu, Y.X. Chen, et al., Adv. Mater. 37 (2025) 2416852. doi: 10.1002/adma.202416852
C. Park, K.T. Kim, Chin. J. Chem. 33 (2015) 311–318. doi: 10.1002/cjoc.201400875
H. Behera, L. Yang, J.L. Hou, Chin. J. Chem. 38 (2020) 215–217. doi: 10.1002/cjoc.201900408
S. Fa, T. Kakuta, T. Yamagishi, T. Ogoshi, CCS Chem. 1 (2019) 50–63. doi: 10.31635/ccschem.019.20180014
T. Ogoshi, S. Kanai, S. Fujinami, T.A. Yamagishi, Y. Nakamoto, J. Am. Chem. Soc. 130 (2008) 5022–5023. doi: 10.1021/ja711260m
T. Ogoshi, T. Yamagishi, Y. Nakamoto, Chem. Rev. 116 (2016) 7937–8002. doi: 10.1021/acs.chemrev.5b00765
Q.Y. Huan, T. Lin, Y.H. Fu, J.L. Hou, Chin. Chem. Lett. 35 (2024) 108566. doi: 10.1016/j.cclet.2023.108566
W. Si, P.Y. Xin, Z.T. Li, J.L. Hou, Acc. Chem. Res. 48 (2015) 1612–1619. doi: 10.1021/acs.accounts.5b00143
Y.H. Fu, Y.F. Hu, T. Lin, et al., Nat. Chem. 16 (2024) 1418–1426. doi: 10.1038/s41557-024-01519-8
Q. Xiao, T. Fan, Y.L. Wang, et al., CCS Chem. 5 (2023) 1745–1752. doi: 10.31635/ccschem.023.202302975
Q. Xiao, D.M. Guan, Y.H. Fu, et al., J. Am. Chem. Soc. 146 (2024) 22869–22873. doi: 10.1021/jacs.4c05959
M. Zhang, P.P. Zhu, P.Y. Xin, et al., Angew. Chem. Int. Ed. 56 (2017) 2999–3003. doi: 10.1002/anie.201612093
P. Xin, H. Yuan, L. Zhang, et al., J. Mater. Chem. B 12 (2024) 10835–10838. doi: 10.1039/d4tb01508h
M.J. Thompson, J.E. Baenziger, Nat. Chem. Biol. 16 (2020) 1331–1342. doi: 10.1038/s41589-020-00693-3
E. Abel, G.E.M. Maguire, O. Murillo, et al., J. Am. Chem. Soc. 121 (1999) 9043–9052. doi: 10.1021/ja9909172
M. Ueki, M. Iwamoto, FEBS Lett. 595 (2021) 1914–1919. doi: 10.1002/1873-3468.14141
X.J. Zhang, Z.F. Liu, J. Li, Protein Sci. 25 (2016) 1954–1964. doi: 10.1002/pro.3017
H.R. Zheng, H.D. Li, M.Q. Li, et al., Angew. Chem. Int. Ed. 62 (2023) e202305896. doi: 10.1002/anie.202305896
L.T. Yan, X.B. Yu, Nanoscale 3 (2011) 3812–3818. doi: 10.1039/c1nr10446b
J. Schrenzel, N. Demaurex, M. Foti, et al., Biophys. J. 69 (1995) 2378–2391. doi: 10.1016/S0006-3495(95)80107-4
L.B. Huang, D.D. Su, A. Hardiagon, et al., J. Am. Chem. Soc. 147 (2024) 678–686. doi: 10.1111/ijlh.14272
B. Martinac, N. Bavi, P. Ridone, et al., Biophys. Rev. 10 (2018) 1377–1384. doi: 10.1007/s12551-018-0450-3
J.K.W. Chui, T.M. Fyles, Chem. Soc. Rev. 41 (2012) 148–175. doi: 10.1039/C1CS15099E

Figure 2 Schematic of the generation of membrane (a) tension and (b) curvature on vesicles. Size distributions of vesicles subjected to different membrane (c) tensions and (d) curvatures, characterized by dynamic light scattering (DLS).

Figure 3 (a) Schematic representation of H+ transport experiments under different membrane tensions mM = mmol/L. Changes in the fluorescence intensity of HPTS (λex = 460 nm; λem = 510 nm) with time after the addition of (b) channel 1 and (c) channel 2 under different membrane tensions. Minimal difference in the change of the fluorescence intensity of HTPS within 450 s was observed. Therefore, the curve of the fluorescence intensity change of HPTS without adding channel under a membrane tension of 24.78 mN/m was select as a representative blank. (d) Final variations in the fluorescence intensity of HPTS with respect to membrane tension.

Figure 4 Variations in the fluorescence intensity of HPTS (λex = 460 nm; λem = 510 nm) after the addition of various concentrations of (a) channel 1 and (b) channel 2 to vesicles with different diameters. The solid lines represent the predictions by the Hill equation.

Figure 5 Fluorescence intensity of channel 2 (λex = 280 nm and λem = 340 nm; mRL = 1.97%) in the filtrate before and after being cultured with vesicles for 1 h under different membrane (a) tensions and (b) curvatures. The corresponding insertion efficiencies were calculated.

Figure 6 Statistical data of the single-channel currents at the applied voltage of 100 mV after the addition of (a, b) channel 1 and (c, d) channel 2 to the solution with different liquid level heights in the upper chamber (10 mmol/L HEPES, 500 mmol/L KCl, pH 7.4) above a diphytanoylphosphatidylcholine (diPhyPC) bilayer membrane. Gaussian fitting curves (represented by the gray lines) were applied to calculate the average single-channel currents.

Figure 7 Statistical data of the single-channel time at an applied voltage of 100 mV after the addition of (a, b) channel 1 and (c, d) channel 2 to the solution with different liquid level heights in the upper chamber (10 mmol/L HEPES, 500 mmol/L KCl, pH 7.4) above a diPhyPC bilayer membrane. Single-exponential decay fitting curves (represented by the gray lines) were applied to calculate the average channel lifetimes.
Table 1. Membrane tension under different conditions.
| Cintra (mmol/L) | Cendo (mmol/L) | Δσ (mN/m) |
| 200 | 0 | 24.78 |
| 200 | 100 | 12.39 |
| 200 | 200 | 0 |
| 200 | 300 | -12.39 |
 下载: 导出CSV

 扫一扫看文章

扫一扫关注我们
