Key Laboratory of Green Chemical Media and Reactions, Ministry of Education Collaborative Innovation Center of Henan Province for Green Manufacturing of Fine Chemicals, School of Chemistry and Chemical Engineering, Henan Normal University, Xinxiang 453007, China
* Corresponding authors. E-mail addresses: xufang@htu.edu.cn (F. Xu)
Received Date:
20 March 2025 Accepted Date:
06 June 2025 Revised Date:
28 May 2025 Available Online:
15 January 2026
Abstract:
Aqueous zinc-ion batteries (AZIBs) have advantages including low economic cost and high safety. Nevertheless, the serious hydrogen evolution reactions (HER) and rampant growth of Zn dendrite hinder their further development. Herein, potassium acetate (KAc) additive with cation/anion synergy effect is added into the ZnSO4 electrolyte to effectively promote the oriented uniform Zn deposition and suppress side reactions. According to density functional theory calculation and experimental results, CH3COO− (Ac−) anions are capable of forming stronger hydrogen bonds with H2O molecules, leading to an expanded electrochemical stability window, reduced the reactivity of H2O, and hence suppressing HER. Meanwhile, Ac− anions can also preferentially adsorb onto the Zn anode, promoting dense deposition towards the (100) crystal plane. Besides, dissociated K+ ions serve as electrostatic shielding cations, which significantly promote uniform Zn deposition and prevent dendrite formation. Thus, the ZnZn symmetric cell demonstrates an impressive cycle lifespan of 3000 h at 1.0 mA/cm2. Furthermore, the ZnMnO2 full battery exhibits superior stability with a capacity retention of 86.95% at 2.0 A/g after 4000 cycles. Therefore, the cation/anion synergy effect in KAc additive offers a viable solution to address HER and hinder dendrite growth at the interface of Zn anodes.
AZIBs have emerged as hopeful contenders for next-generation large-scale energy storage systems [1-3] owing to their non-toxic nature, abundant zinc reserves, minimal cost-effectiveness, and low redox potential (−0.762 V vs. SHE) [4-9]. Nevertheless, the generation of non-uniform zinc dendrites [10] and serious side reactions, for instance zinc corrosion and hydrogen evolution reactions (HER) [11-13], continue to pose critical challenges that impede the cycling lifespan of AZIBs. The effective resolution of these challenges would facilitate the achievement of commercial feasibility for AZIBs [14,15].
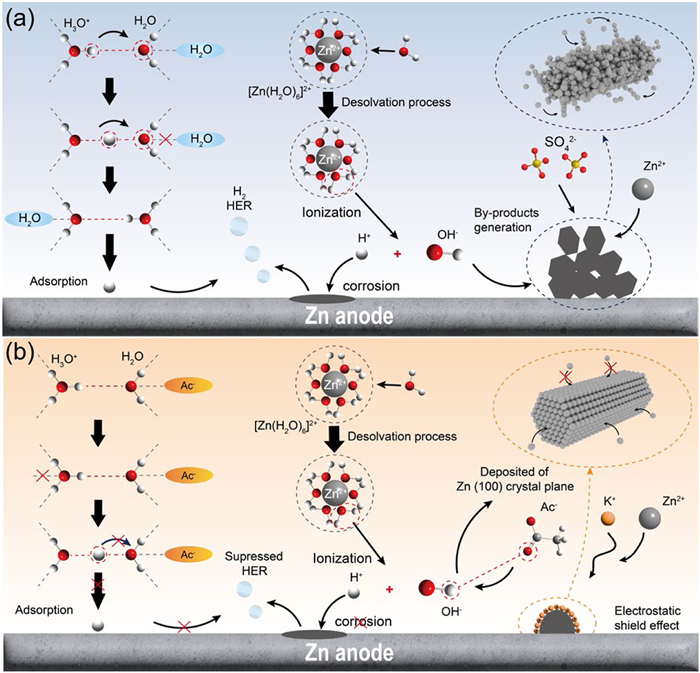
In the ZnSO4 (ZSO) electrolyte, H2O-induced side reaction can generally be considered as two sections [16]. Firstly, the protons efficiently move towards the Zn anode surface through hopping along the hydrogen bonds (HBs) network formed by H2O molecules based on the Grotthuss mechanism, subsequently undergoing HER to produce H2 [17,18]. Secondly, the OH−, generated from the HER, reacts with SO42− and Zn2+, leading to the formation of insulating by-products such as Zn4SO4(OH)6·xH2O (ZSH) [19,20] in Fig. 1a. For stage one, hindering proton transfer and suppressing HER can be achieved by disrupting the original HBs network and establishing more robust interactions with water molecules. Numerous additives have demonstrated the capability to mitigate water activity and reconstruct the HBs network [21], thereby mitigating side reactions. For instance, the abundant hydroxyl groups in the trehalose molecule can form strong HBs with solvent H2O, thereby disrupting the original HBs network, leading to a decrease in the activity of H2O [22]. For stage two, the insulative by-products ZSH exacerbate the non-uniformity of the electric field distribution on the surface of the Zn anode, thereby triggering the "tip effect" to facilitate dendrite formation [23]. To mitigate dendrite formation, the electrostatic shield strategy based on cations can be employed [24-26]. Various cation additives, such as Li+ [27], Na+ [28], Ca2+ [29], and Ce3+ [30], have been utilized to effectively modify the deposition morphology and achieve stable and uniform zinc deposition on the Zn anode. However, current research remains focused on the reconstruction of the HBs network and cationic electrostatic shielding strategy of the electrolyte, but the synergy of the two needs to be further explored necessarily.
Figure 1
Figure 1.
(a) Illustration of the different stages of H2O-induced side reactions occurring in the mild acid electrolyte. (b) Illustration of the CH3COOK-led synergistic modulation of hydrogen bond network reconstruction and electrostatic shield strategy.
Herein, CH3COOK (KAc) is added to the ZSO electrolyte as a bifunctional additive, involving hydrogen bond network reconstruction by Ac− and an electrostatic shield strategy based on K+ (Fig. 1b). The DFT calculation and experimental results demonstrate that a stronger hydrogen bond forms between Ac− and H2O, leading to the reconstruction of the original electrolyte's hydrogen bond network. This reconstruction effectively hinders the Grotthuss mechanism, resulting in an expanded electrochemical stability window and suppressed kinetics of HER. Meanwhile, dissociated K+ ions possess electrostatic shielding effect, which effectively balances the distribution of electric fields, promote smooth Zn deposition, and restrain dendrite formation. Consequently, the KAc additive exhibits a cooperative effect of both cations/anions on the reversible deposition of Zn anode and an observably improved performance in Zn||Zn symmetric cell and Zn||MnO2 full battery in AZIBs.
Electrostatic potential (ESP) calculations were employed to analyze the charge distribution of the H2O molecule and CH3COO− (Ac−) anions to study HBs interaction. As illustrated in Fig. 2a, the red regions represent the negative charge accumulation, while the blue areas correspond to the positive charge ones. In the H2O molecule, the strong electronegativity of the oxygen atom leads to a concentration of the electron cloud around it. This promotes the formation of HBs between the hydrogen atom of H2O and the oxygen atom in the Ac− [16]. The Fourier transform infrared (FTIR) spectroscopy results demonstrate the O—H stretching (3000–3700 cm−1) and bending vibration (1500–1800 cm−1) modes of H2O molecules in 3 mol/L ZnSO4 (ZSO) with/without KAc additive (Fig. 2b and Fig. S1 in Supporting information). Notably, the peak within the range of 3000–3700 cm−1 is often convolved into three components: strong hydrogen bonds (SHBs) (~3200 cm−1), weak hydrogen bonds (WHBs) (~3430 cm−1), and none hydrogen bonds (NHBs) (~3560 cm−1) [31,32]. After the introduction of KAc additive, there is a decrease in the amount of SHBs and NHBs, and an increase in the amount of WHBs, demonstrating that the addition of KAc restructures the HBs network. This finding is additionally confirmed by Raman spectra. As depicted in Fig. S2 (Supporting information), the stretching vibration of the O—H bond (VOH) exhibited a distinct blue shift and the intensity was significantly reduced [33] upon the introduction of the KAc additive, indicating that the group in KAc possesses the capability to disrupt the HBs network among water molecules. Additionally, the VOH ranging from 2500 cm−1 to 4000 cm−1 can be split into three distinct peaks based on the Gauss-Lorenz function in Fig. 2c, which show typical strong, weak and non HBs at 3230, 3440 and 3620 cm−1, respectively [34,35]. Interestingly, with the addition of the KAc additive, the percentage of strong HBs decreases from 42.75% to 37.55%, whereas the percentage of weak HBs increases from 56.06% to 61.67%. This result suggests that the original HBs network among water molecules is disrupted because of the stronger HBs formed between H2O and KAc. Moreover, the 1H signal of H2O moves towards a low chemical shift (high field) according to the 1H nuclear magnetic resonance (NMR) spectra in Fig. 2d This indicates the augmentation of electron density around 1H (H2O) resulting from the HBs interaction between the electron-donating group of KAc and H2O, further confirming the reconstruction of HBs network.
Figure 2
Figure 2.
Hydrogen bond network reconstruction of ZSO + KAc electrolyte. (a) Electrostatic potential distribution of H2O and Ac−. The colors of the atomic model correspond as follows: White: H; red: O; gray: C. (b) FTIR spectra and proportion evolution of strong H-bonds, weak H-bonds and none H-bonds in ZSO and ZSO + KAc electrolytes. (c) Fitted Raman spectra between 2500 cm−1 and 4000 cm−1. (d) 1H NMR of ZSO and ZSO + KAc electrolytes. (e) LSV curves of ZSO and ZSO + KAc electrolytes. (f) Tafel curves of Zn anode and (g) operando pH monitoring within Zn||Zn symmetric cells upon cycling at 5 mA/cm2 of ZSO and ZSO + KAc electrolytes. (h) XRD patterns and (i) SEM images of Zn anodes soaked in ZSO and ZSO + KAc electrolytes for 7 days.
The results obtained through linear sweep voltammetry (LSV) in Fig. 2e show that the onset potential for HER decreases from −0.178 V to −0.233 V (vs. Zn/Zn2+) with ZSO + KAc electrolyte, and this effect also applies to the oxygen evolution reaction. Meanwhile, as displayed in Fig. 2f, the corrosion potential of the KAc electrolyte increased while the corrosion current density decreased. These results are ascribed to the stronger HBs formed between H2O and KAc, which expand the electrochemical stability window and mitigate the corrosion of the Zn anode. More importantly, the pH stabilization of the electrolyte by additives may be closely related to the improved corrosion resistance of the Zn anode [36]. We used ZSO and ZSO + KAc electrolytes to operando observe the evolution of pH values over a 70 h cycling period at 10 mA/cm2 in Fig. 2g. The pH of the ZSO electrolyte undergoes a significant increase from 2.87 to 4.75 after 70 h of cycling. In stark contrast, the pH of KAc remained relatively stable around 4.5, suggesting that the KAc can maintain the pH value to enhance the stability of electrode-electrolyte interfaces and prevent unwanted side reactions. To further investigate the impact of KAc on inhibiting zinc corrosion, Zn anodes were immersed in ZSO and ZSO + KAc electrolytes for a duration of 7 days, respectively. As illustrated in Fig. 2h, the main byproducts on the zinc surface were confirmed after immersion for 7 days using X-ray diffraction (XRD). The new peaks were detected at about 8.6° and 15.2°, corresponding to Zn4SO4(OH)6·4H2O (ZSH, JCPDS No 44–0673) [5]. In comparison, this peak was attenuated in the KAc electrolyte, suggesting that KAc can effectively suppress the undesirable byproducts. Furthermore, the surfaces of the Zn foils after soaking were analyzed using scanning electron microscopy (SEM), as presented in Fig. 2i. Following immersion in the ZSO electrolyte after 7 days, the dendritic structures became evident at the interface of the Zn anode. In contrast, when immersed in the ZSO + KAc electrolyte, the Zn anode displayed a relatively smooth surface of noticeable by-products, suggesting that the addition of KAc effectively inhibits zinc corrosion.
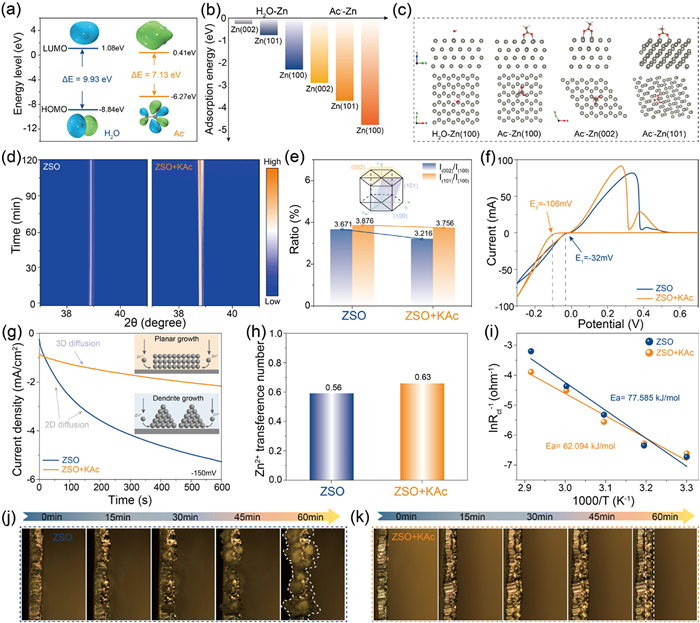
We performed calculations to study the directional deposition behavior of the KAc additive. The LUMO energy level of Ac− molecule is lower than that of H2O, while the HOMO energy level of Ac− molecule is higher than that of H2O in Fig. 3a. This suggest that KAc demonstrates a higher propensity to donate electrons to the Zn anode compared to the water molecule, thereby exhibiting a stronger adsorption affinity of KAc towards the Zn anode. The result is additionally supported through the contact angle measurements of ZSO and ZSO+KAc in Fig. S3 (Supporting information). The adsorption energies (Eads) of H2O and Ac− on different crystal planes were further calculated to provide theoretical evidence supporting the observed orientation of crystal planes in the subsequent XRD results. As depicted in Figs. 3b and c and Fig. S4 (Supporting information), the calculated results indicate that the Eads values of Ac− on three crystal planes were consistently lower than those of H2O on the Zn crystal planes. This observation suggests a stronger adsorption behavior of Ac− on the Zn surface. Simultaneously, we observed that in comparison to the strong adsorption of Ac− on the Zn (100) crystal plane, all other crystal planes, including Zn (101) and Zn (002), exhibited higher Eads values for Ac−, indicating a preferential adsorption tendency of Ac− towards the Zn (100) crystal plane. More importantly, the specific adsorption behavior of Ac− on the Zn (100) crystal plane makes it challenging for Zn2+ ions to deposit on this crystal plane, thereby facilitating oriented deposition of Zn2+ onto the Zn (101) and Zn (002) crystal planes. These results indicate a deceleration in the deposition and growth of Zn2+ onto the Zn (100) crystal plane. Based on the Bravais' Law, the rates of ion deposition on diverse crystal planes are significantly determine the orientation of these crystalline crystal planes. The rapidly growing crystal planes will gradually disappear, exposing the slower growth rate crystal plane in the end [37]. Hence, the slower rate of Zn2+ deposition on the Zn (100) crystal plane facilitates the exposure of the ordered structure of this plane. Above conclusion was further confirmed through operando XRD analysis. Fig. 3d displays that there is no obvious change in intensity at the diffraction peak of 2θ = 39° in the ZSO electrolyte. In contrast, when KAc is added to the electrolyte, a significant rise in peak intensity at this position of 2θ = 39° is observed, suggesting predominant deposition of the Zn (100) crystal plane. Additionally, it is evident that the proportion of I(002) to I(100) and I(101) to I(100) decreased with ZSO+KAc electrolyte after 50 cycles (Fig. 3e and Fig. S5 in Supporting information), consistent with the DFT [38] results above. It was indicated that in the presence of KAc additive, Zn2+ ions tend to deposit preferentially on the (100) crystal plane on the anode surface.
Figure 3
Figure 3.
Insights into Zn-oriented dense deposition behavior. (a) LUMO and HOMO energy levels of H2O molecule and Ac− molecule. (b, c) Comparison of adsorption energies of Ac− molecules and H2O on different Zn crystalline planes. (d) Operando XRD at 1 mA/cm2. (e) Intensity ratios of different crystalline planes of cycled Zn metal from Zn||Zn symmetric cells, insert compared the nucleation overpotential of Zn2+. (f) CV curves recorded at 0.1 mV/s. (g) CA curves of Zn anode at a fixed overpotential of −150 mV, insets showing the Zn2+ diffusion mode. (h) Zn2+ migration number of ZSO and ZSO + KAc electrolytes. (i) The de-solvation activation energies of Zn anode calculated by the Arrhenius equation and (j, k) operando optical microscopy images of Zn plating process in ZSO and KAc electrolyte.
To investigate the effect of directional deposition on regulating zinc deposition behavior, a series of tests and analyses were performed. In Fig. 3f, the nucleation overpotential of Zn in the ZSO+KAc electrolyte (|E2| = 106 mV) surpasses that of the ZSO electrolyte (|E1| = 32 mV), suggesting that KAc additive can reduce the nucleation radius and gain tiny and homogeneous Zn deposition. Subsequently, chronoamperometry (CA) at −150 mV overpotential was employed to further characterize the diffusion process and nucleation behavior of the Zn anode in Fig. 3g. The current density exhibits a continuous increase within 600 s in the ZSO electrolyte, suggesting a drawn-out and vigorous two-dimensional diffusion process. In the ZSO + KAc electrolyte, the constant three-dimensional diffusion is observed. This implies that the KAc additive facilitates uniform and oriented three-dimensional nucleation, thereby promoting stable and uniform zinc deposition on the Zn negative electrode. Furthermore, the transference number of Zn2+ in the KAc electrolyte exhibited a higher value compared to that observed in the ZSO electrolyte (Fig. 3h and Fig. S6 in Supporting information). Meanwhile, the activation energy decreased from 77.58 kJ/mol to 62.09 kJ/mol with KAc additive assistance, indicating enhanced Zn2+ diffusion kinetics that homogenize the interfacial Zn2+ flux, thereby promoting uniform Zn deposition on the surface (Fig. 3i and Fig. S7 in Supporting information). In addition, operando optical microscopy was employed to real-time observation dynamic Zn anode morphological evolution in diverse electrolyte during zinc plating at 2 mA/cm2 (Fig. 3j). As the deposition duration extended, more pronounced uneven deposition and rampant dendritic growth occurred in the ZSO electrolyte. In contrast, when using ZSO + KAc electrolyte, a homogeneous deposit layer of deposition formed within 60 min. Meanwhile, a more uniform, denser, and smoother deposition layer was observed in SEM images for the cycled Zn anode in the presence of ZSO + KAc electrolyte (Fig. S8 in Supporting information). In conclusion, through directional deposition, it is possible to significantly regulate zinc deposition behavior and achieve stable Zn anodes.
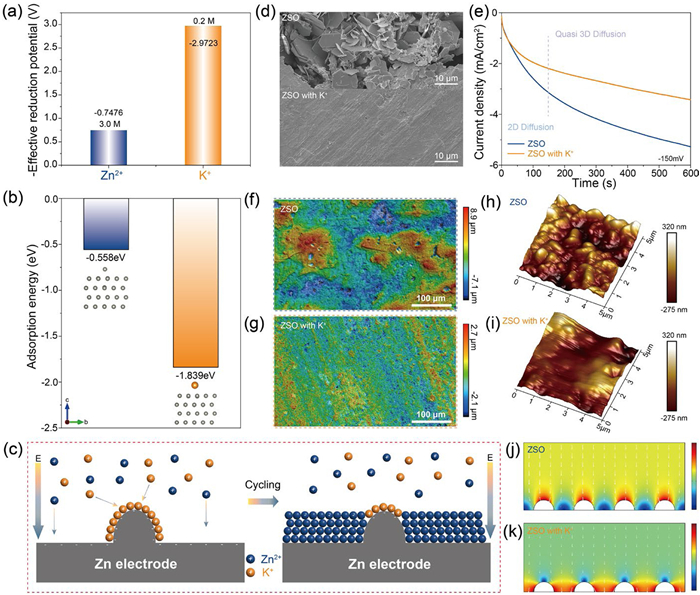
The key role of K+ in regulating the Zn2+ deposition behavior was highlighted based on the Nernst equation. The calculated effective reduction potential in Fig. 4a for K+ is observed to be lower than that of Zn2+, indicating that K+ demonstrates a good shielding effect. It should be noted that the Stokes radius (rs) has a powerful influence on determining the electrostatic shielding effect of ions [24,39,40]. Fig. S9 (Supporting information) reveals that the smaller rs of K+ facilitates more efficient ion transfer dynamics, which in turn enhances the shielding effect. Moreover, the DFT calculation reveals that the Eads of K+ on the Zn surface is obviously lower compared to those of Zn2+ and H2O, demonstrating a preferred adsorption of K+ on the Zn surface for inducing an electrostatic shielding effect at the Zn anode interface to facilitate the uniformity of zinc deposition (Fig. 4b). As shown in Fig. S10 (Supporting information), the elemental mappings reveal that Zn, K, C, S, and O are uniformly distributed on the surface of the zinc anode. This finding confirms the presence of K+ ions after 30 cycles and further indicates the existence of the electrostatic shielding effect. These results demonstrate that the adsorbed K+ ions on the Zn surface create an electrostatic shielding layer, effectively suppressing dendrite formation (Fig. 4c). To further substantiate our hypothesis regarding the role of K+ in stabilizing the Zn anode, we selected potassium sulfate (K2SO4) additives with identical anions as those present in ZSO for comparative analysis. The effect of K+ was investigated by employing SEM characterization of the Zn foil after 30 cycles (Fig. 4d). It was observed that when the Zn foil was immersed without K+, its surface became rough, featuring irregular, sheet-like structures. However, K+ facilitated the formation of a smoother and denser morphology. Meanwhile, Fig. 4e demonstrates that the Zn anode exhibits a moderate current plateau with K+ and that three-dimensional diffusion predominates during nucleation.The results indicate that K+ ions exhibit an effective shielding effect, thereby facilitating uniformity of zinc deposition.
Figure 4
Figure 4.
The electrostatic shielding effect of K+ cations (a) The effective reduction potentials of 3.0 mol/L Zn2+ and 0.2 mol/L K+. (b) The adsorption energies of Zn2+ and K+ on Zn metal. (c) Schematic illustration of working mechanism of the K+. (d) SEM images of Zn||Zn symmetric cells after 30 cycles and (e) the CA curves of Zn anode at a fixed overpotential of −150 mV with/without K+. The LSCM micrographs and the corresponding 3D reconstruction images after 10 cycles in the (f) ZSO and (g) ZSO with K+ electrolytes. AFM images of Zn||Zn symmetric cells after 50 cycles in (h) ZSO and (i) ZSO with K+. The COMSOL simulation results of Zn anode and the relative intensity distributions of the localized electric field in (j) ZSO and (k) ZSO with K+.
To more effectively observe the uniformity of zinc deposition, the Zn anode surface was surveyed after 30 cycles at 1.0 mA/cm2 and 1.0 mAh/cm2 using laser scanning confocal microscopy (LSCM) and atomic force microscope (AFM) under different electrolyte conditions. The LSCM images revealed that cycling the Zn anode in ZSO electrolyte resulted in numerous protrusions and substantial thickening of Zn dendrites (Fig. 4f and Fig. S11 in Supporting information). In comparison, the anode surface displayed a smooth and dense morphology and its surface roughness was reduced (Fig. 4g and Fig. S11). In Figs. 4h and i, under the unified scale, the morphological perturbation induced by uncontrollable zinc deposition markedly amplifies the roughness of the Zn in ZSO electrolyte, leading to a surface roughness of 91.9 nm. Conversely, the presence of K+ additive exhibits a relatively smoother surface, displaying significantly reduced surface roughness of only 55.7 nm. Furthermore, the COMSOL electric field simulations provide additional evidence that the incorporation of the K+ additive effectively homogenizes the electric field and suppresses Zn dendrite growth (Figs. 4j and k). These results demonstrate that the presence of adsorbed K+ ions on the Zn surface creates an electrostatic shielding layer, effectively facilitating the uniformity of zinc deposition.
The influence of ZSO and ZSO+KAc electrolytes on the reversibility of Zn anode plating/stripping was assessed through an assessment of the Coulombic efficiency (CE) in Zn||Cu asymmetric cells, respectively. Fig. 5a presents the CE of Zn||Cu asymmetric cells at 1.0 mA/cm2 and 0.5 mAh/cm2, the ZSO+KAc achieves an outstanding average efficiency of 99.75%, which is higher than that of pure ZSO of 99.01%. Moreover, as shown in Fig. S12 (Supporting information), when cycling with the ZSO electrolyte, the passivation phenomenon became increasingly severe due to zinc dendrite formation and by-product passivation, leading to a decreasing trend followed by gradual increase and subsequent decrease in interface impedance. In contrast, the interface impedance did progressively diminish and remained stable with the addition of KAc. These results validate that KAc enhances the reversibility of Zn plating/stripping processes. To evaluate the long-term cycling life of Zn anodes in ZSO + KAc electrolytes, Zn||Zn symmetrical cells were assembled. The Zn||Zn symmetrical cell with ZSO electrolyte experienced a short circuit within a mere 259 h of cycling. In contrast, the Zn||Zn symmetric cells employing ZSO + KAc electrolytes exhibited long cycling lifespans lasting for 3500 h (Fig. 5b). Moreover, the cell with ZSO+KAc electrolyte at 1.0 mA/cm2 and 1.0 mAh/cm2 demonstrates the most extended lifespan of 3000 h, which is 9.3 times that of the cell with pure ZSO (320 h) in Fig. 5c. Furthermore, cycle life tests were conducted at 5 mA/cm2 and 0.5 mAh/cm2 (Fig. 5d), the cell utilizing ZSO+KAc electrolyte demonstrated an impressive lifespan of 1800 h. Conversely, the cell employing ZSO electrolyte failed within < 83 h. To demonstrate the superiority of KAc additive, this study compares it to other electrolyte additives for cycling performance AZIBs in Fig. 5e and Table S1 (Supporting information). Remarkably, the lifetime of Zn||Zn symmetric cells in this investigation exhibits significant competitiveness across all tested conditions.
Figure 5
Figure 5.
Electrochemical performance of half cells in different electrolytes. (a) CE comparison of Zn||Cu half cells, voltage-time curves for Zn||Zn symmetric cells (b) at 0.5 mA/cm2 and of 0.5 mAh/cm2, (c) at 1.0 mA/cm2 and of 1.0 mAh/cm2 and (d) at 5.0 mA/cm2 and of 0.5 mAh/cm2 in ZSO and ZSO + KAc electrolytes, respectively. (e) Comparison of this work with ZSO + KAc electrolyte in Zn||Zn symmetric cell and previous reported works.
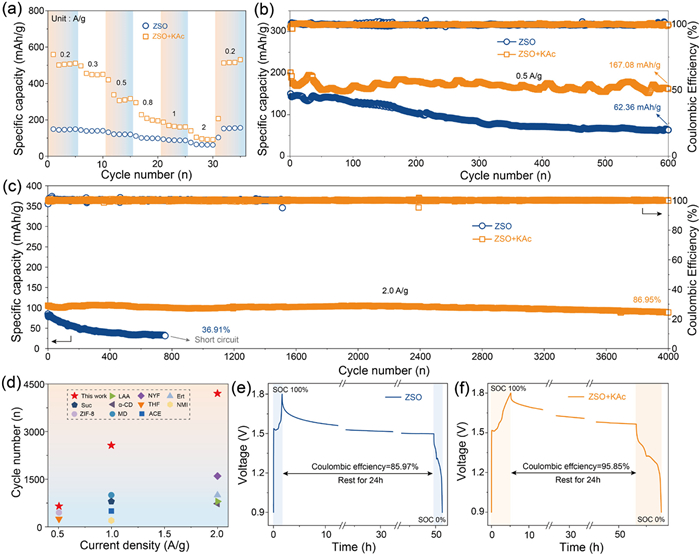
The effectiveness and practicability of the KAc additive are verified through the Zn||MnO2 full batteries. As shown in Fig. 6a and Fig. S13 (Supporting information), batteries using ZSO+KAc electrolyte exhibited significantly better rate performance than those using ZSO electrolyte, achieving average discharge capacities of 559.2, 496.5, 420.2, 204.6, 187.5 and 140.0 mAh/g at the different current densities. Furthermore, the long-term cycling stability of the Zn||MnO2 full battery is assessed at various current densities. As illustrated in Fig. 6b, the battery assembled with KAc additive remained a discharge specific capacity of 167.08 mAh/g at 0.5 A/g after 600 cycles. By comparison, the electrolyte without KAc additive decayed to a discharge specific capacity of 62.36 mAh/g after 600 cycles. Meanwhile, the voltage platform of the full battery remains stable during the cycling process in Fig. S14 (Supporting information). In Fig. S15 (Supporting information), the battery assembled with the KAc additive exhibited a discharge specific capacity of 120.45 mAh/g after 2500 cycles at 1.0 A/g indicating a good capacity retention of 90.26%. Besides, the cycling performance of Zn||MnO2 batteries using various electrolytes was assessed at a high current density of 2.0 A/g (Fig. 6c). After 4000 cycles, the discharge capacity in the ZSO + KAc electrolyte was retained at 88.33 mAh/g, delivering a capacity retention of 86.95%. In comparison, the battery utilizing the ZSO electrolyte showed inferior performance, marked by rapid cell degradation and failure.A comparative evaluation of the cycle lifetime between this work and previously reported works is presented in Fig. 6d and Table S2 (Supporting information). The exceptional cycling performance of the Zn||MnO2 full battery surpasses that of most hybrid electrolytes reported in literature, offering robust evidence for the superiority of KAc additive. Moreover, EIS analysis of Zn||MnO2 batteries in Fig. S16 (Supporting information) was performed. The simulation results show a significant decrease in charge transfer resistance (Rct) from 1755.4 Ω to 659.2 Ω with the addition KAc, indicating improved reaction kinetics and enhanced ion transference facilitated by the inclusion of a small amount of KAc additive. More importantly, an investigation has been conducted on the self-discharge of Zn||MnO2 batteries in Figs. 6e and f. Full batteries with ZSO + KAc electrolyte were charged at 0.2 A/g, followed by a resting period of 24 h. Their retention rate was determined to be 95.85%, whereas this rate dropped significantly to only 85.97% without the KAc additive. Meanwhile, Fig. S17 (Supporting information) illustrates an instance where the pouch battery effectively powers a timer, thereby visually showcasing the potential promise of commercial Zn-based energy storage systems.
Figure 6
Figure 6.
Electrochemical performance of Zn||MnO2 full battery in different electrolytes. (a) Rate performance of Zn||MnO2 full batteries in ZSO and ZSO + KAc electrolytes. Cycling performance at (b) 0.5 A/g and (c) 2.0 A/g. (d) Comparison of cycling performance with those reported works. Self-discharge curves of Zn||MnO2 full batteries in (e) ZSO and (f) ZSO + KAc electrolytes.
In summary, KAc with its cation/anion synergy effect was introduced into ZnSO4 electrolyte to facilitate uniformity of zinc deposition. On the one hand, the reconstruction of the hydrogen bond network between KAc and H2O, leads to an expansion of the electrochemical stability window and an enhancement of corrosion resistance. Meanwhile, Ac− anions can also preferentially adsorb onto the Zn anode, promoting dense deposition on the (100) crystal plane. On the other hand, the presence of K+ ions intensifies the electrostatic shielding effect, leading to a more uniform Zn deposition morphology. As aconsequence, the Zn||Zn symmetric cell utilizing KAc exhibited a cycling lifetime of 3000 h at 1.0 mA/cm2 and 1.0 mAh/cm2. More importantly, Zn||MnO2 full battery exhibited excellent cycling stability, achieving 4000 cycles with a capacity retention of 86.95% at 2.0 A/g.
Declaration of competing interest
The authors declare that they have no known competing financial interests or personal relationships that could have appeared to influence the work reported in this paper.
This work was financially supported by the National Natural Science Foundation of China (No. 52372188), the 111 Project (No. D17007), 2023 Introduction of studying abroad talent program.
Supplementary materials
Supplementary material associated with this article can be found, in the online version, at doi:10.1016/j.cclet.2025.111415.
[1]
Q. Guo, G. Teri, W. Mo, et al., Energy Environ. Sci. 17 (2024) 2888–2896. doi: 10.1039/D4EE00986J
[2]
L. Hong, J. Guan, Y. Tan, et al., Energy Environ. Sci. 17 (2024) 3157–3167. doi: 10.1039/D4EE00199K
[3]
A. Wang, D. Liu, L. Yang, et al., Carbon Energy 6 (2024) e512. doi: 10.1002/cey2.512
[4]
S. Deng, B. Xu, J. Zhao, et al., Angew. Chem. Int. Ed. 63 (2024) e202401996. doi: 10.1002/anie.202401996
[5]
S. Deng, Y. Sun, Z. Yang, et al., Adv. Funct. Mater. 34 (2024) 2408546. doi: 10.1002/adfm.202408546
[6]
J. Cao, Y. Sun, D. Zhang, et al., Adv. Energy Mater. 14 (2023) 2302770.
[7]
L. Ma, M.A. Schroeder, O. Borodin, et al., Nat. Energy 5 (2020) 743–749. doi: 10.1038/s41560-020-0674-x
P. Pau, J. Berg, W. McMillan, J. Phys. Chem. 94 (1990) 2671–2679. doi: 10.1021/j100369a080
Figure 1
(a) Illustration of the different stages of H2O-induced side reactions occurring in the mild acid electrolyte. (b) Illustration of the CH3COOK-led synergistic modulation of hydrogen bond network reconstruction and electrostatic shield strategy.
Figure 2
Hydrogen bond network reconstruction of ZSO + KAc electrolyte. (a) Electrostatic potential distribution of H2O and Ac−. The colors of the atomic model correspond as follows: White: H; red: O; gray: C. (b) FTIR spectra and proportion evolution of strong H-bonds, weak H-bonds and none H-bonds in ZSO and ZSO + KAc electrolytes. (c) Fitted Raman spectra between 2500 cm−1 and 4000 cm−1. (d) 1H NMR of ZSO and ZSO + KAc electrolytes. (e) LSV curves of ZSO and ZSO + KAc electrolytes. (f) Tafel curves of Zn anode and (g) operando pH monitoring within Zn||Zn symmetric cells upon cycling at 5 mA/cm2 of ZSO and ZSO + KAc electrolytes. (h) XRD patterns and (i) SEM images of Zn anodes soaked in ZSO and ZSO + KAc electrolytes for 7 days.
Figure 3
Insights into Zn-oriented dense deposition behavior. (a) LUMO and HOMO energy levels of H2O molecule and Ac− molecule. (b, c) Comparison of adsorption energies of Ac− molecules and H2O on different Zn crystalline planes. (d) Operando XRD at 1 mA/cm2. (e) Intensity ratios of different crystalline planes of cycled Zn metal from Zn||Zn symmetric cells, insert compared the nucleation overpotential of Zn2+. (f) CV curves recorded at 0.1 mV/s. (g) CA curves of Zn anode at a fixed overpotential of −150 mV, insets showing the Zn2+ diffusion mode. (h) Zn2+ migration number of ZSO and ZSO + KAc electrolytes. (i) The de-solvation activation energies of Zn anode calculated by the Arrhenius equation and (j, k) operando optical microscopy images of Zn plating process in ZSO and KAc electrolyte.
Figure 4
The electrostatic shielding effect of K+ cations (a) The effective reduction potentials of 3.0 mol/L Zn2+ and 0.2 mol/L K+. (b) The adsorption energies of Zn2+ and K+ on Zn metal. (c) Schematic illustration of working mechanism of the K+. (d) SEM images of Zn||Zn symmetric cells after 30 cycles and (e) the CA curves of Zn anode at a fixed overpotential of −150 mV with/without K+. The LSCM micrographs and the corresponding 3D reconstruction images after 10 cycles in the (f) ZSO and (g) ZSO with K+ electrolytes. AFM images of Zn||Zn symmetric cells after 50 cycles in (h) ZSO and (i) ZSO with K+. The COMSOL simulation results of Zn anode and the relative intensity distributions of the localized electric field in (j) ZSO and (k) ZSO with K+.
Figure 5
Electrochemical performance of half cells in different electrolytes. (a) CE comparison of Zn||Cu half cells, voltage-time curves for Zn||Zn symmetric cells (b) at 0.5 mA/cm2 and of 0.5 mAh/cm2, (c) at 1.0 mA/cm2 and of 1.0 mAh/cm2 and (d) at 5.0 mA/cm2 and of 0.5 mAh/cm2 in ZSO and ZSO + KAc electrolytes, respectively. (e) Comparison of this work with ZSO + KAc electrolyte in Zn||Zn symmetric cell and previous reported works.
Figure 6
Electrochemical performance of Zn||MnO2 full battery in different electrolytes. (a) Rate performance of Zn||MnO2 full batteries in ZSO and ZSO + KAc electrolytes. Cycling performance at (b) 0.5 A/g and (c) 2.0 A/g. (d) Comparison of cycling performance with those reported works. Self-discharge curves of Zn||MnO2 full batteries in (e) ZSO and (f) ZSO + KAc electrolytes.

 DownLoad:


 下载:
下载:


 下载:
下载:
