cmwang@umac.mo (C. Wang). 1 These authors contributed equally to this work.
Received Date:
24 February 2025 Accepted Date:
05 June 2025 Revised Date:
03 June 2025 Available Online:
15 June 2026
Abstract:
Azido molecules (azidos) have been extensively investigated for their potential as biomedical tools. However, the precise mechanism underlying their intracellular activation remains elusive. In this study, we adopted experimental and computational approaches to demonstrate that this activation mechanism is a photo-bioactivation process, facilitated by intracellular proteins that interact with azidos. Building on these findings, we developed a passive cell-specific fluorescence imaging tool for non-invasive cell tracking within three-dimensional (3D) scaffolds, an active-targeting subcellular organelle imaging system, and a controllable prodrug delivery platform that enables the spatiotemporal regulation of intracellular release and distribution of therapeutic agents. Overall, our study provides the first comprehensive elucidation of the cellular activation mechanism of azidos, which has significant implications for the development of a diverse array of photo-bioactivated tools and prodrugs.
Molecular imaging is a powerful approach to visualizing dynamic biological processes at the molecular and cellular levels within living organisms [1-4]. In contrast to traditional imaging methods, which primarily capture the structural outcomes of diseases, such as tumors or lesions, molecular imaging focuses on revealing the underlying cellular and molecular processes that drive these pathological changes [5,6]. This facilitates understanding disease progression, pathology, and diagnosis [7-10]. The rapid imaging, real-time visualization, and nondestructive detection capabilities, including the use of fluorescent probes, photoactivated fluorophores (PAFs) and bioorthogonal fluorogenic reagents, bridge the gap between molecular biology and clinical medicine [11]. These tools offer new avenues for early-stage disease detection, diagnosis, and treatment planning and evaluation [12-14]. Molecular probes that produce fluorescent products upon chemical activation by specific biotargets or biological processes are particularly valuable for cellular imaging, as different activation mechanisms can target various substrates and unique cellular functions [15-18]. Therefore, exploring novel activation mechanisms is crucial for the advancement of innovative molecular imaging techniques.
In recent years, there has been a growing interest in utilizing azido molecules (azidos) as activated imaging tools [19-22]. Three main approaches have been explored: (ⅰ) Bioorthogonal fluorogenic reagents developed by azide-acetylene click chemistry [23-27] (ⅱ) Fluorescent probes utilizing hydrogen sulfide (H2S)-mediated reduction of the azido group for sensitive H2S detection [28-31] (ⅲ) Engineered azide-photoactivation as PAFs [32-35]. These methods allow for real-time tracking of intracellular substances [36,37], multi-site functionalization [38], observation of macromolecule transport between organelles [4,39] and high-brightness labeling of proteins for single-molecule localization microscopy imaging in living cells [40-43]. While these approaches highlight the versatility of using the azidos in imaging techniques for studying cellular processes, molecular interactions and disease mechanisms, the intracellular activation mechanism of azidos remains unclear. Therefore, it is necessary, from both scientific and practical standpoint to elucidate the cellular activation mechanism of azidos at a fundamental level and expand their applications into new fields.
In this study, we employed a combination of experimental and molecular docking methods to investigate the cellular activation process of the azidos through protein-driven photoactivation within cells, where the azidos interact with hydrophobic pockets in cellular proteins. This interaction creates an activated microenvironment, ultimately leading to protein-driven photo-bioactivation of azidos after exposure to light. We then designed a series of cell imaging tools to control their passive and active localization within cells. Initially, we developed a cell-specific fluorescence imaging tool that relies on photoactivation in the intracellular environment for passive cell tracking within three-dimensional (3D) scaffolds. Additionally, we designed active subcellular organelle imaging probes that were functionalized with organelle-targeting groups. Furthermore, we explored the potential of transforming an azido-hydrophobized model fluorophore from a passive to an active modality through photo-bioactivation. This approach can also serve as a safe and controllable strategy for spatiotemporal regulation of intracellular prodrug release and distribution.
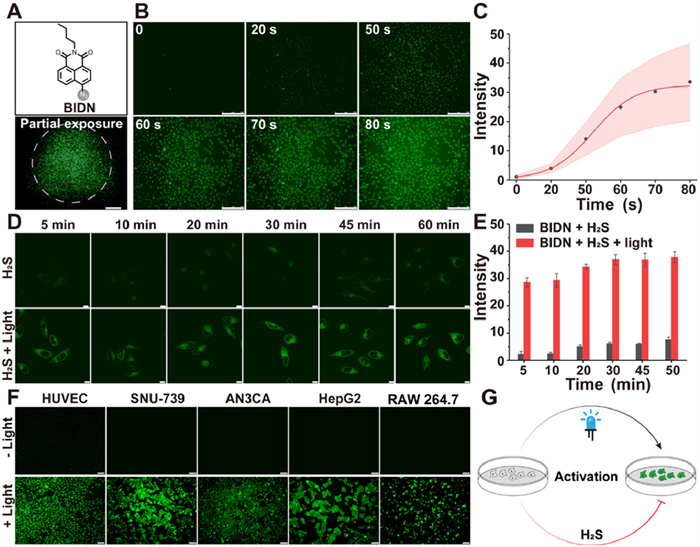
To investigate whether the reduction of the azido groups is triggered by light or by the influence of biological H2S, we synthesized 6-azido-2-butyl-1H-benzo[de]isoquinoline-1,3(2H)-dione (BIDN) derived from 4-bromo-1,8-naphthalic anhydride [44]. Our results demonstrated that SNU-739 cells exhibited bright fluorescence when excited at 488 nm, with non-irradiated areas of cells remaining non-fluorescent (Fig. 1A). Additionally, fluorescence appeared rapidly upon light exposure, reaching its peak intensity early and saturating after 60 s (Figs. 1B and C). After confirming the photoactivation of the probe BIDN in cells, we investigated its ability to track H2S in living cells. The reaction time of the probe BIDN with H2S in cells was further explored by measuring intracellular fluorescence at different probe incubation times ranging from 0 min to 60 min. The results presented in Figs. 1D and E show that cells pre-treated with H2S (50 µmol/L) for 30 min, washed with phosphate buffered saline (PBS) buffer, and then incubated with probe BIDN (10 µmol/L) for different durations exhibited a subtle increase in green fluorescence. In contrast, the probe BIDN exhibited a fast response to light activation. Additionally, various cell types, including human umbilical vein endothelial cells (HUVEC), SNU-739, AN3CA, HepG2 and RAW 264.7, exhibited a similar photoactivation when pretreated with BIDN (Fig. 1F). Overall, these findings suggest that the azido group became photoactivated upon light exposure, resulting in the emission of intense fluorescence, while its reactivity to H2S was minimal (Fig. 1G).
Figure 1
Figure 1.
Photoactivation of the azido molecule in cells. (A) The chemical structure of BIDN and its fluorescence imaging in SNU-739 cells (488 nm, 60 W, 10×). (B) Fluorescence imaging of BIDN (10 µmol/L) in SNU-739 cells as a function of irradiation time (488 nm, 60 W, 10×). Scale bar: 150 µm. (C) Fluorescence intensity changes with varying irradiation time. (D) Time-dependent cell imaging of BIDN with H2S (50 µmol/L). SNU-739 cells were pretreated with H2S (Na2S as the donor) for 30 min and then incubated with 10 µmol/L BIDN (488 nm, 40% laser intensity, 63×) from 5 min to 60 min. Scale bar: 20 µm. (E) Average fluorescence intensity of SNU-739 cells at different times. (F) Fluorescence imaging with BIDN (10 µmol/L) in various cell types. Scale bar: 20 µm. (G) Illustration of the cellular photoactivation process. Data are presented as mean ± standard deviation (SD) (n = 3).
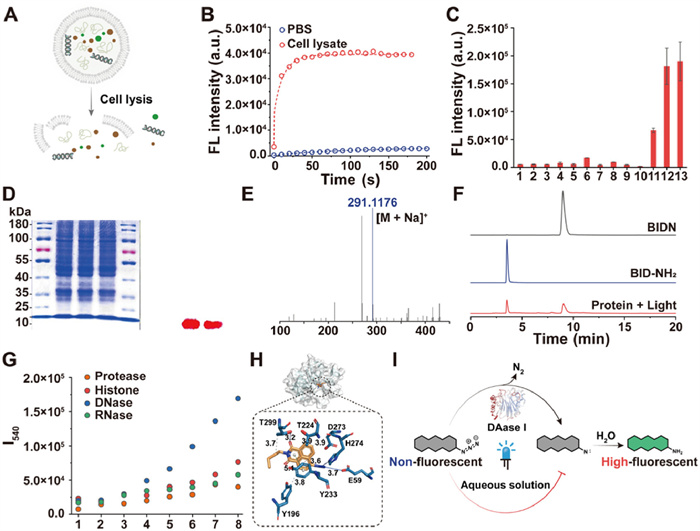
The photoactivation of azidos has been a subject of considerable interest for an extended period [20,41,45]. However, the underlying mechanism of this process remains poorly understood. In our experimental investigation, we observed that azidos exhibited bright fluorescence within cells, but this fluorescence was quenched in the cell culture medium post-photoactivation. To further explore into the photoactivation mechanism of azidos within cells, we conducted fluorescence measurements of BIDN in two different systems, cell lysate (Fig. 2A) and PBS buffer (10 mmol/L, pH 7.4), subjected to a 365 nm, 500 W under photo-illumination every 10 s. Our findings revealed that the fluorescence intensity increased in both cell lysate and PBS buffer following the ultraviolet (UV) irradiation, with a more rapid increase observed in cell lysate, reaching saturation after 60 s (Fig. 2B). Notably, the fluorescence intensity was 17 times higher in the cell lysate compared to the PBS buffer system (Fig. S1 in Supporting information). This led us to hypothesize that the cellular environment played a crucial role in promoting the photoactivation of azidos. To further investigate the mechanism responsible for this fluorescence enhancement, we measured the fluorescence intensity of various common intracellular substances after irradiation with 356 nm, 500 W ultraviolet light for 60 s. Our results, depicted in Fig. 2C, indicate a significant enhancement in the fluorescence of cytoplasmic proteins and nucleoproteins, while other biologically relevant substances such as Na+, K+, Lys, Ala, glutathione (GSH), DNA, RNA, glucose, ATP and lecithin contributed little to the BIDN fluorescence signal. This suggests that the changes in the BIDN fluorescence intensity were primarily influenced by intracellular cytoplasmic and nuclear proteins.
Figure 2
Figure 2.
(A) Preparation of cell lysates. (B) Fluorescence intensity in cell lysates and PBS buffer systems under UV irradiation (365 nm, 500 W). (C) Fluorescence intensity in different cellular components under UV irradiation (365 nm, 500 W). 1. H2O; 2. Na+; 3. K+; 4. Lys; 5. Ala; 6. GSH; 7. DNA; 8. RNA; 9. glucose; 10. ATP; 11. lecithin; 12. cytoplasmic protein; 13. nucleoprotein. (D) SDS-PAGE assay of BIDN in total protein. (E) High-resolution mass spectrometry of BIDN after photoactivation in cytosolic protein. (F) Liquid chromatography analysis of BIDN after photoactivation in cytosolic protein. (G) Photo-bioactivated fluorescence intensity of BIDN (10 µmol/L) at different mass concentrations of DNase Ⅰ, RNase, histone and pepsin (1–8: 0.00, 0.01, 0.10, 1.00, 2.50, 5.00, 10.00 and 20.00 mg/mL). (H) Conformation of DNase Ⅰ and BIDN. (I) Fluorescence production mechanism after photo-bioactivation. Data are presented as mean ± SD (n = 3).
Proteins have been identified as facilitators of the azido molecule photoactivation within cells, although the specific mechanism of this process remains uncertain. Previous studies proposed that azidos may form nitrogen-bin intermediates after photoactivation and can create a covalent bonds with proteins [46]. To generate further insights into the photoactivation process, we utilized sodium dodecyl sulfate-polyacrylamide gel electrophoresis (SDS-PAGE) analysis. The results of the SDS-PAGE analysis and fluorescence imaging shown in Fig. 2D indicate that BIDN was not covalently linked to the protein. Additionally, high-resolution mass spectrometry and liquid chromatography analysis of BIDN after photoactivation in cytosolic proteins revealed the formation of an amino compound (Figs. 2E and F).
Based on these findings, BIDN can be activated by light in both cytoplasmic and nuclear proteins. We specifically selected DNase Ⅰ, RNase, histone and pepsin for further investigations due to their high expression levels in both cellular compartments. Experiments adopting varying concentration gradients determined that DNase Ⅰ had the most significant impact on the BIDN photo-bioactivation (Fig. 2G). To investigate how the protein environment affects the activation of azidos, we conducted molecular dynamics simulations, which revealed that the binding energy between the protein and the azido compound was −6.1 kcal/mol. A protein-ligand interaction profiler (PLIP) analysis revealed hydrogen bonds between the azido compound and Glu59 (3.7 Å), Thr229 (3.2 Å) and His274 (3.3 Å), as well as hydrophobic interactions with Tyr196, Thr224, Thr229, Tyr233 and Asp273 at distances ranging from 3.6 Å to 3.9 Å (Fig. 2H). Moreover, the azido compound showed π-π stacking interactions with Tyr233 at a distance of 5.1 Å. Additionally, Fig. S5 (Supporting information) further illustrates the 2D interactions between the protein and BIDN. We also conducted electron paramagnetic resonance (EPR) tests on BIDN in PBS buffer with and without DNase Ⅰ. Both samples were irradiated with a mercury lamp at 365 nm for 2 min, as illustrated in Fig. S6 (Supporting information). In the presence of DNase Ⅰ, BIDN exhibited a free radical electronic signal with a g value of approximately 2.003, which was consistent with the g value of nitrene [47]. In contrast, the PBS control exhibited a weak and noisy signal, lacking significant detection. Our results indicate that BIDN molecules tended to accumulate in the hydrophobic pockets of proteins such as DNase Ⅰ, creating favorable microenvironments for the activation of the azido group to form highly reactive nitrene and subsequently transform amino molecules through hydrolysis with fluorescence. Combining the experimental and computational results, we have proposed a potential mechanism for the photo-bioactivation of azidos within cells. Central to this discovery is the intricate interaction between azido fluorophores and intracellular proteins. Non-fluorescent azidos bind to the intracellular protein DNase Ⅰ, creating a highly specialized microenvironment that is pivotal for the activation of the azido group. This activation process initiates a cascade of biochemical reactions. Once triggered, the azido group undergoes transformation to form highly reactive nitrene species. These nitrene intermediates exhibit extreme reactivity, and through a hydrolysis reaction, they yield amino molecules, resulting in the emergence of a highly fluorescent state. This phenomenon further confirms the successful photo-bioactivation process (Fig. 2I) [46,48-51].
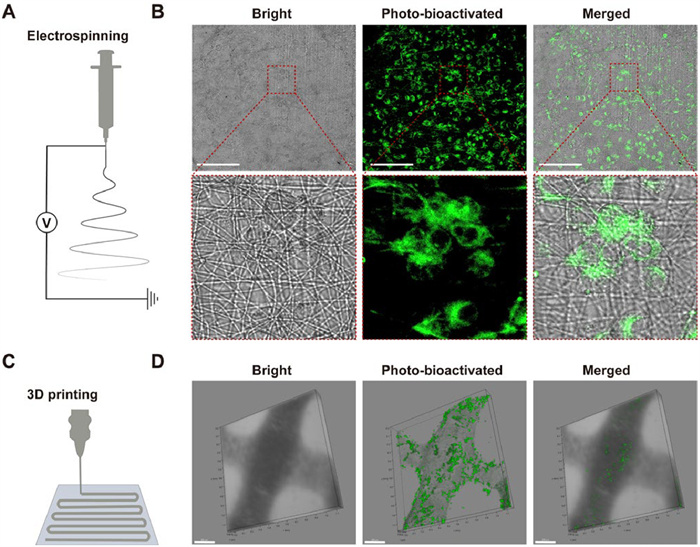
3D scaffolds have been extensively utilized in tissue engineering applications, particularly for creating suitable microenvironments that facilitate the incorporation of cells for the regeneration of damaged tissues or organs. The 3D organization and morphology of cells seeded on micro-scaffolds are typically assessed through histological analysis. However, the development of non-invasive methods to specifically track cells within 3D scaffold environments remains as a challenge. In this study, we examined the cell tracking ability of BIDN within 3D scaffolds, taking into account its photo-bioactivation feature. As shown in Figs. 3A and B, BIDN effectively penetrated the scaffold structure, enabling wash-free and specific cell tracking within electrospinning and 3D-printing scaffolds (Figs. 3C and D). This approach reduces the risk of cell damage and shedding from the scaffold that may occur during washing, thereby helping to maintain the original state and distribution of cells in a 3D space.
Figure 3
Figure 3.
Passive cell-specific fluorescence imaging tools within 3D scaffolds. (A) Preparation of electrospun scaffolds. (B) Fluorescence imaging of cells visualized with the BIDN probe in electrospun scaffolds. (C) Illustration of preparing 3D-printed scaffolds. (D) Fluorescence imaging of cells in 3D-printed scaffolds visualized using the BIDN probe.
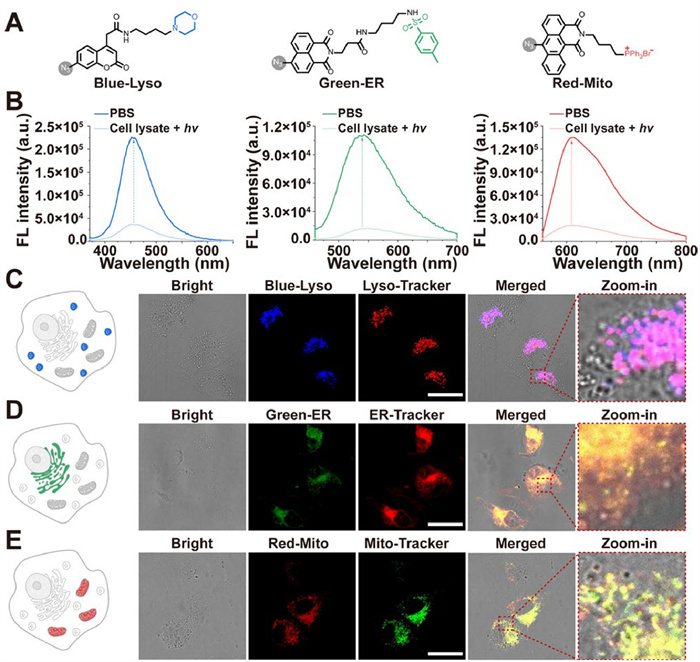
Building on these insights gained from studying the photo-bioactivation mechanism of azidos, we also leveraged this knowledge for bioimaging applications. Subcellular organelles such as the endoplasmic reticula, lysosomes, and mitochondria play crucial roles in maintaining the subcellular microenvironment [52,53]. We investigated the efficacy of azidos in actively targeting subcellular organelle imaging probes. Initially, three organelle-targeted multicolor fluorescent probes containing the azide groups were developed, named Blue-Lyso, Green-ER and Red-Mito, respectively (Fig. 4A). Their synthetic routes are depicted in Supporting information. All probes demonstrated photo-bioactivation capability in the cell lysate compared to PBS, as shown in Fig. 4B. Prior to live-cell imaging, we conducted cell viability assessments of the azido probes shown in Fig. S7 (Supporting information) and confirmed that these probes displayed good biocompatibility. Subsequently, we used the confocal laser scanning microscopy to assess the localization of the three probes within living cells, specifically in lysosomes, endoplasmic reticula and mitochondria within living cells. As shown in Figs. 4C–E, the colocalization analysis showed that Blue-Lyso (Pearson′s R = 0.85, Manders′ M1 = 0.998), Green-ER (Pearson′s R = 0.89, Manders′ M1 = 0.990), and Red-Mito (Pearson′s R = 0.91, Manders′ M1 = 1.000) align closely with the corresponding commercial dyes, confirming their effectiveness as specific organelle-targeted probes for lysosomes, the endoplasmic reticula, and mitochondria, respectively.
Figure 4
Figure 4.
Active subcellular organelle imaging functionalized with organelle-targeting groups. (A) Chemical structures of Blue-Lyso, Green-ER and Red-Mito. (B) Photo-bioactivation of Blue-Lyso, Green-ER and Red-Mito (10 µmol/L each) in the cell lysate. (C–E) Organelle-targeting imaging of Blue-Lyso, Green-ER and Red-Mito (10 µmol/L for each) in HUVEC. Scale bar: 50 µm.
This study confirmed the potential of using photo-bioactivated azidos for developing wash-free imaging tools that can effectively target specific intracellular organelles. In contrast to conventional commercial probes, which maintain fluorescence and produce an elevated background noise and non-specific fluorescence in cell culture media (Fig. S8 in Supporting information), the activation of these azido probes triggers fluorescence release inside cells, allowing for active, precise and specific imaging of different organelles without the need for washing.
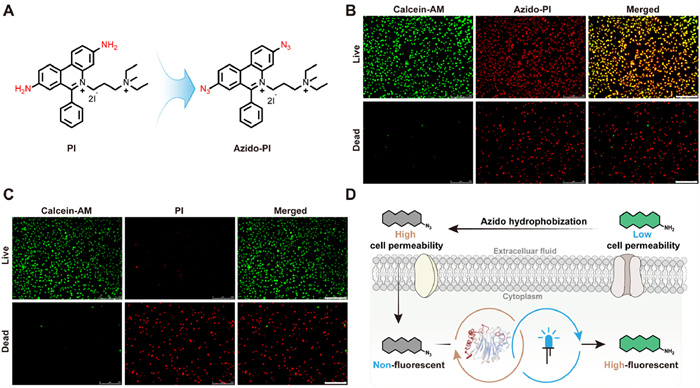
Many molecules face challenges in crossing the cellular membrane, leading to their poor cellular penetration [54,55]. To address the issue, researchers commonly incorporate ester bonds or enzymes into the design of small molecules [56-58]. However, this approach relies substantially on cell viability. In this investigation, we explored the potential of azido hydrophobization as a safe and controllable method to enhance the first-pass entry of molecule into cells. Propidium iodide (PI) was selected as the model molecule, because this membrane-impermeable DNA intercalator cannot cross intact live cell membranes [59-61]. Firstly, Azido-PI was synthesized as shown in Fig. 5A. Subsequently, we imaged calcein-AM/PI and calcein-AM/Azido-PI in live and dead cells, respectively. Under a 494 nm excitation, calcein-AM efficiently stained live cells with green, while PI dye specifically colored dead cells with red under a 535 nm excitation, leaving live cells uncolored. Interestingly, Azido-PI stained both live and dead cells red (Figs. 5B and C). Furthermore, this photo-bioactivated property did not affect the initial function of PI, which is capable of monitoring nuclear integrity (Fig. S9 in Supporting information). This indicates the potential of the azido moiety to facilitate the uptake of impermeable molecules into cells. This process enables subsequent photo-bioactivation, resulting in the conversion of the product back to its amine form, which then accumulates within the cell. Thus, this strategy integrates passive diffusion with active, triggerable intracellular accumulation, representing a dynamic transition from passive to active localization. Additionally, it offers a safe and controlled mechanism for prodrug release, providing a promising approach for precise intracellular drug delivery and imaging (Fig. 5D).
Figure 5
Figure 5.
Passive-to-active imaging modality transformation of azido-containing molecule/prodrug. (A) Chemical structures of PI and Azido-PI. (B, C) Fluorescence imagings of calcein-AM/PI and calcein-AM/Azido-PI (calcein-AM: 494 nm, PI and Azido-PI: 535 nm, respectively, 50 W, 60 s, 10×). Scale bar: 150 µm. (D) Scheme of passive-to-active imaging modality transformation of azido-containing molecule.
In conclusion, our study provided a comprehensive explanation of the cellular activation mechanism of azido fluorophores, highlighting their unique photo-bioactivation properties. Specifically, we revealed that azidos in a non-fluorescent state bind to the intracellular protein DNase Ⅰ, creating favorable microenvironments for the activation of the azido group leading to the formation of highly reactive nitrene. This process subsequently transforms amino molecules through hydrolysis, resulting in a high-fluorescent state. Building on this elucidated mechanism, we have developed a suite of innovative applications that exploit the unique properties of photoactivated azidos, including passive cell-specific fluorescence imaging tools within 3D scaffolds and active subcellular organelle imaging probes functionalized with organelle-targeting groups. Furthermore, we have successfully designed a dynamic passive-to-active transition system utilizing azido functionalization based on PI. Azido-PI can image both live and dead cells without being affected by cell membrane permeability. Through this photo-bioactivation process, Azido-PI functions as both an imaging model and a prodrug intracellular delivery platform. This research provides valuable insights for the development of photo-bioactivated imaging tools and prodrugs with broad biomedical applications.
Declaration of competing interest
The authors declare that they have no known competing financial interests or personal relationships that could have appeared to influence the work reported in this paper.
This study was funded by the National Natural Science Foundation of China (No. 22104029); the China Postdoctoral Science Foundation (No. 2023M730970); the Key Scientific and Technological Project of the Education Department of Henan province (No. 242102311192); the Science and Technology Development Fund, Macao SAR, (Nos. 0024/2023/AFJ, 0031/2023/ITP1) and the University of Macau Multi-Year Research Grant (No. MYRG-GRG2024–00189-ICMS-UMDF).
Supplementary materials
Supplementary material associated with this article can be found, in the online version, at doi:10.1016/j.cclet.2025.111409.
[1]
Z. Zeng, S.S. Liew, X. Wei, et al., Angew. Chem. Int. Ed. 60 (2021) 26454–26475. doi: 10.1002/anie.202107877
[2]
M. Wu, J. Shu, Contrast Media Mol. Imaging 2018 (2018) 1382183.
[3]
S. Hong, P. Sahai-Hernandez, D.G. Chapla, et al., Angew. Chem. Int. Ed. 58 (2019) 14327–14333. doi: 10.1002/anie.201907410
[4]
V.K. Bajpai, I. Khan, S. Shukla, et al., J. Biomed. Nanotechnol. 16 (2020) 283–303. doi: 10.1166/jbn.2020.2899
Y. Yang, Y. Xiang, M. Xu, Sci. Rep. 5 (2015) 18583–18588. doi: 10.1038/srep18583
Figure 1
Photoactivation of the azido molecule in cells. (A) The chemical structure of BIDN and its fluorescence imaging in SNU-739 cells (488 nm, 60 W, 10×). (B) Fluorescence imaging of BIDN (10 µmol/L) in SNU-739 cells as a function of irradiation time (488 nm, 60 W, 10×). Scale bar: 150 µm. (C) Fluorescence intensity changes with varying irradiation time. (D) Time-dependent cell imaging of BIDN with H2S (50 µmol/L). SNU-739 cells were pretreated with H2S (Na2S as the donor) for 30 min and then incubated with 10 µmol/L BIDN (488 nm, 40% laser intensity, 63×) from 5 min to 60 min. Scale bar: 20 µm. (E) Average fluorescence intensity of SNU-739 cells at different times. (F) Fluorescence imaging with BIDN (10 µmol/L) in various cell types. Scale bar: 20 µm. (G) Illustration of the cellular photoactivation process. Data are presented as mean ± standard deviation (SD) (n = 3).
Figure 2
(A) Preparation of cell lysates. (B) Fluorescence intensity in cell lysates and PBS buffer systems under UV irradiation (365 nm, 500 W). (C) Fluorescence intensity in different cellular components under UV irradiation (365 nm, 500 W). 1. H2O; 2. Na+; 3. K+; 4. Lys; 5. Ala; 6. GSH; 7. DNA; 8. RNA; 9. glucose; 10. ATP; 11. lecithin; 12. cytoplasmic protein; 13. nucleoprotein. (D) SDS-PAGE assay of BIDN in total protein. (E) High-resolution mass spectrometry of BIDN after photoactivation in cytosolic protein. (F) Liquid chromatography analysis of BIDN after photoactivation in cytosolic protein. (G) Photo-bioactivated fluorescence intensity of BIDN (10 µmol/L) at different mass concentrations of DNase Ⅰ, RNase, histone and pepsin (1–8: 0.00, 0.01, 0.10, 1.00, 2.50, 5.00, 10.00 and 20.00 mg/mL). (H) Conformation of DNase Ⅰ and BIDN. (I) Fluorescence production mechanism after photo-bioactivation. Data are presented as mean ± SD (n = 3).
Figure 3
Passive cell-specific fluorescence imaging tools within 3D scaffolds. (A) Preparation of electrospun scaffolds. (B) Fluorescence imaging of cells visualized with the BIDN probe in electrospun scaffolds. (C) Illustration of preparing 3D-printed scaffolds. (D) Fluorescence imaging of cells in 3D-printed scaffolds visualized using the BIDN probe.
Figure 4
Active subcellular organelle imaging functionalized with organelle-targeting groups. (A) Chemical structures of Blue-Lyso, Green-ER and Red-Mito. (B) Photo-bioactivation of Blue-Lyso, Green-ER and Red-Mito (10 µmol/L each) in the cell lysate. (C–E) Organelle-targeting imaging of Blue-Lyso, Green-ER and Red-Mito (10 µmol/L for each) in HUVEC. Scale bar: 50 µm.
Figure 5
Passive-to-active imaging modality transformation of azido-containing molecule/prodrug. (A) Chemical structures of PI and Azido-PI. (B, C) Fluorescence imagings of calcein-AM/PI and calcein-AM/Azido-PI (calcein-AM: 494 nm, PI and Azido-PI: 535 nm, respectively, 50 W, 60 s, 10×). Scale bar: 150 µm. (D) Scheme of passive-to-active imaging modality transformation of azido-containing molecule.

 DownLoad:

 下载:
下载:


 下载:
下载:
