Citation:
Xinlu Zhang, Yongxin Liu, Huan Li, Shutong Chen, Guocheng Wang, Xu Zhang, Chen Cao, Xiaoyuan Chen, Sheng Wang. A hypoxia-activated copper ion nanoexchanger for cancer immunotherapy by in situ precise production of immunogenic cell death inducer[J]. Chinese Chemical Letters,
2026, 37(3): 111404.
doi:
10.1016/j.cclet.2025.111404
A hypoxia-activated copper ion nanoexchanger for cancer immunotherapy by in situ precise production of immunogenic cell death inducer
English
A hypoxia-activated copper ion nanoexchanger for cancer immunotherapy by in situ precise production of immunogenic cell death inducer
School of Life Sciences, Faculty of Medicine, Tianjin University, Tianjin 300072, China
b.
Department of Diagnostic Radiology, Yong Loo Lin School of Medicine, National University of Singapore, Singapore 119074, Singapore
c.
Department of Chemical and Biomolecular Engineering, College of Design and Engineering, National University of Singapore, Singapore 117575, Singapore
d.
Department of Biomedical Engineering, College of Design and Engineering, National University of Singapore, Singapore 117575, Singapore
e.
Department of Pharmacy and Pharmaceutical Sciences, Faculty of Science, National University of Singapore, Singapore 117544, Singapore
f.
Clinical Imaging Research Centre, Centre for Translational Medicine, Yong Loo Lin School of Medicine, National University of Singapore, Singapore 117599, Singapore
g.
Nanomedicine Translational Research Program, Yong Loo Lin School of Medicine, National University of Singapore, Singapore 117597, Singapore
h.
Theranostics Center of Excellence (TCE), Yong Loo Lin School of Medicine, National University of Singapore, Singapore 138667, Singapore
i.
Institute of Molecular and Cell Biology, Agency for Science, Technology, and Research (A*STAR), Singapore 138673, Singapore
Received Date:
18 March 2025 Accepted Date:
03 June 2025 Revised Date:
30 May 2025 Available Online:
15 March 2026
Abstract:In situ therapeutic agent production strategy is promising to overcome the drawbacks of direct drug delivery. Hypoxia provides a great target for precise treatment of tumor. Here we report a copper ion competition-based nanoparticle (NP) for hypoxia-activated formation of diethyldithiocarbamate (DTC)-copper complex, an immunogenic cell death (ICD) inducer. The NP is composed of an amphiphilic hypoxia-responsive DTC precursor and a fluorescence quenched copper ion-chelated squaric acid. In hypoxic tumor cells, the azobenzene linker in DTC precursor can be cleaved through bioreduction, leading to DTC release and subsequent copper ion exchange between DTC and squaric acid. Simultaneous formation of toxic DTC-copper complexes and fluorescence recovery will allow for visualization of in situ therapeutic agents production. Furthermore, the DTC-copper complexes can induce ICD and promote cytotoxic T lymphocyte infiltration for cancer immunotherapy. This study not only provides a promising hypoxia-activated nanomedicine for precision cancer therapy, but also a visualization strategy for evaluating the treatment process.
Cancer immunotherapy, an approach that recognizes and combats tumor cells by activating the immune system, is promising in the treatment of invasive and metastatic tumors [1-11]. Induction of cancer immunogenic cell death (ICD) is an effective strategy to elicit an anticancer immune response [12-16]. ICD caused damage-associated molecular patterns (DAMPs) release can promote the maturation of dendritic cells (DCs), thereby activating antigen-specific adaptive immune response [17-19]. Various therapeutic agents, including reactive oxygen species (ROS) and some chemical drugs, can induce ICD beyond their direct toxic effects [20-25]. Therefore, the precise delivery of ICD inducer is of great significance to achieve potent antitumor immunity.
Although the development of stimuli-responsive delivery systems has significantly improved the bioavailability of anticancer drugs, the potential side effect caused by drug leakage remains a challenge [26-29]. In situ therapeutic agent production strategy, which employs benign components to produce bioactive drugs or nanocomposites with therapeutic functions at the target site, offers an alternative approach to traditional chemotherapy [30-35]. On the one hand, a single benign precursor leakage will not cause side effects; on the other hand, the different metabolic rates and low local concentrations of leaked precursors can also constrain the undesirable formation of toxic therapeutic agents. Therefore, this strategy can overcome the drawbacks of direct drug delivery, providing a promising strategy to realize precise production of ICD inducer.
Hypoxia is a prominent feature of most solid tumors due to abnormal vasculatures-induced insufficient oxygen supply and rapid proliferation-induced severe oxygen consumption [36-40]. Although hypoxia can limit the effectiveness of various oxygen-dependent treatment approaches and may promote metastasis and invasiveness, it also provides a great target for precise treatment of tumor due to the overexpression of certain enzymes in hypoxic tumor cells [41-45]. In recent years, various efforts have been made to develop carriers and prodrugs that respond to hypoxia [46-48]. For example, molecules containing active units that can be reduced by cellular enzymes under hypoxic conditions have been used for development of hypoxia-responsive medicines [49-51]. However, little has been done to design hypoxia-activated systems for in situ production of ICD inducer. Moreover, the successful formation of ICD inducer is the key to achieving therapeutic effect; therefore, visualization of in vivo production of ICD inducer, another important issue that may affect treatment evaluation, should be taken into consideration. Due to the high heterogeneity of the hypoxic microenvironment of tumors, monitoring the response of hypoxia-activated systems is of particular significance.
Herein, we report a copper ion (Cu2+) competition-based nanoparticle (NP), termed “Cu2+ nanoexchanger", for hypoxia-activated in situ formation of ICD inducer. As shown in Fig. 1, an amphiphilic hypoxia-responsive diethyldithiocarbamate (DTC) precursor (PAD) was synthesized by linking DTC with poly(ethylene glycol) (PEG) via azobenzene (Azo). A fluorophore, squaric acid (SQ), whose fluorescence signal can be quenched by copper chelation, was also synthesized. The PAD was used to encapsulate a Cu2+-chelated SQ (SQ-Cu), forming PADSC NPs. Under physiological condition, the PADSC NPs exhibit stable nanostructure and low toxicity, ensuring high biosafety. Moreover, due to copper chelation-induced fluorescence quenching, the PADSC NPs can emit negligible fluorescence. In hypoxic tumor cells, the Azo linkers can be cleaved through bioreduction in the presence of overexpressed azoreductase, leading to 1,6-benzyl elimination subsequent release of DTC and quinone methide. Due to the presence of reactive thiol nucleophiles, DTC can strongly chelate Cu2+ to produce copper complexes, bis(DTC)-copper (DTC-Cu) [52-55]. Therefore, Cu2+ exchange will occur between DTC and SQ-Cu, resulting in synchronous in situ production of toxic DTC-Cu and fluorescence recovery. The quinone methide can deplete intracellular glutathione (GSH) and thus decrease the antioxidant capacity of cancer cells. DTC-Cu can lead to upregulation of ROS level and accumulation of ubiquitinated proteins, resulting in effective ICD. The released DAMPs trigger maturation of DCs, thereby activating tumor-specific cytotoxic T cells for potent antitumor immunity. Therefore, the PADSC NPs can not only achieve hypoxia-activated in situ therapeutic agent production for precise cancer treatment, but also provide a promising visualization strategy to evaluate the treatment process.
Figure 1
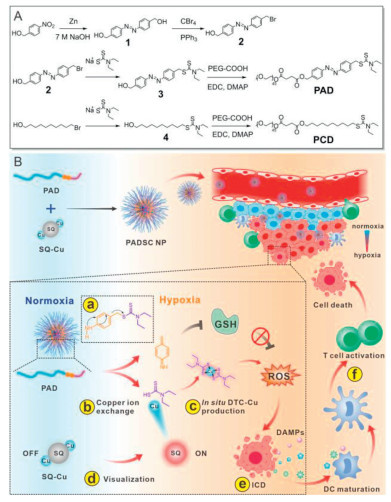
Figure 1.
(A) Synthesis processes of PAD and PCD. (B) Schematic illustration of the copper ion nanoexchanger and its antitumor mechanism of in situ DTC-Cu production. (a) The Azo linker in hypoxia-responsive precursor can be cleaved through bioreduction in the presence of overexpressed azoreductase, leading to DTC release. (b) Due to DTC’s stronger ability to chelate Cu2+ than SQ, Cu2+ exchange will occur between DTC and SQ-Cu. (c) In situ produced DTC-Cu exerts antitumor effects due to upregulation of ROS level and accumulation of ubiquitinated proteins. (d) Meanwhile, Cu2+ exchange leads to SQ fluorescence recovery, allowing visualization of DTC-Cu production. (e) DTC-Cu-induced ICD triggers maturation of DCs. (f) The activated tumor-specific cytotoxic T cells results in potent antitumor immunity.
To synthesize the hypoxia-responsive PAD, an Azo linker (compound 1) was first synthesized (Fig. 1A) [56]. After bromination of one hydroxyl group of Azo linker, the obtained compound 2 was then reacted with DTC to synthesize compound 3. To serve as a non-responsive control group, the Azo linker was replaced by an alkyl chain to synthesize compound 4. Subsequently, methoxy‑PEG (mPEG) was reacted with succinic anhydride for carboxylation, and the mPEG-COOH was conjugated to the residual hydroxyl group of compounds 3 and 4, obtaining PAD and non-responsive PCD, respectively. The SQ was also synthesized for Cu2+ chelation (Scheme S1 in Supporting information) [57]. The chemical structures of compounds, PAD, PCD and SQ were characterized by nuclear magnetic resonance (NMR) spectroscopy and liquid chromatography–mass spectrometry (Figs. S1–S9 in Supporting information).
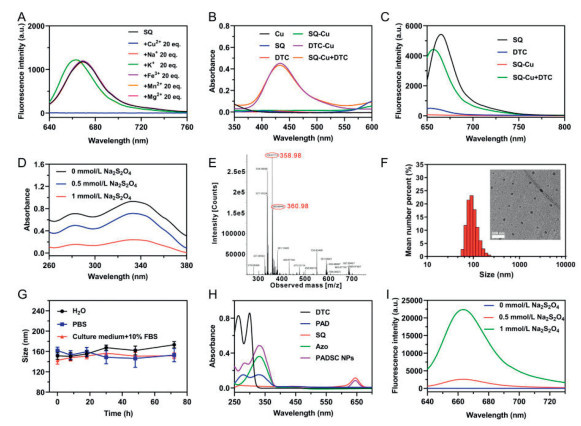
Next, the chelation of SQ to Cu2+ and accompanying fluorescence quenching were investigated. SQ showed a fluorescence emission at 670 nm, which could be quenched by excessive Cu2+ (Fig. 2A). In contrast, some other metal ions (Na+, K+, Fe3+, Mn2+, Mg2+) did not cause obvious change in fluorescence spectra. This result indicated that SQ could be used as a specific fluorescent probe for Cu2+. To further determine the coordination between SQ and Cu2+, the fourier transform infrared spectra of SQ and SQ-Cu were measured (Fig. S10 in Supporting information). After chelating copper, the characteristic peaks at positions 1226 and 1612 cm−1 disappeared, indicating that oxygen atoms in the SQ were involved in coordinating with Cu2+. Both Cu2+ and DTC were colorless at low concentrations; however, their mixture exhibited an obvious color change and absorbance in the range of 400–500 nm, indicating the coordination and production of DTC-Cu (Fig. S11 in Supporting information). The binding constant of DTC-Cu was determined by using the molar ratio method. As shown in Figs. S12 and S13 (Supporting information), the binding constant was calculated to be 6.37 × 10⁴, indicating a high affinity between DTC and Cu2+. Then the Cu2+ competition between DTC and SQ-Cu was investigated. As shown in the absorption spectra (Fig. 2B), the mixture of DTC and SQ-Cu also exhibited a characteristic absorption peak of DTC-Cu, indicating Cu2+ exchange caused DTC-Cu production. The synchronous fluorescence recovery was further confirmed by fluorescence spectra. After Cu2+ exchange, an obvious increase of fluorescence intensity was observed (Fig. 2C). These results indicated that the competitive binding of DTC to Cu2+ can produce DTC-Cu and synchronously trigger SQ fluorescence recovery. Then the responsiveness of PAD was detected. As shown in Fig. 2D, the PAD exhibited characteristic absorption peak of Azo. However, after the treatment with sodium dithionite (Na2S2O4), which was used to mimic bioreduction in hypoxic environment, the absorbance was significantly reduced, indicating the degradation of Azo linker. The cleavage of Azo linker was further confirmed by NMR results (Fig. S14 in Supporting information). After Na2S2O4 treatment, the characteristic peaks belonging to Azo and DTC disappeared. The release of DTC and production of DTC-Cu were assessed by mass spectrum. The result demonstrated that the released DTC could chelate Cu2+ to form DTC-Cu (Fig. 2E).
Figure 2
Figure 2.In vitro Cu2+ exchange-induced DTC-Cu production and fluorescence recovery. (A) Fluorescence spectra of SQ upon addition of different metal ions. (B) Absorption spectra of different samples in acetonitrile. (C) Fluorescence spectra of SQ, DTC, SQ-Cu and SQ-Cu with addition of DTC. (D) Absorption spectra of PAD treated with different concentrations of Na2S2O4. (E) Mass spectrum of Na2S2O4-treated PAD upon addition of Cu2+. (F) Size distribution and TEM image (inset) of PADSC NPs (polydispersity index: 0.101). (G) Colloidal stabilities of PADSC NPs in water, PBS and culture medium with 10% FBS. (H) Absorption spectra of different samples. (I) Fluorescence spectra of PADSC NPs treated with different concentrations of Na2S2O4. Data are presented as mean ± standard deviation (SD) (n = 3).
Then the PADSC NPs were prepared by self-assembly of PAD. SQ-Cu was encapsulated into the hydrophobic core of NPs due to hydrophobic interactions. The non-responsive NPs (abbreviated as PCDSC NPs) prepared by PCD and SQ-Cu were used as a control group. As shown in Fig. 2F and Fig. S15 (Supporting information), both PADSC NPs and PCDSC NPs exhibited nanosized structures with hydrodynamic diameters of about 90 nm. In addition, the zeta potentials of the PADSC NPs and PCDSC NPs were measured to be −12.57, and −1.25 mV, respectively (Fig. S16 in Supporting information). The fluorescence of SQ in PADSC NPs and PCDSC NPs was quenched by Cu2+ chelation. In contrast, the NPs self-assembled from PAD and SQ (abbreviated as PADSQ NPs) showed a characteristic emission peak of SQ (Fig. S17 in Supporting information). Then the stabilities of PADSC NPs were assessed. As shown in Fig. 2G, after incubation with water, phosphate buffer solution (PBS) or culture medium containing 10% fetal bovine serum (FBS) for 72 h, no significant changes in the size of PADSC NPs were observed. Furthermore, the fluorescence quenching was also well maintained during this period (Fig. S18 in Supporting information). The above results indicated that PADSC NPs have good colloidal and fluorescent stabilities, which is beneficial for further application in vivo. In addition, the absorption spectrum of PADSC NPs showed typical characteristic peaks of DTC, Azo, and SQ (Fig. 2H).
The bioreduction-responsive behavior of PADSC NPs was then investigated. After Na2S2O4 treatment, the morphology of PADSC NPs was obviously changed (Fig. S19 in Supporting information), which may be attributed to the cleavage of Azo linkers and disassembly of the NPs. Meanwhile, the fluorescence performance of PADSC NPs underwent significant changes. As shown in Fig. 2I, in the group of Na2S2O4-treated PADSC NPs, the SQ fluorescence was detected, indicating the production of DTC and Cu2+ exchange between DTC and SQ-Cu in the NPs. However, the PCDSC NPs showed negligible change in fluorescence intensity (Fig. S20 in Supporting information). These results indicated that the production of DTC-Cu and SQ fluorescence recovery occurred simultaneously.
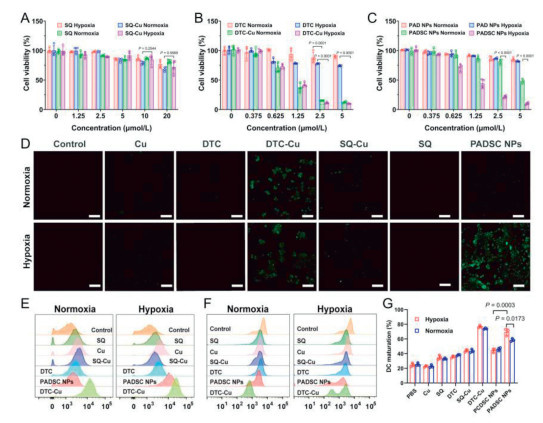
Then the Cu2+ exchange-induced fluorescence recovery was investigated in 4T1 cells. As shown in confocal laser scanning microscopy (CLSM) images (Fig. S21 in Supporting information), obvious red fluorescence was observed inside the cells incubated with SQ; while the intracellular fluorescence in the SQ-Cu treatment group was very weak, indicating stable chelation between SQ and Cu2+. The subsequent incubation of DTC resulted in fluorescence recovery, which was attributed to the Cu2+ competition and release of free SQ (Fig. S22 in Supporting information). To further investigate the hypoxia responsiveness of the PADSC NPs, 4T1 cells incubated with PADSC NPs in hypoxic or normoxic conditions were observed using CLSM (Fig. S23 in Supporting information). Compared to normoxic condition, the incubation in hypoxic condition obviously increased fluorescence signal, indicating that the PADSC NPs could respond to hypoxia and achieve fluorescence recovery. In contrast, the PCDSC NPs could not achieve fluorescence recovery under normoxic or hypoxic conditions (Fig. S24 in Supporting information). Meanwhile, this hypoxia-responsive activation and fluorescence recovery were also studied in HeLa and CT26 (Figs. S25 and S26 in Supporting information). The results indicated that PADSC NPs could respond to hypoxic environments and release DTC in different tumor cells. To further demonstrate the production of toxic DTC-Cu, cytotoxicity study was performed by using a methyl thiazolyl tetrazolium (MTT) assay. As shown in Fig. 3A, SQ and SQ-Cu showed low cytotoxicities to 4T1 cells under both normoxic and hypoxic conditions, indicating their high biosafety as fluorescent indicators. DTC and Cu2+ exhibited low cytotoxicity even at a high concentration; however, the cytotoxicity was significantly enhanced when DTC-Cu was produced (Fig. 3B and Fig. S27 in Supporting information). These results indicated that the anticancer agent DTC-Cu could be produced from two benign components. Then the antitumor activities of PADSC NPs under normoxic and hypoxic conditions were evaluated. As shown in Fig. 3C, the cytotoxicity of PADSC NPs in hypoxic condition was higher than that in normoxic condition, which may be due to the fact that hypoxia was more favorable for the release of DTC and production of DTC-Cu. In contrast, the NPs prepared by PAD without SQ-Cu (abbreviated as PAD NPs) did not show obvious anticancer effect under both conditions. Moreover, PCDSC NPs without Azo linker exhibited negligible anticancer effect because DTC could not be released to form DTC-Cu (Fig. S28 in Supporting information). All of these results indicated that the release of DTC and Cu2+ exchange were key factors in the production of therapeutic agents. In addition, Annexin V-FITC/PI staining results also demonstrated that therapeutic agents could be produced under hypoxic condition when the cells were incubated with PADSC NPs. As shown in Figs. S29 and S30 (Supporting information), in the PADSC NPs group, more apoptotic cells were detected under hypoxic condition.
Figure 3
Figure 3.In vitro assess of hypoxia-triggered DTC-Cu production and antitumor effect of PADSC NPs. (A) Cytotoxicity of SQ and SQ-Cu (n = 4). (B) Cytotoxicity of DTC and DTC-Cu (n = 4). (C) Cytotoxicity of PAD NPs and PADSC NPs (n = 4). (D) CLSM images of different samples-treated 4T1 cells after DCFH-DA staining. Scale bar: 100 µm. (E) FCM analysis showing intracellular ROS generation caused by different samples. (F) FCM analysis showing GSH depletion caused by different samples. (G) Quantitative analysis of mature DCs (n = 3). All data are presented as mean ± SD. Statistical significance was determined using one-way ANOVA.
To further elucidate the mechanism of DTC-Cu’s antitumor activity, ROS generation, GSH depletion and mitochondrial membrane potential were monitored. The intracellular ROS levels of 4T1 cells incubated with different samples were detected by using 2,7-dichlorodihydrofluorescein diacetate (DCFH-DA). As shown in CLSM images (Fig. 3D) and flow cytometry (FCM) analysis results (Fig. 3E), DTC-Cu could cause increased ROS levels inside cells under both normoxic and hypoxic conditions. However, the other control groups (Cu, DTC, SQ-Cu and SQ) did not significantly increase the level of ROS at the same concentration. For PADSC NPs group, ROS generation was only observed under hypoxic condition, indicating hypoxia-responsive DTC release and DTC-Cu production (Fig. S31 in Supporting information). The intracellular GSH was detected using Triol-Violet as a probe. As shown in Fig. 3F and Fig. S32 (Supporting information), DTC-Cu incubated cells exhibited reduced GSH level; while the cells treated with PADSC NPs showed a GSH decrease only under hypoxic condition (Fig. S33 in Supporting information), which may be attributed to the ROS generation and quinone methide release. The mitochondrial membrane potential change caused by upregulation of ROS level was further explored by using JC-1 probe. Consistent with the cytotoxicity and ROS production results, DTC-Cu could lead to mitochondrial dysfunction under normoxia and hypoxia; however, the PADSC NPs only caused mitochondrial membrane depolarization under hypoxic condition (Fig. S34 in Supporting information). These results further confirmed that the PADSC NPs could respond to hypoxic environment to produce DTC-Cu for causing mitochondrial dysfunction and inducing apoptosis. Besides ROS generation, the accumulation of ubiquitinated proteins is another characteristic of DTC-Cu treatment, as DTC-Cu can inhibit the function of proteasomes [58]. As shown in Figs. S35 and S36 (Supporting information), the poly-ubiquitin protein level was obviously upregulated in DTC-Cu-treated cells under both normoxia and hypoxia, which was consistent with previous studies [59,60]. In PADSC NPs-treated groups, the accumulation of poly-ubiquitin protein inside cells under hypoxia was higher than that under normoxia. The determination of mono-ubiquitin protein also confirmed that the PADSC NPs could induce accumulation of ubiquitinated proteins in hypoxic condition (Figs. S37 and S38 in Supporting information).
Then the ability of the PADSC NPS to induce ICD was investigated by the release of DAMPs. The high-mobility group protein B1 (HMGB1) release under hypoxia was first observed by CLSM. As shown in Fig. S39 (Supporting information), HMGB1 (green) was mainly distributed in nuclei of cells in control group and PCDSC NPs group. In contrast, the treatments of DTC-Cu and PADSC NPs resulted in effective HMGB1 release from the nuclei, indicating their robust ability to induce ICD. The calreticulin (CRT) exposure was investigated by using an immunofluorescence assay via FCM (Figs. S40 and S41 in Supporting information). Compared with control group and PCDSC NPs group, DTC-Cu treatment could cause obvious CRT exposure under both hypoxia and normoxia. In PADSC NPs group, the CRT exposure induced by the treatment under hypoxia was higher than that under normoxia (Fig. S42 in Supporting information). Then adenosine triphosphate (ATP) content in the supernatant was determined by using an ATP assay (Fig. S43 in Supporting information). The cells treated with PADSC NPs under hypoxic condition possessed the highest extracellular ATP level. These results demonstrated that the PADSC NPs could promote ICD by in situ production of ICD inducer, which may further activate anti-tumor immunotherapy. The released DAMPs during ICD can lead to the maturation of DCs, which are the most representative antigen-presenting cells. Next, the maturation of bone marrow-derived dendritic cells (BMDCs) was determined. The cytotoxicity study showed that the viability of BMDCs was still > 60% even at a high concentration (Fig. S44 in Supporting information). After the co-incubation of BMDCs and sample-treated 4T1 cells, the expressions of the co-stimulatory molecules on the surface of DCs were analyzed by using FCM. As shown in Figs. S45–S47 (Supporting information), the expression of CD80 and CD86 significantly increased upon incubation of BMDCs with DTC-Cu-treated 4T1 cells, indicating effective DCs maturation. The proportion of mature DCs (CD11c+ CD80+ CD86+) in PADSC NPs treated cells under hypoxia was higher than that in other control groups (Fig. 3G). These results demonstrated that PADSC NPs can promote the maturation of BMDCs by production of ICD inducer DTC-Cu, exerting strong immune activation effect.
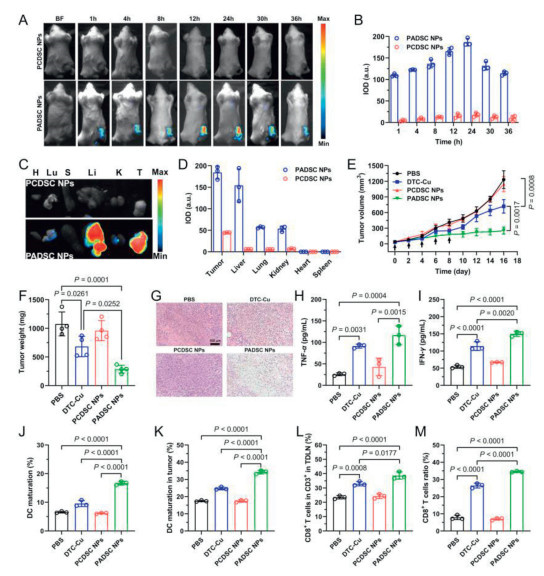
Then the in vivo fluorescence imaging and anticancer studies were further performed on 4T1 tumor-bearing mice to investigate the in vivo performance of PADSC NPs and PCDSC NPs. All animal procedures were performed in accordance with the Guidelines for Care and Use of Laboratory Animals of Tianjin University and approved by the Animal Ethics Committee of Tianjin University (No. TJUE-2023–031). As shown in Figs. 4A and B, after intravenous injection of the PADSC NPs, the fluorescence intensity at the tumor site gradually increased and reached its maximum value at 24 h postinjection. This result may be attributed to the accumulation of the NPs and Cu2+ competition-induced fluorescence recovery of SQ. After 24 h, the fluorescence intensity at the tumor site gradually decreased, indicating that the NP had begun to be metabolized. In contrast, almost no fluorescence signal was observed in the group treated with PCDSC NPs. Due to the limitation of light penetration depth and the influence of fur, the in vivo fluorescence imaging may not accurately reflect the fluorescence changes of organs in the body. Therefore, the ex vivo imaging of tumor and major organs was further performed at 36 h postinjection (Fig. 4C). Negligible fluorescence signals could be detected in PCDSC NP group; however, in the PADSC NP group, tumor exhibited strong fluorescence intensity, indicating the production of DTC-Cu and release of fluorescent SQ (Fig. 4D). This result further confirmed that Azo linker was critical to the DTC release and fluorescence recovery. A fluorescence signal was also observed in liver, which may be attributed to SQ produced at the tumor site being metabolized. The in vivo and ex vivo fluorescence results also demonstrated that free SQ was metabolized by the liver (Fig. S48 in Supporting information). These imaging results indicated that the PADSC NPs could achieve visualization of in situ DTC-Cu production via Cu2+ exchange-induced fluorescence recovery of SQ. Based on the results of in vivo imaging, 48 h was selected as the dosing interval in subsequent treatment experiments.
Figure 4
Figure 4.In vivo antitumor activities of PADSC NPs. (A) Fluorescence images of 4T1 tumor-bearing mice after intravenously injection of NPs. (B) Integrated optical density (IOD) analysis of the tumor fluorescence signals at different times. (C) Ex vivo fluorescence images of major organs and tumor tissue at 36 h postinjection. H: heart; Lu: lung; S: spleen; Li: liver; K: kidneys; T: Tumor. (D) IOD analysis of the fluorescence signals of major organs and tumor tissue. (E) Tumor volume growth curves of different groups on the 4T1 tumor-bearing mice (n = 4). (F) The weight of the excised tumors of mice after treatments (n = 4). (G) H&E staining of tumor tissues after different treatments. Scale bar: 500 µm. (H, I) The levels of (H) TNF-α, and (I) IFN-γ in serum of mice after different treatments (n = 3). (J) Percentage of mature DCs in TDLNs. (K) Percentage of mature DCs in tumors. (L) Percentage of CD8+ T cells in TDLNs. (M) Percentage of tumor-infiltrating CD8+ T cells. All data are presented as mean ± SD. Statistical significance was determined using one-way ANOVA.
Encouraged by the efficient in vivo fluorescence recovery, the anticancer effect of PADSC NPs was further evaluated. When the tumors formed and the average volume reached about 60 mm3, PBS, DTC-Cu, PADSC NPs and PCDSC NPs were intravenously injected into 4T1 tumor-bearing mice every 2 days for 5 times. Tumor volume and body weight were monitored every 2 days starting from the first injection. As shown in Fig. 4E and Fig. S49 (Supporting information), both DTC-Cu and the PADSC NPs groups have inhibitory effects on tumor growth. The PADSC NPs exhibited the highest inhibition rate of tumor growth (79.23%), which was much higher than that of other treatment groups (Fig. S50 in Supporting information). At the end of treatment, the tumors were collected and weighed. The weigh (Fig. 4F) and photograph (Fig. S51 in Supporting information) of tumor tissues also demonstrated the effective suppression of tumor growth caused by PADSC NPs treatment. These results were consistent with hematoxylin and eosin (H&E) staining. As shown in Fig. 4G, apoptosis or necrosis of tumor cells were detected in tumors of mice treated with DTC-Cu and PADSC NPs. In contrast, the PCDSC NPs without the ability to release DTC did not exhibit antitumor effect. These results demonstrated that the production of DTC-Cu was crucial for inhibiting tumor. More importantly, in situ formation of DTC-Cu could overcome the systemic toxicity caused by direct application of DTC-Cu. No significant weight loss or organ damage was observed in the mice treated with the PADSC NPs (Figs. S52 and S53 in Supporting information). In addition, no hemolysis occurred after mixing PADSC NPs with erythrocyte suspensions, indicating that PADSC NPs has favorable biological safety (Fig. S54 in Supporting information).
The immunological analyses were conducted to explore the potential immunotherapeutic mechanism. Tumor necrosis factor alpha (TNF-α) and interferon γ (IFN-γ) in the serum of mice after different treatments were detected by enzyme-linked immunosorbent assay. As shown in Figs. 4H and I, there was no significant difference in the levels of TNF-α and IFN-γ in the serum of mice treated with PBS and PCDSC NPs. However, the levels of TNF-α and IFN-γ in the DTC-Cu group increased, indicating that DTC-Cu can initiate an immune response. Due to the effective tumor accumulation of NPs and in situ production of DTC-Cu, PADSC NPs induced the highest cytokines secretion. The levels of TNF-α and IFN-γ in the serum of mice treated with PADSC NPs were 4.55- and 2.77-fold higher than those in control group, respectively. These results indicated that the PADSC NPs could effectively activate the immune system. Next, the activations of immune cells in tumor-draining lymph nodes (TDLNs) and tumor tissues were examined by FCM analysis. In the TDLNs of PADSC NPs treatment group, the mature DCs (CD11c+ CD80+ CD86+) was significantly increased (Fig. 4J and Fig. S55A in Supporting information). The DC maturation in the PADSC NPs group was 16.7% ± 0.7%, which was 2.53-fold higher than that of control group (6.6% ± 0.3%). The proportion of mature DCs within tumor tissues was also increased after the treatment of PADSC NPs (Fig. 4K and Fig. S55B in Supporting information), indicating that the in situ production of ICD inducer could effectively facilitate the maturation of DCs. By presenting tumor antigens to T lymphocytes via mature DCs, the activation and proliferation of cytotoxic T lymphocytes could be promoted, thereby initiating anti-tumor immune response. As shown in Figs. 4L and M and Figs. S55C and D (Supporting information), after the treatment of PADSC NPs, the CD8+ T cells (CD3+ CD8+) in TDLNs and tumors were 38.6% ± 2.5% and 34.5% ± 0.4%, respectively. The increased infiltration of CD8+ T cells indicated that the treatment of PADSC NPs could promote anti-tumor immune activation, thereby enhancing the efficacy of immunotherapy.
In conclusion, we have developed a Cu2+ competition-based nanomedicine to realize in situ production of ICD inducer. The nanomedicine was constructed by a hypoxia-responsive precursor and a Cu2+-quenched fluorophore (SQ-Cu). Under hypoxic tumor environment, the precursor could be activated to release DTC, which could undergo Cu2+ exchange with SQ-Cu, resulting in the in situ production of toxic DTC-Cu. Synchronously, the dissociation of complex compound SQ-Cu could lead to amplified fluorescence signal for visualization. The produced toxic DTC-copper complexes could induce potent antitumor immunity. Therefore, this study provided a promising hypoxia-activated nanomedicine and a Cu2+ exchange strategy to achieve monitorable production of ICD inducer. It should be noted that the low expression of azoreductases under normoxic conditions may still cause off-target activation, resulting in unnecessary pharmacological effects or toxicity. The long-term toxicity risk of this system should be further studied in the future. In addition, the damage of DTC-Cu to mitochondrial function may interfere with the tricarboxylic acid cycle and other key metabolic pathways, resulting in the imbalance of cellular metabolism. Future work will focus on investigating the specific mechanisms of anti-tumor effects.
Declaration of competing interest
The authors declare that they have no known competing financial interests or personal relationships that could have appeared to influence the work reported in this paper.
This work was supported by the National Natural Science Foundation of China (Nos. 82372100, 82402455, U24A20765), the National Key R&D Program of China (No. 2024YFA1210100), National University of Singapore (Nos. NUHSRO/2020/133/Startup/08, NUHSRO/2023/008/NUSMed/TCE/LOA, NUHSRO/2021/034/TRP/09/Nanomedicine, NUHSRO/2021/044/Kickstart/09/LOA, 23–0173-A0001), National Medical Research Council (Nos. MOH-001388–00, CG21APR1005, MOH-001500–00, MOH-001609–00), Singapore Ministry of Education (Nos. MOE-000387–00, MOE-MOET32023–004), and National Research Foundation (No. NRF-000352–00).
Supplementary materials
Supplementary material associated with this article can be found, in the online version, at doi:10.1016/j.cclet.2025.111404.
[1]
K. Yang, B. Bai, J. Lei, et al., J. Am. Chem. Soc. 146 (2024) 11679–11693. doi: 10.1021/jacs.3c14010
[2]
S. Qi, X. Zhang, X. Yu, et al., Adv. Mater. 36 (2024) 2311574. doi: 10.1002/adma.202311574
Figure 1
(A) Synthesis processes of PAD and PCD. (B) Schematic illustration of the copper ion nanoexchanger and its antitumor mechanism of in situ DTC-Cu production. (a) The Azo linker in hypoxia-responsive precursor can be cleaved through bioreduction in the presence of overexpressed azoreductase, leading to DTC release. (b) Due to DTC’s stronger ability to chelate Cu2+ than SQ, Cu2+ exchange will occur between DTC and SQ-Cu. (c) In situ produced DTC-Cu exerts antitumor effects due to upregulation of ROS level and accumulation of ubiquitinated proteins. (d) Meanwhile, Cu2+ exchange leads to SQ fluorescence recovery, allowing visualization of DTC-Cu production. (e) DTC-Cu-induced ICD triggers maturation of DCs. (f) The activated tumor-specific cytotoxic T cells results in potent antitumor immunity.
Figure 2In vitro Cu2+ exchange-induced DTC-Cu production and fluorescence recovery. (A) Fluorescence spectra of SQ upon addition of different metal ions. (B) Absorption spectra of different samples in acetonitrile. (C) Fluorescence spectra of SQ, DTC, SQ-Cu and SQ-Cu with addition of DTC. (D) Absorption spectra of PAD treated with different concentrations of Na2S2O4. (E) Mass spectrum of Na2S2O4-treated PAD upon addition of Cu2+. (F) Size distribution and TEM image (inset) of PADSC NPs (polydispersity index: 0.101). (G) Colloidal stabilities of PADSC NPs in water, PBS and culture medium with 10% FBS. (H) Absorption spectra of different samples. (I) Fluorescence spectra of PADSC NPs treated with different concentrations of Na2S2O4. Data are presented as mean ± standard deviation (SD) (n = 3).
Figure 3In vitro assess of hypoxia-triggered DTC-Cu production and antitumor effect of PADSC NPs. (A) Cytotoxicity of SQ and SQ-Cu (n = 4). (B) Cytotoxicity of DTC and DTC-Cu (n = 4). (C) Cytotoxicity of PAD NPs and PADSC NPs (n = 4). (D) CLSM images of different samples-treated 4T1 cells after DCFH-DA staining. Scale bar: 100 µm. (E) FCM analysis showing intracellular ROS generation caused by different samples. (F) FCM analysis showing GSH depletion caused by different samples. (G) Quantitative analysis of mature DCs (n = 3). All data are presented as mean ± SD. Statistical significance was determined using one-way ANOVA.
Figure 4In vivo antitumor activities of PADSC NPs. (A) Fluorescence images of 4T1 tumor-bearing mice after intravenously injection of NPs. (B) Integrated optical density (IOD) analysis of the tumor fluorescence signals at different times. (C) Ex vivo fluorescence images of major organs and tumor tissue at 36 h postinjection. H: heart; Lu: lung; S: spleen; Li: liver; K: kidneys; T: Tumor. (D) IOD analysis of the fluorescence signals of major organs and tumor tissue. (E) Tumor volume growth curves of different groups on the 4T1 tumor-bearing mice (n = 4). (F) The weight of the excised tumors of mice after treatments (n = 4). (G) H&E staining of tumor tissues after different treatments. Scale bar: 500 µm. (H, I) The levels of (H) TNF-α, and (I) IFN-γ in serum of mice after different treatments (n = 3). (J) Percentage of mature DCs in TDLNs. (K) Percentage of mature DCs in tumors. (L) Percentage of CD8+ T cells in TDLNs. (M) Percentage of tumor-infiltrating CD8+ T cells. All data are presented as mean ± SD. Statistical significance was determined using one-way ANOVA.

 DownLoad:

 下载:
下载:


 下载:
下载:
