Citation:
Chuangxin Zhang, Yunxia Wang, Ruipeng Li, Sirong Zhou, Liheng Feng. A multi-pronged approach to activate and amplify cGAS-STING for boosted photoimmunotherapy by drug-free nano-assembly[J]. Chinese Chemical Letters,
2026, 37(5): 111403.
doi:
10.1016/j.cclet.2025.111403
A multi-pronged approach to activate and amplify cGAS-STING for boosted photoimmunotherapy by drug-free nano-assembly
English
A multi-pronged approach to activate and amplify cGAS-STING for boosted photoimmunotherapy by drug-free nano-assembly
Received Date:
17 April 2025 Accepted Date:
03 June 2025 Revised Date:
30 May 2025 Available Online:
15 May 2026
Abstract:
The low tumor immunogenicity, high immunosuppressive microenvironment, and off-target toxicity severely limit the efficiency of the cyclic guanosine monophosphate-adenosine monophosphate synthase-stimulator of interferon genes (cGAS-STING) pathway that plays an important role in tumor immunotherapy. We herein develop a multifunctional nano-assembly with tumor targeting, double-stranded DNA (dsDNA) releasing, Mn2+ sensitizing and immune microenvironment reprogramming capabilities for improving cGAS-STING to bridge innate and adaptive immunity. The drug-free nano-assembly composed of organic AIE-type photosensitizer and MnO2 can improve the tumor immune microenvironment by consuming glutathione and producing oxygen in the presence of H2O2, concurrently enhancing the release of damaged dsDNA and sensitizing the cGAS by controlled release of Mn2+ to magnify cGAS-STING immunity. In vivo experiments reveal that the multi-mode synergistic activation of STING pathway at the headstream can not only damage the primary tumors to amplify innate immunity, but also facilitate the maturation of dendritic cells, infiltration of cytotoxic T lymphocytes and expansion of adaptive immunity to inhibit primary tumor metastasis and recurrence in the long term.
Immunotherapy is considered to be the most promising way to completely eliminate tumors [1,2]. However, due to malignant tumor heterogeneity, poor or lacking immunogenicity of some tumors and immunosuppressive microenvironment, "cold tumor" has brought new challenges to the cure of tumor diseases [3,4]. Most current immunotherapies aim at enhancing the adaptive branch of the immune system [5,6] and ignore the strong innate immunity that plays an indispensable role in the initiation, amplification, and mobilization of adaptive immunity [7,8]. The cyclic guanosine monophosphate (GMP)-adenosine monophosphate (AMP) synthase-stimulator of interferon genes (cGAS-STING) pathway, which is triggered by the signal of damaged double-stranded DNA (dsDNA), can serve as a bridge between the synergistic effects of innate and adaptive immune responses [9]. However, many reported STING agonists have the problems of non-targeting and rapid metabolism in vivo, limiting their further applications [10-12]. In addition, the tumor microenvironment including low oxygen, strong acidity, high glutathione (GSH) and H2O2 also inhibits the immune response induced by STING [13-18]. Therefore, multi-mode collaborative remodeling of immune microenvironment [19], efficient activation of cGAS-STING pathway to enhance innate immunity and cascade improvement of adaptive immunity are a promising approach to improve immunotherapy to fight tumors.
Photodynamic immunotherapy, integrating antitumor properties of photodynamic therapy (PDT) and immunotherapy, is developing rapidly because of outstanding characteristics of high spatiotemporal resolution, non-invasiveness, no drug resistance and continuous antitumor ability [20]. Photo-activated reactive oxygen species (ROS) can damage tumor DNA and other biomolecules, which induces tumor immunogenic cell death (ICD) to release immune-related factors, thereby triggering an antitumor immune response [8,21,22]. Unfortunately, PDT-induced ICD is usually low reactive to activate immune system due to insufficient damaged dsDNA and the hyposensitivity of cGAS. Hence, ensuring large amount of dsDNA and improving the sensitivity of cGAS to damaged dsDNA are two critical aspects to effectively activate cGAS-STING pathway. Recent studies have shown that Mn2+ can increase the sensitivity of cGAS to damaged dsDNA and lower the dsDNA threshold required for activation of the cGAS-STING pathway [22,23]. Therefore, the effective delivery and sufficient accumulation of Mn2+ to tumor sites without adverse effects is highly desired [24-27].
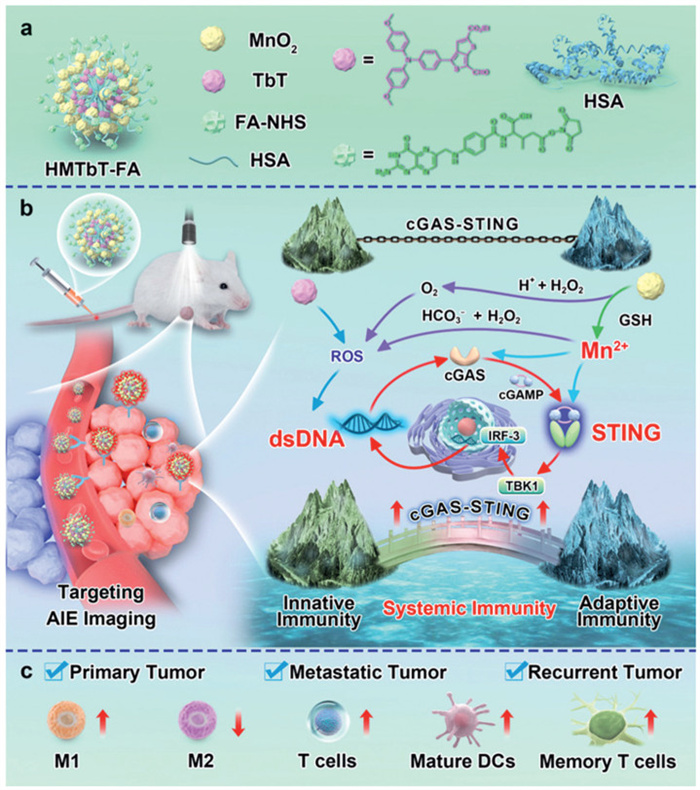
In this work, we propose the strategy of sensitizing the cGAS-STING pathway at the headstream to activate and enhance innate immunity followed by cascade amplifying adaptive immunity, and remodeling the tumor microenvironment to improve body's systemic immunity to tumors. Accordingly, a tailored nano-assembly (HMTbT-FA) with the functions of target enrichment, bioimaging, tumor killing, and immune-enhancement was constructed via a self-assembly mode. HMTbT-FA is composed of human serum albumin (HSA)/MnO2 nanosphere encapsulated with an organic photosensitizer comprised of triphenylamine and thieno[3,4-b]thiophen derivatives (termed as TbT) with aggregation-induced emission (AIE) features and modified with folate (FA) at the surface. HMTbT-FA actively targets tumor cells through overexpressed FA receptor and guides the antitumor treatment with AIE imaging in vitro and in vivo (Scheme 1). HMTbT-FA-mediated photo-immunotherapy has follow advantages: (1) Consuming GSH and generating O2 to alleviate the tumor immunosuppressive microenvironment and improve PDT effect; (2) controlled generating Mn2+ to activate the cGAS-STING pathway and improve ROS generation via Fenton-like reaction; (3) evoking strong systemic immunogenicity without adverse side effects of drug. In vitro and in vivo experiments demonstrate that the proposed strategy and developed nano-assembly effectively increase the "warmth" of "cold tumors" through dual immunity and improvement of the immunosuppressive microenvironment, promote the maturation and migration of dendritic cells (DCs), increase the proportion of M1 macrophages, and enhance the infiltration of cytotoxic T lymphocytes, paving a way for efficient suppression of primary, metastatic, and relapsed tumors.
Scheme 1
Scheme 1.
(a) The compositions and structure of nano-assembly HMTbT-FA. (b) Schematic mechanism diagram of HMTbT-FA-based photoimmunotherapy. (c) Inhibition of primary, metastatic and recurrent tumors by HMTbT-FA via regulating relevant factors.
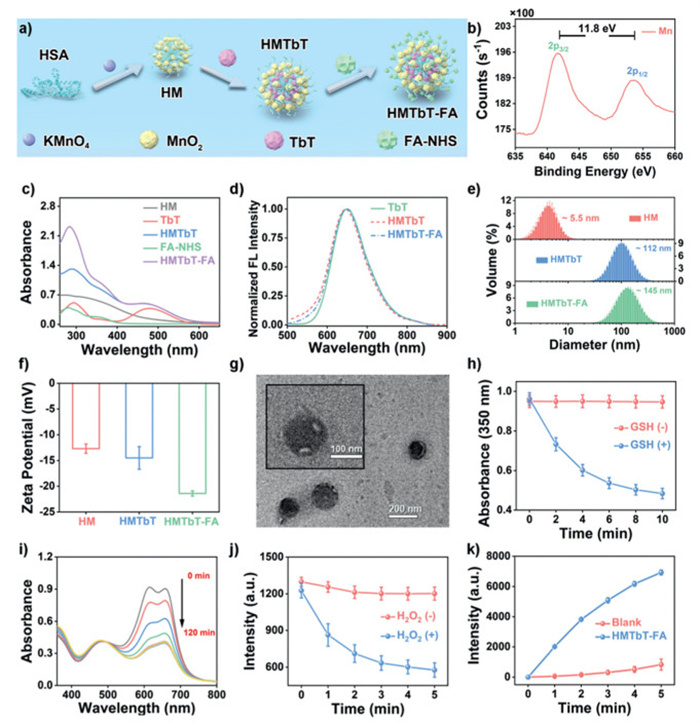
The donor-acceptor (D-A) type photosensitizer TbT has defined structure (Figs. S1–S3 in Supporting information) and is demonstrated to show strong absorption ranging from 400 nm to 600 nm (Fig. S4 in Supporting information) and typical AIE feature without worrying about aggregation-caused quenching (ACQ) of fluorescence or ROS loss (Fig. S5 in Supporting information). TbT was encapsulated into MnO2-contained HSA (HM) via hydrophobic interactions followed by covalent modification of FA on the surface to obtain the multifunctional nano-assembly HMTbT-FA. The introduction of FA is helpful to allow nano-assemblies to target and accumulation in tumors, thus reducing damages to normal cells. According to the previously reported KMnO4 reduction method [28], the manipulation process of HMTbT-FA was illustrated in Fig. 1a. The X-ray photoelectron spectroscopy (XPS) showed two characteristic spin orbit peaks of Mn(Ⅳ) 2p1/2 and Mn(Ⅳ) 2p3/2, with spin-orbit splitting distance of ~11.8 eV (Fig. 1b). In addition, the broad peak appeared near 350 nm came from the plasma band on the surface of MnO2 also indicated KMnO4 was successfully reduced to MnO2 (Fig. S6 in Supporting information) [29,30]. The loading rate of HSA in HM was determined to be 74.8% (Fig. S7 in Supporting information). The characteristic absorption peak at 475 nm of TbT confirmed the successful loading of TbT in HMTbT (without modification of FA) and the loading ratio was calculated to be 56.6% (Fig. S8 and Table S1 in Supporting information). Similarly, the characteristic absorption peak of FA at 285 nm with a shoulder peak at 355 nm indicated that FA was also successfully modified on HMTbT (Fig. 1c). With the AIE feature of TbT, HMTbT-FA presented a superior near-infrared fluorescence emission (λmax = 650 nm) (Fig. 1d), which was beneficial for the imaging-guided treatment. Dynamic light scattering (DLS) measurement demonstrated that the hydrodynamic diameters of HM, HMTbT and HMTbT-FA were 5.5, 112 and 145 nm, respectively (Fig. 1e). The corresponding zeta potentials were measued as −12.7, −14.5 and −21.4 mV, respectively (Fig. 1f). The reduction of positive amino groups of HSA and the presence of negatively charged residues in FA might endow HMTbT-FA with increased negative charges [31]. Transmission electron microscope (TEM) measurement indicated HMTbT-FA possessed a uniform spherical shape (Fig. 1g), and HMTbT-FA displayed good structural stability after storage for two months (Fig. S9 in Supporting information).
Figure 1
Figure 1.
(a) Schematic diagram of synthesis process of HMTbT-FA. (b) X-ray photoelectron spectroscopy of HM. (c) UV-vis absorption spectra. (d) Normalized fluorescence spectra. (e) Hydrodynamic diameters and (f) zeta potentials of different assemblies. (g) TEM image of HMTbT-FA. (h) The reactivity of HMTbT-FA to GSH. (i) The reactivity of HMTbT-FA to H2O2. (j) O2 generation of HMTbT-FA incubated with H2O2. (k) Total ROS generation. Data are presented as mean ± standard deviation (SD) (n = 3).
Since MnO2 can react with GSH or H2O2 to produce Mn2+ or O2 [32], then the reactivity of MnO2-encapsulated HMTbT-FA was examined by monitoring the absorption spectra. As shown in Fig. 1h and Fig. S10 (Supporting information), the decreased absorbance at 350 nm indicated the decomposition of MnO2 in the presence of GSH. The significantly decreased absorption intensity of methylene blue (MB, a sensor of •OH) verified the Fenton-like reaction between MnO2 and H2O2 (Fig. 1i and Fig. S11 in Supporting information) [33]. The presence of FA may induce the peak shape changes of MB. Additionally, the fluorescence intensity of Ru(dpp)3Cl2 (an indicator of O2) at 630 nm was gradually decreased in the presence of H2O2 (Fig. 1j), indicating the generatino of O2 that was favorable for improving therapeutic efficiency of PDT [34]. Since TbT was encapsulated in HMTbT-FA, 2′, 7′-dichlorodihydrofluorescein diacetate (DCFH-DA) was used to determine the ROS generation ability of HMTbT-FA under light conditions. As shown in Fig. 1k, rapid fluorescence increase under light irradiation indicated the generation of ROS from HMTbT-FA. By employing several commercial probes of different types of ROS, photoexcited HMTbT-FA was examined to mainly produce 1O2, H2O2, and •OH with very little •O2− (Fig. S12 in Supporting information). Considering that MnO2 can consume GSH and release •OH and O2, the combination of MnO2 and TbT would amplify the ROS generation ability of HMTbT-FA.
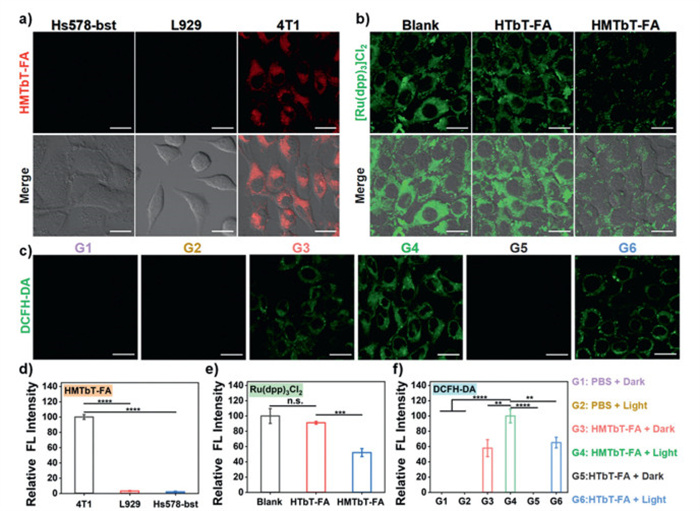
Compared with normal cells, many solid tumors (ovarian, lung and breast) cells highly express FA receptor α (FRα) [35], which can be recognized by FA. Then 4T1 cells (breast cancer) were used as model cells to evaluate the targeting ability of HMTbT-FA by detecting near-infrared (NIR) fluorescence of nanoassembly via confocal laser scanning microscopy (CLSM). As shown in Figs. 2a and d, 4T1 cells showed obvious red fluorescence, while normal cells L929 and Hs578-bst displayed little fluorescence after incubation with HMTbT-FA. It indicated that synthesized HMTbT-FA could selectively target tumor cells. Besides insufficient intake, hypoxia microenvironment of tumor is another factor to decrease efficiency of PDT and immunotherapy [36]. To demonstrate HMTbT-FA could circumvent the hypoxic situation by generating O2, Ru(dpp)3Cl2 was used to detect the O2 generation in the 4T1 cells after treatment of HMTBT-FA and very weak green luminescence was found (Figs. 2b and e). Hence, HMTbT-FA has a great potential to alleviate the anoxic tumor microenvironment to enhance therapeutic effect of PDT and the infiltration of T lymphocytes.
Figure 2
Figure 2.
(a) CLSM images of different cells after treatment of HMTbT-FA. (b) Hypoxia degree detection of tumor cells after different treatments for 24 h. (c) Intracellular ROS detection after various treatments. (d–f) The relative fluorescence intensity of fluorescence fields in (a–c). Scale bar: 20 µm. Data are presented as mean ± SD (n = 3). **P < 0.01, ***P < 0.001, ****P < 0.0001. n.s., no significance.
Since HMTbT-FA could self-supplement O2, its ROS generation in hypoxic tumor cells was next investigated. As depicted in Figs. 2c and f, 4T1 cells in irraidiated HMTbT-FA (G4) group showed the most ROS generation (brightest green fluorescence) due to the Fenton-like reaction of released Mn2+ and O2 self-supplementing photocatalytic process. Then, the intracellular ROS in G4 was further verified to be H2O2, •OH and 1O2− by using different type of ROS probes (Fig. S13 in Supporting information), which was consistent with the results that in solution level. Meanwhile, the more 1O2 generation of irradiated HMTbT-FA than irradiated TbT (G6) demonstrated the advantage of O2 supplement by MnO2. This also explained why G4 showed the highest ROS level detected by DCFH-DA. The above results indicated that HMTbT-FA could effectively produce massive ROS in tumor cells under light irradiation by self-supplying oxygen and synergistically working with Fenton-like reaction.
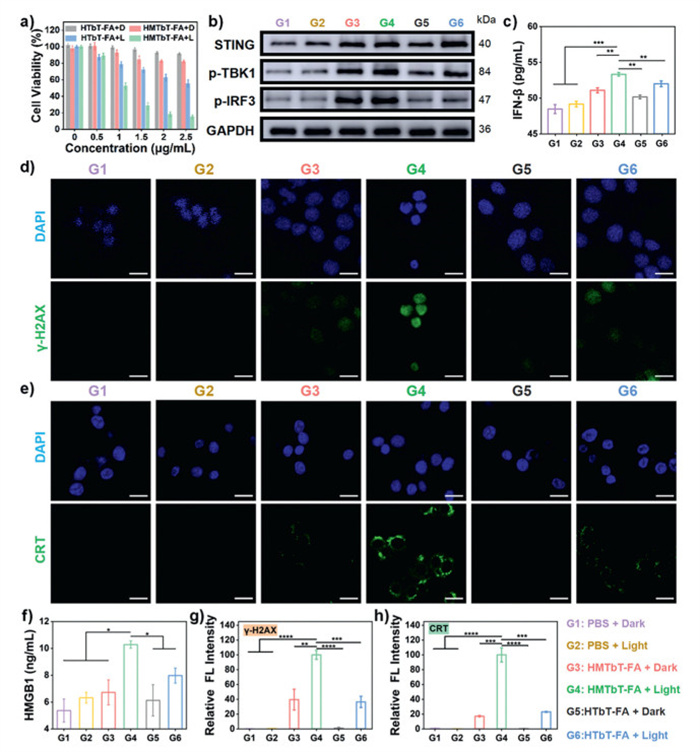
Based on the MTT assay, irradiated HMTbT-FA (2.5 µg/mL) displayed the strongest cytotoxicity to 4T1 cells with inhibition efficiency of about 90% due to the synergistic effect of chemodynamic therapy (CDT) mediated by Mn2+ and PDT mediated by TbT (Fig. 3a), which was also verified by the live and dead staining results (Fig. S14 in Supporting information). It needed 3 times dosage for HTbT-FA (without MnO2) to achieve the same inhibitory effect (Fig. S15 in Supporting information), illustrating the advantage of the synergistic effect of CDT and PDT. The similar inhibitory effect against 4T1 cells under normoxic conditions highlighted the advantage of HMTbT-FA in overcoming the limitation of oxygen deficiency (Fig. S16 in Supporting information). However, HMTbT-FA had no significant effect on the growth of normal cells (L929) no matter with light irradiation or not (Fig. S17 in Supporting information). Considering that damaged dsDNA can be sensed by cGAM to activate STING pathway and Mn2+ can enhance the sensitization of cGAM's ability to perceive dsDNA and amplify the production of interferon-β (IFN-β) [23], the HMTbT-FA with ROS and Mn2+ generation is supposed to trigger the STING pathway. As shown in Figs. 3d and g, the strong green fluorescence of γ-H2AX probe (marker of DNA damage) was observed in cells only in G4 group, indicating the most severe damage degree of dsDNA. The expression level of relevant proteins of cGAS-STING pathway including STING, phosphorylated TANK-binding kinase 1 (p-TBK1), and phosphorylated-interferon regulatory factor 3 (p-IRF3) were highly expressed in G4 group, confirming the Mn2+ amplified STING signals (Fig. 3b). The highest IFN-β expression levels in G4 group was consistent with the result of Western blot (WB) analysis (Fig. 3c). In addition, the expression levels of both calreticulin (CRT) and high mobility group protein B1 (HMGB1) were the highest in G4 group (Figs. 3e, f and h). These results demonstrated that HMTbT-FA could not only expand cGAS-STING pathway in tumor cells and further amplify IFN-β production, but also effectively induce ICD in vitro.
Figure 3
Figure 3.
(a) Cell viability of hypoxic 4T1 cells via MTT assay. (b) Expression of cGAS-STING pathway-associated proteins and (c) IFN-β in 4T1 cells. (d) Representative CLSM images of DNA damage marker γ-H2AX and (e) CRT exposure in 4T1 cells. (f) Expression level of HMGB1 in 4T1 cells. (g) Relative fluorescence intensity of γ-H2AX according to (d). (h) Relative fluorescence intensity of CRT according to (e). Scale bar: 20 µm. Data are presented as mean ± SD (n = 3). *P < 0.05, **P < 0.01, ***P < 0.001, ****P < 0.0001. DAPI, 4′, 6-diamidino-2-phenylindole; GAPDH, glyceraldehyde-3-phosphate dehydrogenase.
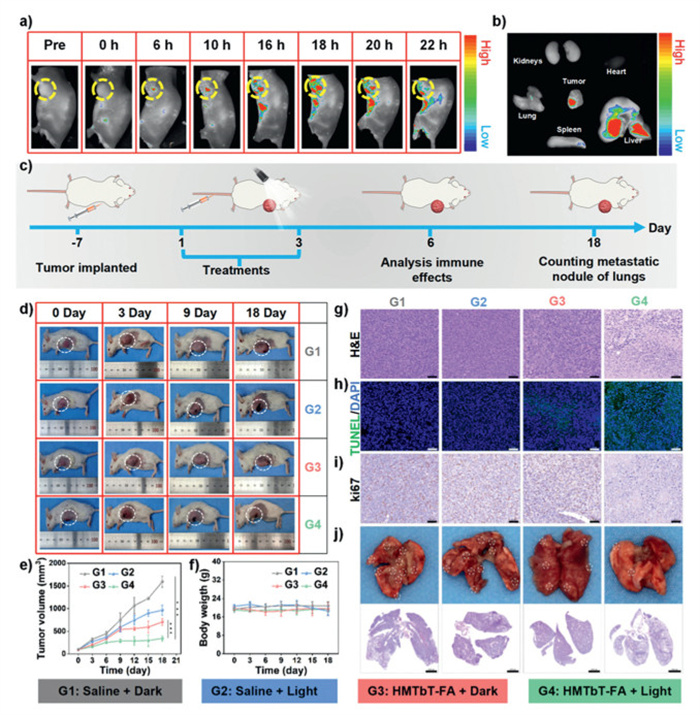
The tumor-bearing BALB/c mice model was established by subcutaneous implantation of 4T1 tumor cells. All animal experiment was approved by the Institutional Animal Care and Use Committee of Yishengyuan Gene Technology (Tianjin, China) Co., Ltd. By intravenous injection of HMTbT-FA via tail vein, the fluorescence intensity changes at the tumor site indicated HMTbT-FA could target and be enriched most in tumor sites at 18 h post injection (Fig. 4a). Ex vivo fluorescence imaging of major organs and tumors of mice at 24 h after injection indicated that HMTbT-FA mainly located in liver and tumor (Fig. 4b), also suggesting the good tumor targeting ability of HMTbT-FA in living mice. Schematic illustration of treatment schedule was listed in Fig. 4c. The white light irradiation (15 mW/cm2, 10 min) was performed on days 1, 2, and 3 at the optimal time of tumor enrichment (18 h) after intravenous injection of nano-assemblies. As shown in Figs. 4d and e, the growth of tumors in G4 group was obviously inhibited, while those in other groups gradually became bigger as time went. Hematoxylin-eosin (H&E) staining images of extracted tumor tissues showed that there was significant nuclear fragmentation in G4 group (Fig. 4g). Terminal deoxynucleotidyl transferase-mediated dUTP-biotin nick end labeling (TUNEL) staining also indicated an obvious increase of apoptotic cells in tumor tissues of G4 group (Fig. 4h). Meanwhile, Ki67 staining analysis displayed the cell proliferation in tumor was effectively inhibited in G4 group (Fig. 4i), which was consistent with the result in Fig. 4e. By analyzing the metastatic nodules in lungs (Fig. 4j), the G4 group showed the least nodules in lungs compared to other groups, indicating the powerful immune effect of HMTbT-FA against tumor. Importantly, all mice behaved normally throughout the treatment period, without significant weight changes (Fig. 4f) or abnormal blood markers (Fig. S18 in Supporting information). And no significant damage was observed in H&E staining of major organs of mice (Fig. S19 in Supporting information). Hemolysis test indicated HMTbT-FA did not induce hemolysis phenomenon (Fig. S20 in Supporting information). All these results demonstrated that HMTbT-FA-mediated treatment mode could effectively inhibit both primary and metastatic tumors of mice with good biosafety.
Figure 4
Figure 4.
(a) NlR fluorescence bioimaging of 4T1 tumor after intravenous injection of HMTbT-FA. (b) Ex vivo fluorescence imaging of tumors and major organs. (c) Schematic presentation of treatment schedule. (d) Representative photographs of 4T1 tumor-bearing mice. (e) Tumor growth curves and (f) average body weight of mice. (g) H&E images, (h) TUNEL staining, and (i) immunohistochemistry images of Ki67 of primary tumors. (j) Photographs and H&E staining images of lung tissue. Scale bar: 50 µm (g–i), 2000 µm (j). Data are presented as mean ± SD (n = 3). ***P < 0.001.
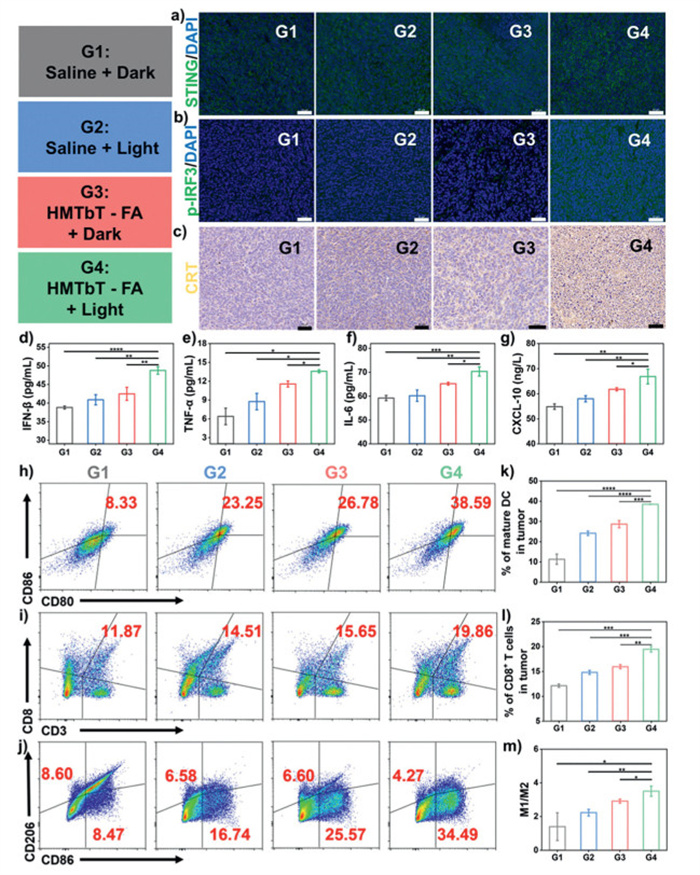
The changes of relevant immune indexes in the primary tumor on the sixth day during treatment were investigated to verify the activation of immune system in living mice. As shown in Figs. 5a and b, the corresponding fluorescence (green) of STING and p-IRF-3 in G4 group was particularly pronounced compared to the other groups. Meanwhile, CRT protein expression (brown) of G4 group was significantly stronger than that of other groups (Fig. 5c). In addition, the levels of IFN-β, tumor necrosis factor-α (TNF-α), interleukin-6 (IL-6) and C-X-C motif chemokine ligand 10 (CXCL-10) in peripheral blood of mice in G4 were higher than other groups (Figs. 5d–g). These results suggested that HMTbT-FA effectively activated cGAS-STING pathway in vivo and successfully induced ICD. The cGAS-STING pathway could promote the polarization of macrophages, maturation of DCs, and infiltration of T cells to selectively kill tumor cells. As shown in Figs. 5h–m, compared with G1 group, the maturity of DC of G4 rose from 8.33% to 38.59%, and the proportion of M1 macrophages rose from 8.47% to 34.49%. As expected, based on T cell activation by mature DC, the proportion of effector T cells was elevated from 11.87% to 19.86%. These data suggested that HMTbT-FA effectively evoked innate and adaptive immunities through cGAS-STING to ICD processes, resulting in powerful tumor suppression effect.
Figure 5
Figure 5.
Immunofluorescence images of (a) STING and (b) p-IRF3 in 4T1 tumors, respectively (blue: DAPI; green: STING or p-IRF3). (c) Immunohistochemistry images of CRT. (d–g) Levels of IFN-β, TNF-α, IL-6, and CXCL-10 in serum. (h) The percentage of mature DCs populations (CD80+, CD86+) within tumors. (i) Flow cytometry analysis of CD8+ T cells gating on CD3+ cells within tumors. (j) Representative flow cytometry plots of macrophage polarization (CD45+, CD86+, CD206−) within tumors. (k–m) Quantitative analysis of above cell subsets in (h–j). Scale bar: 50 µm. Data are presented as mean ± SD (n = 3). *P < 0.05, **P < 0.01, ***P < 0.001, ****P < 0.0001.
Since preventing the tumor recurrence after treatment is critical for life saving, the immune responses of HMTbT-FA for long-term countermeasures ability against recurrent tumors were next investigated (Fig. S21 in Supporting information). The specific treatment schedule was listed in Fig. S21a. After antitumor treatments, the primary tumors of mice were removed by surgery and re-implanted 4T1 tumor cells on the opposite side of mice with monitoring the proportion of memory T cells in the spleen. The weight of mice had no obvious changes during the whole treatment process (Fig. S21b). The growth curves of primary tumors in G4 group were significantly slower than that of other groups (Fig. S21c). Moreover, without any additional treatment, the rechallenged tumors were mostly unable to form in G4 group (Figs. S21d and e). In contrast, secondary implanted tumors in other groups had a rapid growth. Furthermore, the effective inhibition effect in G4 was demonstrated be a result of high proportion of effector memory T cells (TEM cells) generated in spleen (Figs. S21f and g). Hence, HMTbT-FA can not only inhibit primary tumor growth, but also turn primary tumors into vaccines to prevent the recurrence of tumor after surgery, showing powerful dual-functions of treatment and prevention.
In this study, a tailored HMTbT-FA nano-assembly with multifunction of in vivo targeting, imaging, PDT, CDT, TME regulation and vaccine effect were successfully prepared. The integration of AIE-featured TbT and MnO2 was demonstrated to remodel the tumor microenvironment and further amplify the intracellular oxidative stress by consuming reductive GSH and generating boosted ROS with O2 supplement. Such huge oxidative stress induced ICD of tumor cells and generated a mass of damaged dsDNA to active cGAS-STING pathway in vitro or in vivo. Generating Mn2+ effectively sensitized cGAS-STING to enhance innate immunity and promote adaptive immunity. Finally, HMTbT-FA was applied in the imaging-guided therapy of tumor-bearing mice with superior antitumor effect on both primary and metastatic tumors by activating strong systemic immune response with good biosafety. Furthermore, the HMTbT-FA-mediated phototherapy also effectively inhibited the recurrent of tumor. In short, the work will potentially expand the treatment window and unlock the promise of systemic STING pathway, and present an innovative strategy and platform for cancer immunotherapy.
Declaration of competing interest
The authors declare that they have no known competing financial interests or personal relationships that could have appeared to influence the work reported in this paper.
The authors acknowledge support from the National Natural Science Foundation of China (Nos. 22177065, U21A6004, and 52302102), Science and Technology Major Project of Shanxi (No. 202101030201022), Fundamental Research Program of Shanxi Province (Nos. 202303021212010, 202403021212031), and the Central Guide Local Science and Technology Development Found Project of Shanxi Provincial (No. YDZJSX2022A003).
Supplementary materials
Supplementary material associated with this article can be found, in the online version, at doi:10.1016/j.cclet.2025.111403.
[1]
L. Galluzzi, A. Buqué, O. Kepp, et al., Nat. Rev. Immunol. 17 (2017) 97-111. doi: 10.1038/nri.2016.107
J. Yan, G.H. Wang, L.X. Xie, et al., Adv. Mater. 34 (2022) 2105783. doi: 10.1002/adma.202105783
[25]
M. Gao, Y.Q. Xie, K.W. Lei, et al., Adv. Therap. 4 (2021) 2100065.
[26]
X.Y. Xu, H.H. Fan, Y. Yang, et al., Angew. Chem. Int. Ed. 62 (2023) e202303010. doi: 10.1002/anie.202303010
[27]
H.J. Zhang, C.L. Liang, X.Y. Ding, et al., Chin. Chem. Lett. 36 (2025) 110525. doi: 10.1016/j.cclet.2024.110525
[28]
B. Xiao, X.X. Zhou, H.X. Xu, et al., ACS Nano 12 (2018) 12682-12691. doi: 10.1021/acsnano.8b07584
[29]
W.W. Zhu, Z.L. Dong, T.T. Fu, et al., Adv. Funct. Mater. 26 (2016) 5490-5498. doi: 10.1002/adfm.201600676
[30]
S.K. Rajendrakumar, V. Revuri, M. Samidurai, A. Mohapatra, et al., Nano Lett. 18 (2018) 6417-6426. doi: 10.1021/acs.nanolett.8b02785
[31]
A. Akbarian, M. Ebtekar, N. Pakravan, Z.M. Hassan, Int. J. Biol. Macromol. 152 (2020) 90-101. doi: 10.1016/j.ijbiomac.2020.02.106
[32]
K. Zhang, C. Qi, K.Y. Cai, Adv. Mater. 35 (2023) 2205409.
[33]
L.S. Lin, J.B. Song, L. Song, et al., Angew. Chem. Int. Ed. 57 (2018) 4902-4906. doi: 10.1002/anie.201712027
[34]
Z.F. Ma, X.D. Jia, J. Bai, et al., Adv. Funct. Mater. 27 (2017) 1604258. doi: 10.1002/adfm.201604258
[35]
X.W. Chang, X.Y. Tang, J. Liu, et al., Adv. Funct. Mater. 33 (2023) 2303596. doi: 10.1002/adfm.202303596
[36]
Z.T. Li, Y.Y. Deng, H.H. Sun, et al., J. Control. Release 358 (2023) 579-590.
Scheme 1
(a) The compositions and structure of nano-assembly HMTbT-FA. (b) Schematic mechanism diagram of HMTbT-FA-based photoimmunotherapy. (c) Inhibition of primary, metastatic and recurrent tumors by HMTbT-FA via regulating relevant factors.
Figure 1
(a) Schematic diagram of synthesis process of HMTbT-FA. (b) X-ray photoelectron spectroscopy of HM. (c) UV-vis absorption spectra. (d) Normalized fluorescence spectra. (e) Hydrodynamic diameters and (f) zeta potentials of different assemblies. (g) TEM image of HMTbT-FA. (h) The reactivity of HMTbT-FA to GSH. (i) The reactivity of HMTbT-FA to H2O2. (j) O2 generation of HMTbT-FA incubated with H2O2. (k) Total ROS generation. Data are presented as mean ± standard deviation (SD) (n = 3).
Figure 2
(a) CLSM images of different cells after treatment of HMTbT-FA. (b) Hypoxia degree detection of tumor cells after different treatments for 24 h. (c) Intracellular ROS detection after various treatments. (d–f) The relative fluorescence intensity of fluorescence fields in (a–c). Scale bar: 20 µm. Data are presented as mean ± SD (n = 3). **P < 0.01, ***P < 0.001, ****P < 0.0001. n.s., no significance.
Figure 3
(a) Cell viability of hypoxic 4T1 cells via MTT assay. (b) Expression of cGAS-STING pathway-associated proteins and (c) IFN-β in 4T1 cells. (d) Representative CLSM images of DNA damage marker γ-H2AX and (e) CRT exposure in 4T1 cells. (f) Expression level of HMGB1 in 4T1 cells. (g) Relative fluorescence intensity of γ-H2AX according to (d). (h) Relative fluorescence intensity of CRT according to (e). Scale bar: 20 µm. Data are presented as mean ± SD (n = 3). *P < 0.05, **P < 0.01, ***P < 0.001, ****P < 0.0001. DAPI, 4′, 6-diamidino-2-phenylindole; GAPDH, glyceraldehyde-3-phosphate dehydrogenase.
Figure 4
(a) NlR fluorescence bioimaging of 4T1 tumor after intravenous injection of HMTbT-FA. (b) Ex vivo fluorescence imaging of tumors and major organs. (c) Schematic presentation of treatment schedule. (d) Representative photographs of 4T1 tumor-bearing mice. (e) Tumor growth curves and (f) average body weight of mice. (g) H&E images, (h) TUNEL staining, and (i) immunohistochemistry images of Ki67 of primary tumors. (j) Photographs and H&E staining images of lung tissue. Scale bar: 50 µm (g–i), 2000 µm (j). Data are presented as mean ± SD (n = 3). ***P < 0.001.
Figure 5
Immunofluorescence images of (a) STING and (b) p-IRF3 in 4T1 tumors, respectively (blue: DAPI; green: STING or p-IRF3). (c) Immunohistochemistry images of CRT. (d–g) Levels of IFN-β, TNF-α, IL-6, and CXCL-10 in serum. (h) The percentage of mature DCs populations (CD80+, CD86+) within tumors. (i) Flow cytometry analysis of CD8+ T cells gating on CD3+ cells within tumors. (j) Representative flow cytometry plots of macrophage polarization (CD45+, CD86+, CD206−) within tumors. (k–m) Quantitative analysis of above cell subsets in (h–j). Scale bar: 50 µm. Data are presented as mean ± SD (n = 3). *P < 0.05, **P < 0.01, ***P < 0.001, ****P < 0.0001.

 DownLoad:

 下载:
下载:


 下载:
下载:
