BMI Center for Biomass Materials and Nanointerfaces, National Engineering Laboratory for Clean Technology of Leather Manufacture, Ministry of Education Key Laboratory of Leather Chemistry and Engineering, College of Biomass Science and Engineering, Sichuan University, Chengdu 610065, China
b.
Department of Biomedical Engineering, Southern University of Science and Technology, Shenzhen 518055, China
c.
State Key Laboratory of Polymer Materials Engineering, Sichuan University, Chengdu 610065, China
junling.guo@ubc.ca (J. Guo). 1 These authors contributed equally to this work.
Received Date:
24 February 2025 Accepted Date:
20 May 2025 Revised Date:
19 May 2025 Available Online:
15 May 2026
Abstract:
The escalating threat of antimicrobial resistance necessitates advanced tools for rapid and selective antibiotic detection in environmental systems. Herein, we report polyphenol-derived carbon dots (P-CDs) synthesized via a one-step solvothermal method using polyphenols and citric acid, enabling dual-mode detection of tetracyclines and quinolones through pH-tunable fluorescence. The P-CDs exhibit distinct fluorescence quenching for tetracyclines (e.g., oxytetracycline (OTC)) and enhancement for quinolones (e.g., norfloxacin (NOR)), driven by synergistic multiple molecular interactions facilitated by surface phenolic groups. With detection limits of 8.19 µmol/L (OTC) and 5.27 µmol/L (NOR), P-CDs achieve 6-fold higher sensitivity compared to conventional carbon dots. Their pH adaptability (pH 2–12), specificity (> 90% selectivity against seven antibiotic classes), and robust performance in real water matrices (e.g., river water and wastewater) underscore their potential as eco-friendly sensors for on-site environmental monitoring. This work highlights a versatile platform to address antibiotic contamination and advance public health safety.
Antibiotics, essential for treating bacterial infections, are extensively utilized across biomedicine, agriculture, and aquaculture [1,2]. The widespread application has led to the accumulation and circulation of antibiotics in various aquatic environments, including rivers, lakes, and groundwater [3-6]. Such contamination disrupts ecosystems and exacerbates the development of resistant bacterial strains, thereby intensifying the challenges associated with antimicrobial resistance [7,8].
The detection of antibiotics in aquatic environments is crucial for assessing their distribution and potential ecological impact, where highly sensitive and specific methods are necessary due to their presence at low concentrations [9-12]. The complexity of water matrices, such as the variations in pH and polarity, can further complicate the detection. While accurate, conventional chromatographic techniques are labor-intensive and time-consuming, limiting their efficiency. The requirements for expensive facilities also restrict their broad application for rapid and on-site detection [13-15].
Fluorometric detection is pivotal for analyte sensing due to its exceptional sensitivity, enabling precise detection of trace biomarkers, rapid response for real-time analysis, and user-friendly protocols adaptable to diverse settings [16]. The action mechanism relies on the fluorescent probes emitting fluorescence upon excitation at specific wavelengths, followed by binding with the targeted analytes to enhance or quench the fluorescence [17,18]. The change in fluorescence intensity is proportional to the concentration of the analytes. Carbon dots (CDs) represent a revolutionary class of fluorophores, distinguished by their intense, tunable emission, biocompatibility, and minimal toxicity, facilitating safety in vivo use [19-21]. Their robust aqueous stability ensures reliable performance under physiological conditions, while straightforward synthesis such as hydrothermal processing supports scalable production [22,23]. Although pristine CDs exhibit modest surface group diversity, strategic functionalization enhances their binding efficacy, positioning them as versatile, high-performance sensors for antibiotic detection and beyond [24-27].
Plant polyphenols are naturally occurring secondary metabolites found in fruits, vegetables, and cereals, rich in catechol or galloyl groups (phenolic groups). Polyphenol-derived nanostructures have been demonstrated that can rapidly attach to versatile substrate surfaces or modify interfaces in a surface-agnostic manner [28-35]. The intrinsic adhesive properties enable polyphenols to interact with various antibiotics for efficient removal through multiple molecular interactions (e.g., hydrogen bonding, π-π stacking, and electrostatic interactions) [36,37]. These inspire the surface modification of CDs with polyphenols for enhancing the surface functional group diversity and density, boosting the synergistic multiple interactions with antibiotics, and integrating the tunable pH adaptability in complex water matrices to promote sensitivity and compatibility for practical antibiotic detection.
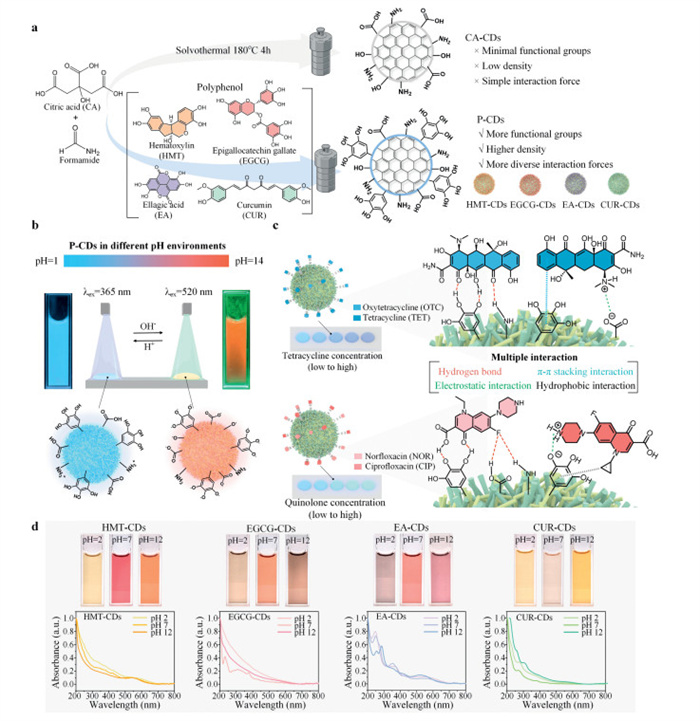
Herein, we integrated polyphenols into the conventional CD precursors and obtained polyphenol-functionalized CDs (referred to as polyphenol-CDs, P-CDs) for the selective detection of quinolone and tetracycline antibiotics in various aqueous environments. P-CDs were synthesized via a solvothermal method with the different polyphenols (e.g., epigallocatechin gallate (EGCG), ellagic acid (EA), curcumin (CUR), and hematoxylin (HMT)) with citric acid (CA) in a formamide solvent (Fig. 1a), where the four polyphenols contain different degrees of π-conjugated structures. The resulting P-CDs possess distinct colors over a wide pH range and exhibit pH-tunable fluorescence, enabling dual-mode antibiotic detection (Figs. 1b-d). As the multiple molecular interactions of phenolic groups assist the binding of antibiotics, especially tetracyclines and quinolones, these P-CDs achieve ultrahigh sensitivity (detection limits of 8.19 µmol/L for tetracycline and 5.27 µmol/L for norfloxacin (NOR)) and exceptional selectivity (> 90% specificity against 7 antibiotic classes), outperforming traditional CDs by 6-fold. The pH-responsive behavior (pH 2–14) and robust performance in real water matrices (e.g., river water and wastewater) underscore their potential as versatile, eco-friendly sensors for rapid on-site monitoring of antibiotic contaminants, advancing environmental and health safety applications.
Figure 1
Figure 1.
Polyphenol enriches the surface functionalization of CDs and achieves selective antibiotic detection. (a) Schematic of the preparation of P-CDs. (b) pH-dependent fluorescence of P-CDs. (c) Schematic of the selective and specific detection of antibiotics by P-CDs. (d) Photographs of the P-CDs under different pH conditions and the corresponding UV–vis absorption spectra.
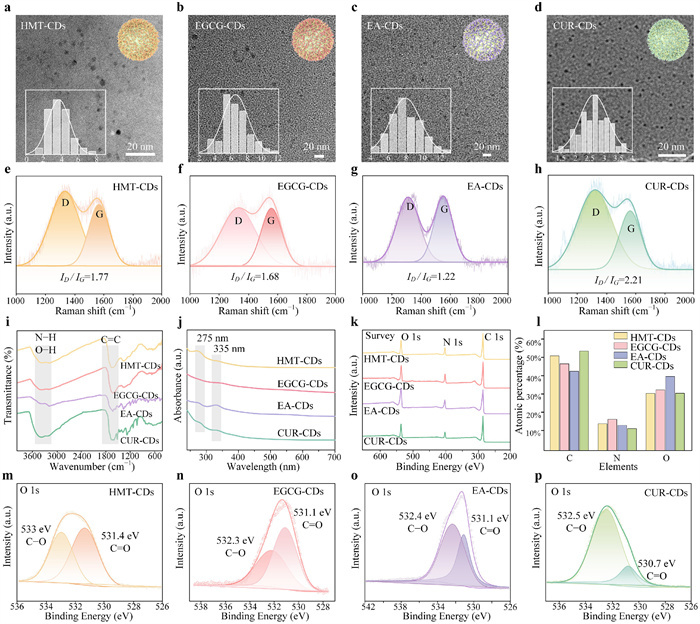
To achieve the surface functionalization of conventional CA-based CDs (CA-CDs), we employed a range of polyphenol molecules of different structures, including EGCG, EA, CUR, and HMT, as precursors mixed with CA in formamide for solvothermal treatment. The prepared CDs in aqueous solution exhibited pH-dependent color, where darker colors were observed at alkaline conditions compared with acidic conditions (Fig. 1d). Transmission electron microscopy (TEM) images revealed the monodispersed spherical dots of the prepared P-CDs, where the diameters varied with the structures of the polyphenols (Figs. 2a-d). Specifically, the average diameters of the P-CDs derived from different polyphenols were as follows: 6 nm for EGCG-CDs, 7 nm for EA-CDs, 2.7 nm for CUR-CDs, and 4 nm for HMT-CDs. Notably, the high-resolution TEM (HR-TEM) images of EA-CDs displayed distinct lattice fringes with a spacing of 0.24 nm, suggesting the formation of a graphite core. This feature can be attributed to the inherent structural symmetry and the planarity of the EA molecule (Fig. S1 in Supporting information). In comparison, EGCG-CDs, CUR-CDs, and HMT-CDs showed overall amorphous characteristics, which can be attributed to the higher content of sp3 carbons in these polyphenol molecules. X-ray diffraction (XRD) spectra of different P-CDs also illustrated a similar result, where EA-CDs exhibited distinct crystallized peaks, whereas the other three P-CDs presented as generally amorphous (Fig. S2 in Supporting information).
Figure 2
Figure 2.
Characterization of P-CDs. (a-d) TEM images of HMT-CDs, EGCG-CDs, EA-CDs, and CUR-CDs, with the inset showing the particle size distribution statistics (n = 100). (e-h) Raman spectroscopy of P-CDs derived from different polyphenol sources. (i) FTIR characterization of P-CDs. (j) UV–vis absorption spectra of P-CDs. (k) XPS survey spectrum of P-CDs. (l) Elemental analysis data of P-CDs. (m-p) XPS O 1s spectra of P-CDs.
Raman spectra elucidated the graphitic nature of the synthesized P-CDs. Distinct vibrational modes were identified, including the D band at 1340 cm−1 (A1g symmetry) corresponding to sp3-hybridized carbon at disordered edges or lattice defects, and the G band at 1596 cm−1 (E2g symmetry), attributed to in-plane stretching vibrations of sp2-bonded carbon in graphitic domains (Figs. 2e-h). The coexistence of these bands confirms a sectional disordered graphitic structure across all P-CDs, where short-range graphitic order is interspersed with amorphous, defect-rich regions. The degree of graphitization was quantified by the ID/IG ratio, which inversely correlates with the structural coherence of sp2 carbon networks [38]. EA-CDs exhibited the lowest ID/IG ratio (1.22), indicative of a larger sp2 crystallite size and reduced defect density compared to EGCG-CDs, HMT-CDs, and CUR-CDs.
Fourier transform infrared (FTIR) spectroscopy was used to investigate the surface functional groups of P-CDs (Fig. 2i). The characteristic resonances at 3370 and 3200 cm−1 can be attributed to the stretching vibrations of N−H and O−H groups [39], respectively. The peak in the region around 1617 cm−1 corresponds to the stretching vibration of C = C, which is associated with the aromatic ring or the conjugated regions in the carbon core. These results indicate that the introduction of polyphenols led to the incorporation of phenolic hydroxyl groups and the aromatic rings on the surface of P-CDs. Ultraviolet-visible (UV–vis) spectra of P-CDs displayed a distinct absorption peak at 275 nm, which is primarily attributed to the π-π* transition on the surface of P-CDs, typically associated with the C = C double bond structure in CDs. Moreover, the absorption peak at 330 nm indicated the presence of n-π* transitions, likely due to the C = O structures within the P-CDs. Compared with CA-CDs, the UV–vis spectra of P-CDs showed significant absorptions around 275 nm, suggesting that the introduction of polyphenol groups increased the conjugation of the CDs and enriched the optical properties (Fig. 2j and Fig. S3 in Supporting information).
X-ray photoelectron spectroscopy (XPS) was employed to analyze the composition and chemical states of elements contained in P-CDs. The survey XPS spectra provide an overview of the elemental composition (Fig. 2k), indicating the chemical structure of the polyphenol precursors significantly influences the functional groups distribution of the CDs. The contents of C, N, and O have been analyzed, and the different N contents can be attributed to the varied interactions of formamide with different polyphenols (Fig. 2l). The O 1s spectra showed peaks around 531 and 532 eV corresponding to C = O and O = C−O, respectively (Figs. 2m-p) [40]. The corresponding N 1s and C 1s spectra also demonstrated the presence of surface phenolic groups (Fig. S4 in Supporting information). Notably, the particle sizes of P-CDs derived from different polyphenols exhibited a strong inverse correlation with carbon content, as determined by both XPS analysis and the elemental composition of the precursors (R2 = 0.98 and 0.96, respectively; Fig. S5 in Supporting information). These results suggest that polyphenols with higher carbon ratios tend to generate smaller CDs, likely due to more compact carbonization and efficient incorporation during the solvothermal process. Proton nuclear magnetic resonance (1H NMR) was further employed to confirm the doping of polyphenols into CA-CDs (Figs. S6 and S7 in Supporting information). The results suggested the conversion of the aromatic rings of polyphenols into graphite. The absolute photoluminescence quantum yields (PLQY) of P-CDs were further measured with CUR-CDs exhibiting the highest PLQY of 9.77%, followed by EA-CDs at 5.69%, HMT-CDs at 5.65%, and EGCG-CDs at 4.63% (Fig. S8 in Supporting information). These results indicate that the polyphenol precursors significantly influence the optical properties of the P-CDs, likely due to differences in their molecular structures and the resulting surface functional groups.
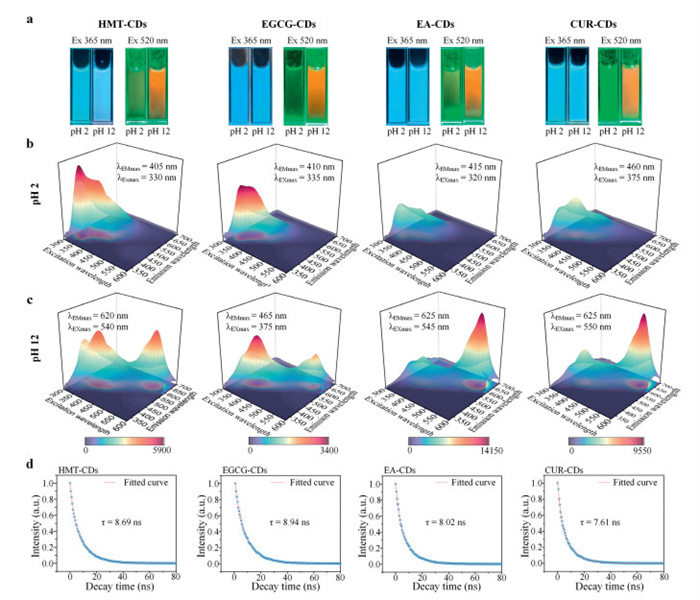
The synthesized P-CDs exhibit excitation- and pH-dependent emission, characterized by blue emission at acidic conditions (λex = 365 nm) and red emission under alkaline environments (λex = 520 nm) (Fig. 3a). These fluorescence and pH-responsiveness arise from the quantum confinement and the surface chemistry of the P-CDs. The blue emission is commonly seen in many other CDs prepared from CA under moderate carbonization temperatures (Fig. 3b) [41-43]. P-CDs possessed a core of graphitic or amorphous structure, where the core contains small-conjugated domains (sp/sp2 hybridization) contributed to the fluorescence. The small sizes (diameter < 10 nm) of P-CDs enabled quantum confinement effects favoring large bandgaps, contributing to the blue emission [44,45]. The red emission was only observed at alkaline conditions, which can be attributed to the deprotonation of the surface functional groups (Fig. 3c) [46]. The surface functional groups of P-CDs primarily consisted of carboxyl (−COOH), hydroxyl (−OH), and amine (−NH2) moieties derived from polyphenols, CA, and formamide. The deprotonation increases electron density on surface defects, facilitating intramolecular charge transfer to lower-energy trap states, which activates red emission [47]. The extended π-conjugation through oxidation of phenolic groups can further amplify the red emission under alkaline environments [48].
Figure 3
Figure 3.
pH-dependent fluorescence of P-CDs. (a) Blue and red fluorescence images of P-CDs at different excitation wavelengths under different pH. (b) 3D excitation-emission matrix of P-CDs at pH 2. (c) 3D excitation-emission matrix of P-CDs at pH 12. (d) PL lifetime spectra of P-CDs at 450 nm with an excitation wavelength of 370 nm.
During the switch of pH conditions, the size changes of the P-CDs were found by dynamic light scattering (DLS) (Fig. S9 in Supporting information). P-CDs aggregated to form particles with average diameters over 900 nm, which was caused by the protonation to form −COOH and −NH3+ groups, further reducing electrostatic repulsion and inducing aggregation via hydrogen bonds and hydrophobic interactions. In contrast, alkaline conditions (pH 12) deprotonate surface groups (−COO− and −NH2), enhancing colloidal stability (DLS size ~100 nm) and dispersity. The reversible pH response is evidenced by consistent red-to-blue fluorescence intensity ratios (±5%) across multiple acid-base cycles, highlighting structural robustness (Fig. S10 in Supporting information). The fluorescence lifetimes of the P-CDs were further investigated and were found 8.69 ns for HMT-CDs, 8.94 ns for EGCG-CDs, 8.02 ns for EA-CDs, and 7.61 ns for CUR-CDs, respectively (Fig. 3d). The nanosecond fluorescence lifetime of P-CDs indicated the potential for sensing applications [49].
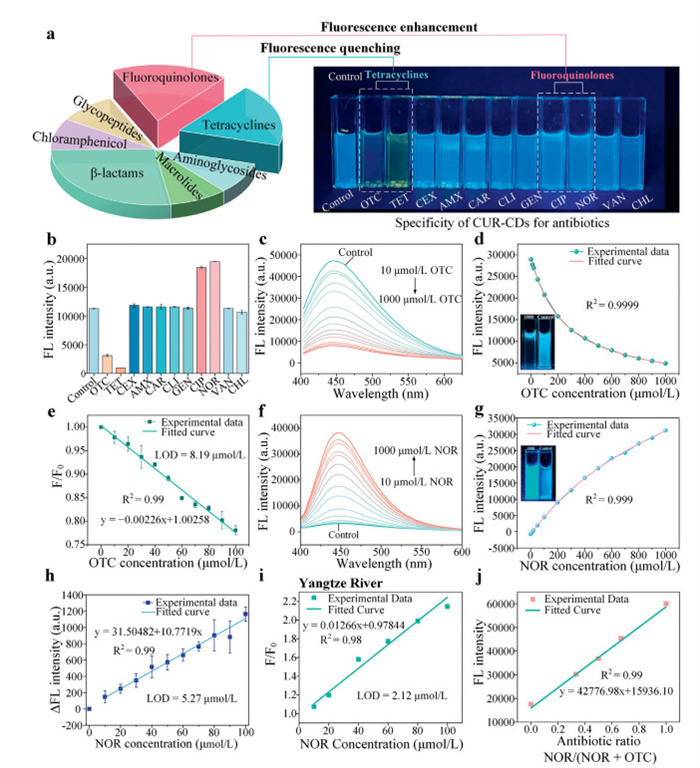
We further demonstrate the application of P-CDs as a ratiometric-sensing platform for antibiotic detection, where CUR-CD was selected as a representative. We employed eleven clinically prescribed antibiotics, including tetracycline (e.g., oxytetracycline (OTC) and tetracycline (TET)), quinolone (e.g., NOR and ciprofloxacin (CIP)), β-lactams (e.g., cefalexin (CEX), amoxicillin (AMX), and carbenicillin (CAR)), macrolides (e.g., clindamycin (CIL) and aminoglycosides (e.g., gentamicin (GEN)), glycopeptides (e.g., vancomycin (VAN)), and chloramphenicol (CHL). Only tetracycline and quinolone are selectively detected with the alternation of the fluorescence intensity of the P-CDs (Fig. 4a). The reason can be attributed to the stronger interactions of phenolic groups with tetracycline and quinolone compared with other antibiotics [43,44]. Notably, the P-CDs exhibit a divergent fluorescence response to these antibiotics: quenching in the presence of tetracyclines (e.g., OTC and TET) and enhancement upon interaction with quinolones (e.g., NOR and CIP) (Fig. 4b).
Figure 4
Figure 4.
Specific detection of tetracyclines and quinolones with P-CDs. (a) Quenching effect of tetracycline antibiotics and fluorescence enhancement effect of quinolone antibiotics. The chemical structures of 11 antibiotics are categorized, and fluorescence images of P-CDs reacting with the 11 antibiotics under 365 nm UV light are shown. (b) Bar graph of fluorescence intensity at 450 nm emission after P-CDs reacted with different antibiotics under 370 nm excitation. (c) Fluorescence spectra of CUR-CDs after adding different concentrations of OTC (from top to bottom: 10–1000 µmol/L). (d) Fluorescence intensity curve of CUR-CDs vs. OTC concentration (10–1000 µmol/L). (e) Plot of F/F0 (F0 as the control group) vs. OTC concentrations at low concentration ranges (0–100 µmol/L) of CUR-CDs. (f) Fluorescence spectra of CUR-CDs after adding different concentrations of NOR (from bottom to top: 10–1000 µmol/L). (g) Fluorescence intensity curve of CUR-CDs vs. NOR concentration (10–1000 µmol/L). (h) Plot of ΔF (ΔF = F - F0, where F and F0 represent fluorescence intensities with and without NOR) vs. NOR concentration at the low concentration ranges (0–100 µmol/L) of CUR-CDs. (ⅰ) Fluorescence response (F/F0) of CUR-CDs toward varying concentrations of NOR in Yangtze River. (j) Fluorescence intensity of CUR-CDs in mixtures of OTC and NOR with different NOR/(NOR + OTC) ratios. The linear correlation between fluorescence intensity and NOR ratio confirms the capability of CUR-CDs to respond to compositional changes in complex antibiotic mixtures. Data are presented as mean ± SD (n = 3).
OTC was selected to investigate the fluorescence quenching effects of P-CDs by tetracycline. The fluorescence quenching is proportional to the concentration of OTC and can be observed in a broad concentration variation from 10 µmol/L to 1000 µmol/L (Fig. 4c and Fig. S11 in Supporting information). The fluorescence quenching was found as a multi-mechanistic process, combining Förster resonance energy transfer (FRET) and static quenching, together with other minor contributions from electron transfer processes. The absorption spectrum of tetracycline overlaps significantly with the emission spectrum of P-CDs (Fig. S12 in Supporting information), enabling non-radiative energy transfer from photoexcited P-CDs to tetracycline molecules (FRET) to cause fluorescence quenching. The multiple hydrogen bonds between tetracyclines and P-CDs may assist the stabilization of the FRET. Concentration-dependent fluorescence studies of OTC revealed a logarithmic decay in the range of 10–1000 µmol/L (R2 = 0.9999), suggesting heterogeneous binding considering the surface chemistry of P-CDs (Fig. 4d). At lower OTC concentrations, high-affinity surface binding sites (e.g., phenolic groups) dominated and led to rapid fluorescence quenching. After saturation of these binding sites at higher concentrations, the residual quenching arose from weaker interactions with less accessible or lower-affinity sites manifesting as a logarithmic decay.
Notably, at low OTC concentration ranges from 10 µmol/L to 100 µmol/L, a linear decrease of fluorescence intensity was observed with a calculated limit of detection (LOD) of 8.19 µmol/L (Fig. 4e). The significant differences in the fluorescence intensity in each group demonstrated the sensitivity and potential of P-CDs as probes in trace OTC detection (Fig. S13a in Supporting information). The linear reduction also demonstrated a static quenching mechanism in the low OTC concentration ranges. The CA-CDs were also employed as a comparison. Although the similar logarithmic decay was observed in the OTC range of 10–1000 µmol/L, the low concentration range did not present a linear reduction in fluorescence intensity, where the detection was found as 50 µmol/L (Fig. S14 in Supporting information). These results suggested a 6-fold improvement in OTC detection for P-CDs, highlighting the enhanced binding affinity conferred by polyphenol surface functionalization. HMT-CDs, EA-CDs, and EGCG-CDs had also been applied to detect tetracyclines, where similar results were observed (Figs. S15-S17 in Supporting information).
In contrast, the fluorescence intensity of the CUR-CDs was eventually enhanced by adding different concentrations of quinolone (e.g., NOR) (Fig. S18 in Supporting information). This enhancement in PL intensity is mainly credited to the rich hydrogen bonds formation between the carboxyl, hydroxyl, and phenolic group of CUR-CDs, together with the doping of N from the formamide [50,51]. Additionally, the π-conjugated quinolone ring in NOR serves as an electron donor, facilitating charge transfer to the P-CDs' sp2-hybridized carbon domains. This charge transfer suppresses defect-induced quenching and promotes exciton recombination, further amplifying fluorescence intensity [52]. The fluorescence response exhibits an exponential enhancement over NOR concentrations of 1–1000 µmol/L (R2 = 0.999) with a LOD of 5.27 µmol/L (Figs. 4f-h). At lower concentrations (10–100 µmol/L), the linearity remains robust (ΔF vs. [NOR], R2 = 0.99), underscoring the sensitivity of detection (Fig. 4h). The significant differences in each fluorescence intensity and the unchanged differential suggested the potential of CUR-CDs as probes for the NOR detection (Fig. S19 in Supporting information).
We further examined the morphology changes of CUR-CDs after detection by TEM. Upon the interaction with OTC, the average particle size increased significantly to 37.38 nm, indicating the aggregation of CUR-CD nanoparticles and likely driven by the intermolecular interactions of OTC molecules with multiple CUR-CDs (Fig. S20a in Supporting information). This aggregation may also contribute to fluorescence quenching. In contrast, CUR-CDs exposed to NOR displayed minimal aggregation, with an average particle size of 3.46 nm (Fig. S20b in Supporting information). The subtle size increase can be attributed to hydrogen bonding and charge transfer interactions, which likely also enhance the fluorescence intensity of CUR-CDs. XPS measurements were also conducted to examine the CUR-CDs after detection. The significant changes in the spectra of O 1s indicate the interactions of CUR-CDs with antibiotics via hydrogen bonding, while no significant changes were observed in the spectra of C 1s and N 1s (Figs. S21 and S22 in Supporting information).
To comprehensively assess the environmental applicability and robustness of the developed P-CDs, we conducted a series of systematic experiments under realistic and complex conditions. The fluorescence of all four P-CDs remained stable in the presence of various common cations, heavy metals, and anions, confirming strong anti-interference capability (Fig. S23 in Supporting information). In addition, water samples from four representative rivers (Yangtze, Jialing, Jinsha, and Minjiang) were employed to mimic real-world matrices. CUR-CDs maintained consistent fluorescence in untreated river water (Fig. S24 in Supporting information), and exhibited excellent linear response toward both OTC and NOR across all four rivers (Fig. 4i, Figs. S25 and S26 in Supporting information). We also compared the CUR-CDs with other recent carbon-based probes for detection in real water environments (Table S3 in Supporting information). Moreover, CUR-CDs also responded linearly to compositional changes in OTC/NOR mixtures (Fig. 4j), highlighting their potential for monitoring multi-contaminant systems. Moreover, the P-CDs exhibited stability under a range of environmental factors, including varying temperatures (20–50 ℃), different salt concentrations, and continuous light exposure up to 60 min (Figs. S27-S29 in Supporting information).
In summary, we successfully synthesized P-CDs using a simple and scalable solvothermal method and enriched the surface functionalization of conventional CA-CDs with a series of polyphenols. The prepared P-CDs were demonstrated with potential for the selective detection of tetracycline and quinolone in aqueous environments. The integration of polyphenols endowed the pH-responsive surface chemistry and further enabled tunable emission, highlighting the adaptability of the P-CDs to environmental variations. Polyphenols also enriched surface functional groups of P-CDs, significantly enhancing the binding interactions with antibiotics. Distinct fluorescence responses were observed within the interactions of P-CDs and antibiotics: quenching for OTC with the LOD of 8.19 µmol/L via electron transfer and enhancement for NOR with the LOD of 5.27 µmol/L through hydrogen bonding and charge transfer interactions. The P-CDs exhibited superior sensitivity compared to conventional carbon-based probes, alongside exceptional stability across pH 2–12 and rapid detection (< 5 min), critical for practical applications. Our strategy demonstrated that the incorporation of polyphenols can enable the CDs a potential platform for addressing global antibiotic monitoring challenges with on-site and rapid demands.
Declaration of competing interest
The authors declare that they have no known competing financial interests or personal relationships that could have appeared to influence the work reported in this paper.
This work was supported by the National Key R&D Program of China (No. 2022YFA0912800), the National Excellent Young Scientists Fund (No. 00308054A1045), the National Natural Science Foundation of China (Nos. 22178233, 22408241, 22108181), the Talents Program of Sichuan Province, the Double First-Class University Plan of Sichuan University, the State Key Laboratory of Polymer Materials Engineering (No. sklpme 2020–03–01), the Tianfu Emei Program of Sichuan Province (No. 2022-EC02–00073-CG), Ministry of Education Key Laboratory of Leather Chemistry and Engineering, and National Engineering Research Center of Clean Technology in Leather Industry. The authors would like to thank W. Wang of the School of Materials Science and Engineering, Sichuan University, and Y. Wang of the Analytical and Testing Center, Sichuan University, for their assistance in fluorescence characterization. The authors also appreciate S. Wang of the Analytical and Testing Center of Sichuan University for her help in TEM characterization. The authors would like to thank X. He at the College of Biomass Science and Engineering of Sichuan University for characterization assistance.
Supplementary materials
Supplementary material associated with this article can be found, in the online version, at doi:10.1016/j.cclet.2025.111356.
W. Li, Y. Wu, X. Zhong, et al., Angew. Chem. Int. Ed. 62 (2023) e202303500. doi: 10.1002/anie.202303500
[19]
S.Y. Lim, W. Shen, Z. Gao, et al., Chem. Soc. Rev. 44 (2015) 362–381. doi: 10.1039/C4CS00269E
[20]
S. Lu, L. Sui, J. Liu, et al., Adv. Mater. 29 (2017) 1603443. doi: 10.1002/adma.201603443
[21]
K. Ahmad, M.A. Shinde, G. Song, et al., Inorg. Chem. Commun. 157 (2023) 111383. doi: 10.1016/j.inoche.2023.111383
[22]
Y. Hu, O. Seivert, Y. Tang, et al., Angew. Chem. Int. Ed. 63 (2024) e202412341. doi: 10.1002/anie.202412341
[23]
W. Raza, K. Ahmad, Graphitic carbon nitride-based photocatalysts for hydrogen production, in: K.Y. Cheong, A. Apblett (Eds.), Sustainable Materials and Green Processing For Energy Conversion, Elsevier, Amsterdam, 2022, pp. 213–236.
[24]
E.K. Adotey, M. Amouei Torkmahalleh, L. Tastanova, et al., J. Hazard. Mater. 462 (2024) 132671. doi: 10.1016/j.jhazmat.2023.132671
Figure 1
Polyphenol enriches the surface functionalization of CDs and achieves selective antibiotic detection. (a) Schematic of the preparation of P-CDs. (b) pH-dependent fluorescence of P-CDs. (c) Schematic of the selective and specific detection of antibiotics by P-CDs. (d) Photographs of the P-CDs under different pH conditions and the corresponding UV–vis absorption spectra.
Figure 2
Characterization of P-CDs. (a-d) TEM images of HMT-CDs, EGCG-CDs, EA-CDs, and CUR-CDs, with the inset showing the particle size distribution statistics (n = 100). (e-h) Raman spectroscopy of P-CDs derived from different polyphenol sources. (i) FTIR characterization of P-CDs. (j) UV–vis absorption spectra of P-CDs. (k) XPS survey spectrum of P-CDs. (l) Elemental analysis data of P-CDs. (m-p) XPS O 1s spectra of P-CDs.
Figure 3
pH-dependent fluorescence of P-CDs. (a) Blue and red fluorescence images of P-CDs at different excitation wavelengths under different pH. (b) 3D excitation-emission matrix of P-CDs at pH 2. (c) 3D excitation-emission matrix of P-CDs at pH 12. (d) PL lifetime spectra of P-CDs at 450 nm with an excitation wavelength of 370 nm.
Figure 4
Specific detection of tetracyclines and quinolones with P-CDs. (a) Quenching effect of tetracycline antibiotics and fluorescence enhancement effect of quinolone antibiotics. The chemical structures of 11 antibiotics are categorized, and fluorescence images of P-CDs reacting with the 11 antibiotics under 365 nm UV light are shown. (b) Bar graph of fluorescence intensity at 450 nm emission after P-CDs reacted with different antibiotics under 370 nm excitation. (c) Fluorescence spectra of CUR-CDs after adding different concentrations of OTC (from top to bottom: 10–1000 µmol/L). (d) Fluorescence intensity curve of CUR-CDs vs. OTC concentration (10–1000 µmol/L). (e) Plot of F/F0 (F0 as the control group) vs. OTC concentrations at low concentration ranges (0–100 µmol/L) of CUR-CDs. (f) Fluorescence spectra of CUR-CDs after adding different concentrations of NOR (from bottom to top: 10–1000 µmol/L). (g) Fluorescence intensity curve of CUR-CDs vs. NOR concentration (10–1000 µmol/L). (h) Plot of ΔF (ΔF = F - F0, where F and F0 represent fluorescence intensities with and without NOR) vs. NOR concentration at the low concentration ranges (0–100 µmol/L) of CUR-CDs. (ⅰ) Fluorescence response (F/F0) of CUR-CDs toward varying concentrations of NOR in Yangtze River. (j) Fluorescence intensity of CUR-CDs in mixtures of OTC and NOR with different NOR/(NOR + OTC) ratios. The linear correlation between fluorescence intensity and NOR ratio confirms the capability of CUR-CDs to respond to compositional changes in complex antibiotic mixtures. Data are presented as mean ± SD (n = 3).

 DownLoad:

 下载:
下载:


 下载:
下载:
